. 2022 Nov 9;14(670):eabn7336.
doi: 10.1126/scitranslmed.abn7336. Epub 2022 Nov 9.

BLIMP1 and NR4A3 transcription factors reciprocally regulate antitumor CAR T cell stemness and exhaustion

Affiliations

BLIMP1 and NR4A3 transcription factors reciprocally regulate antitumor CAR T cell stemness and exhaustion

In-Young Jung et al. Sci Transl Med. .

Abstract

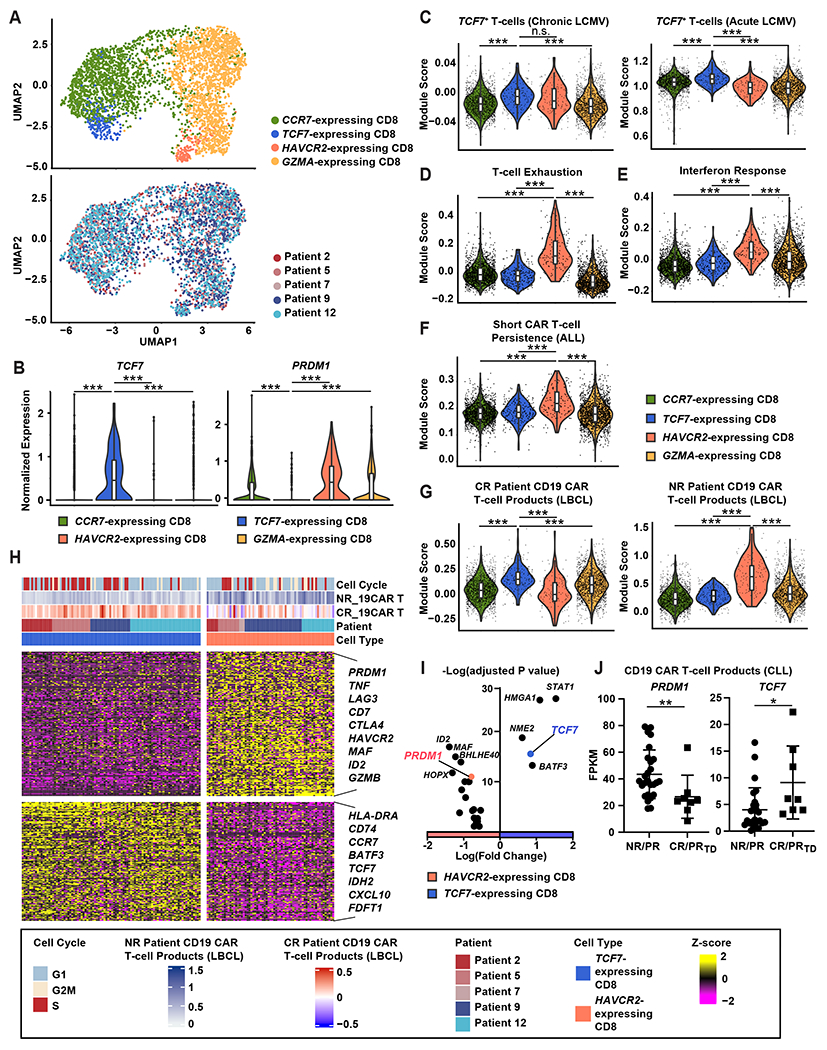
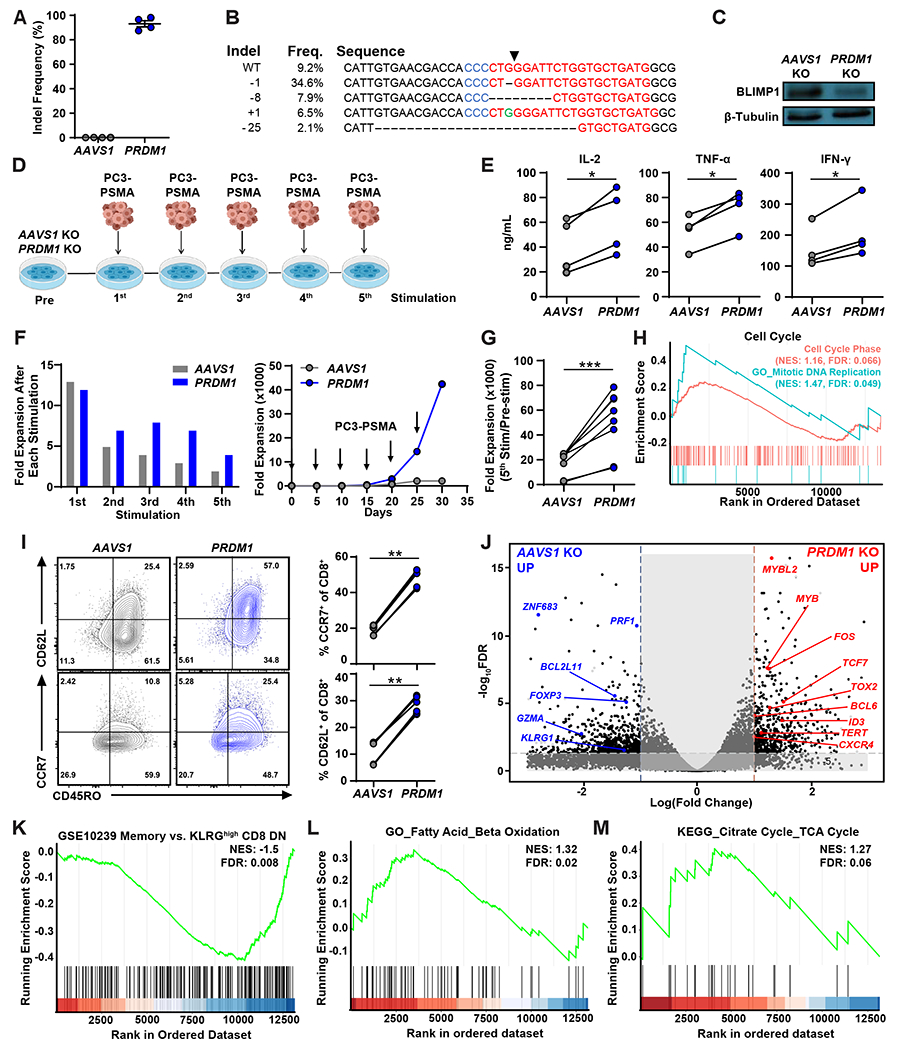
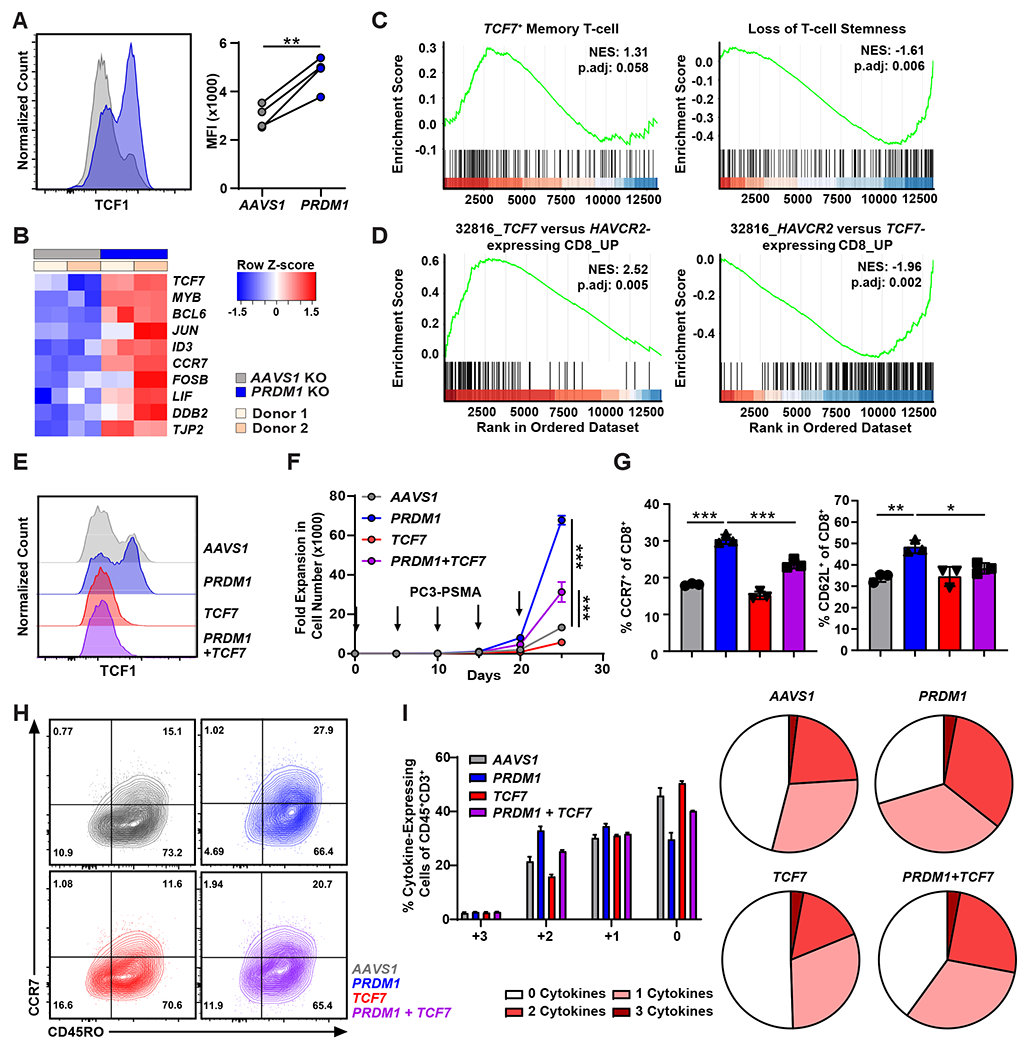
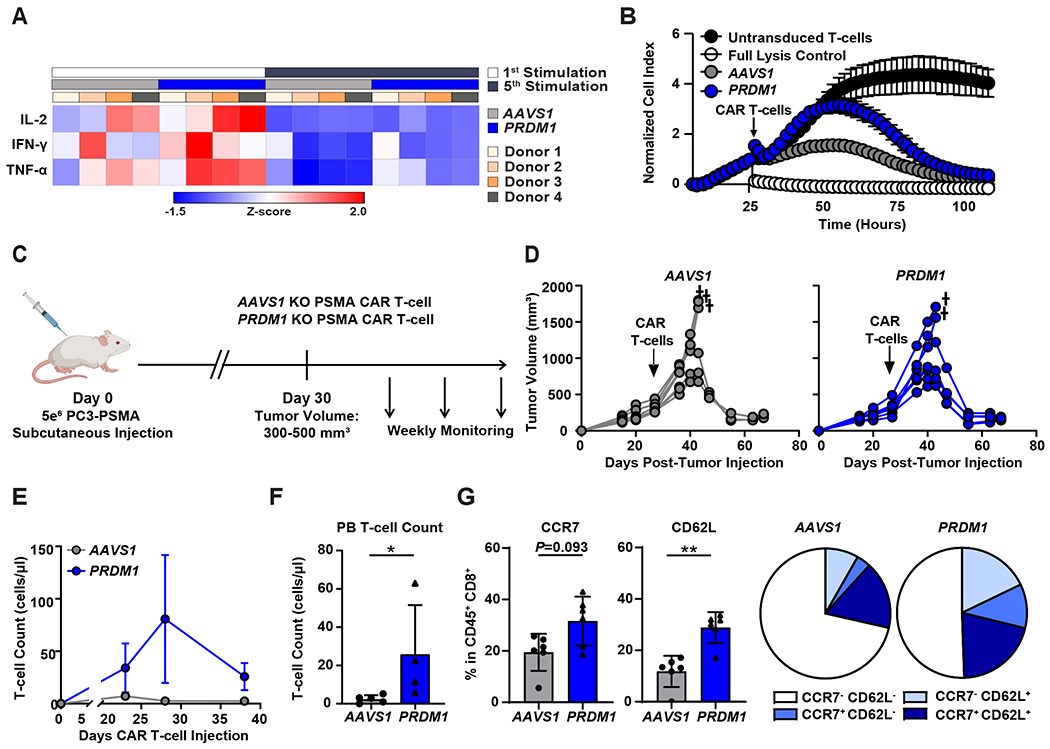
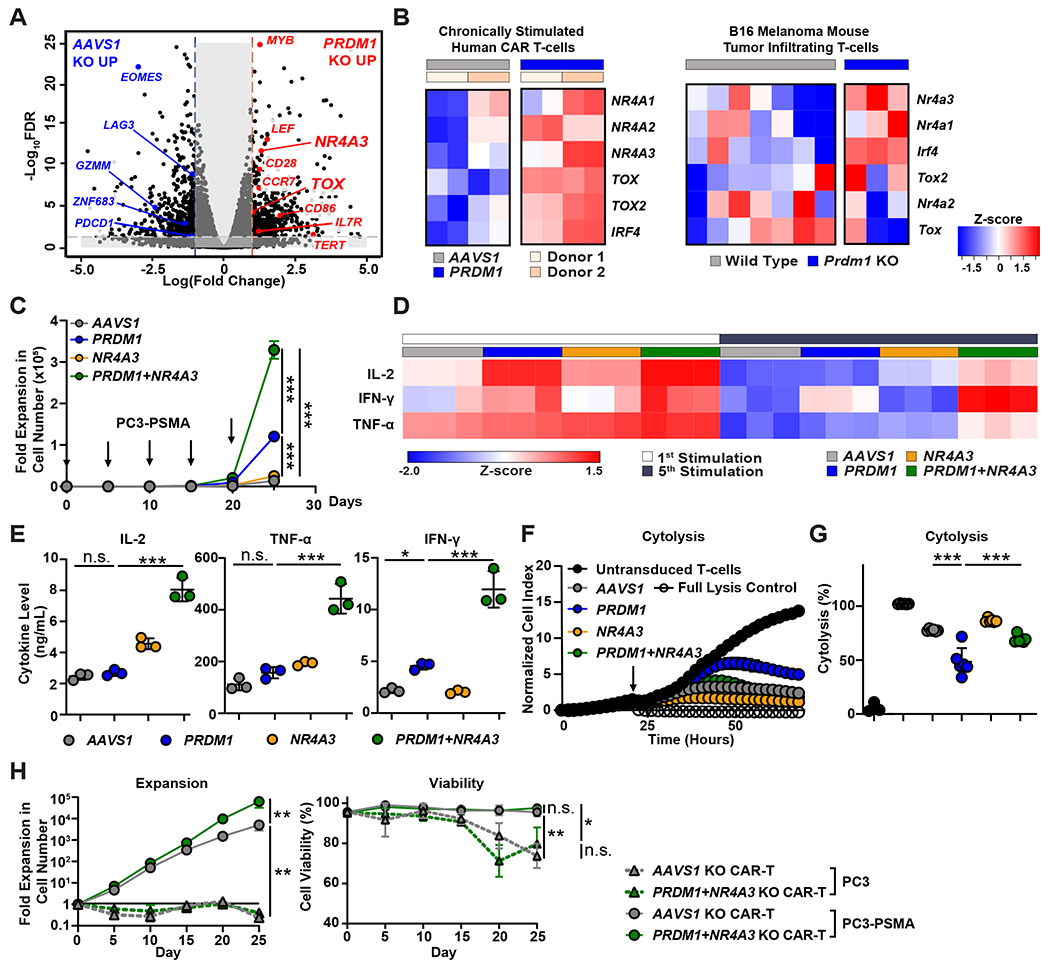
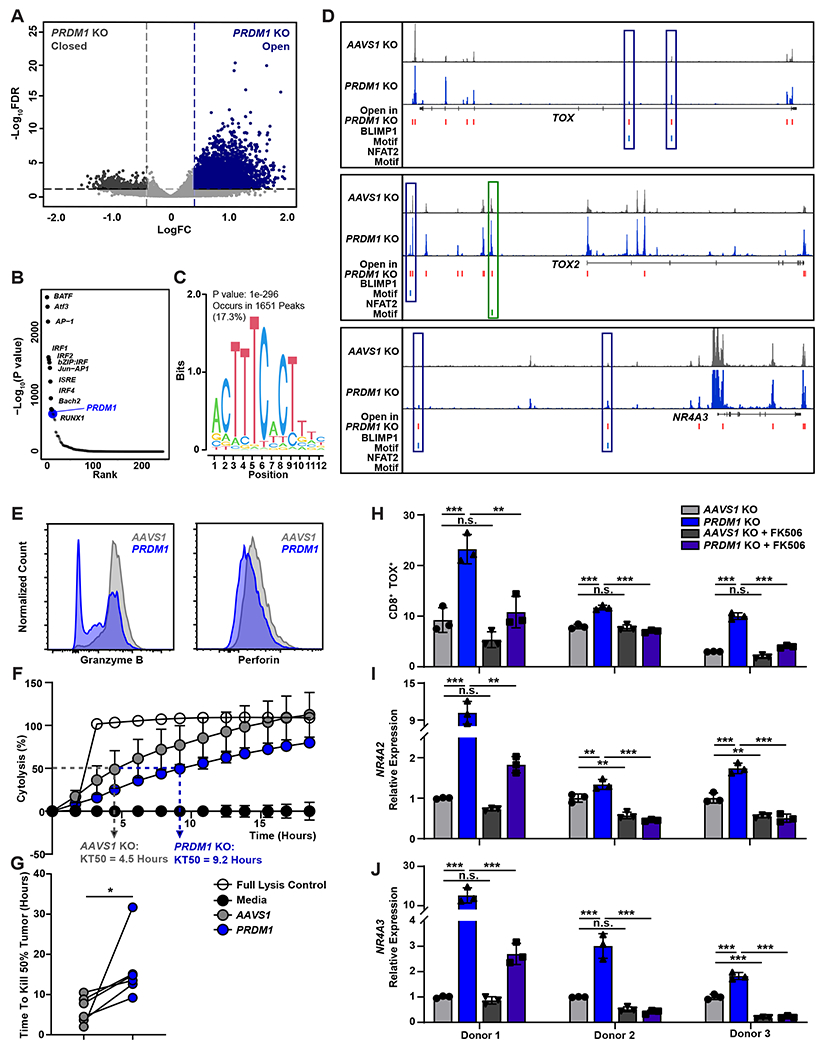
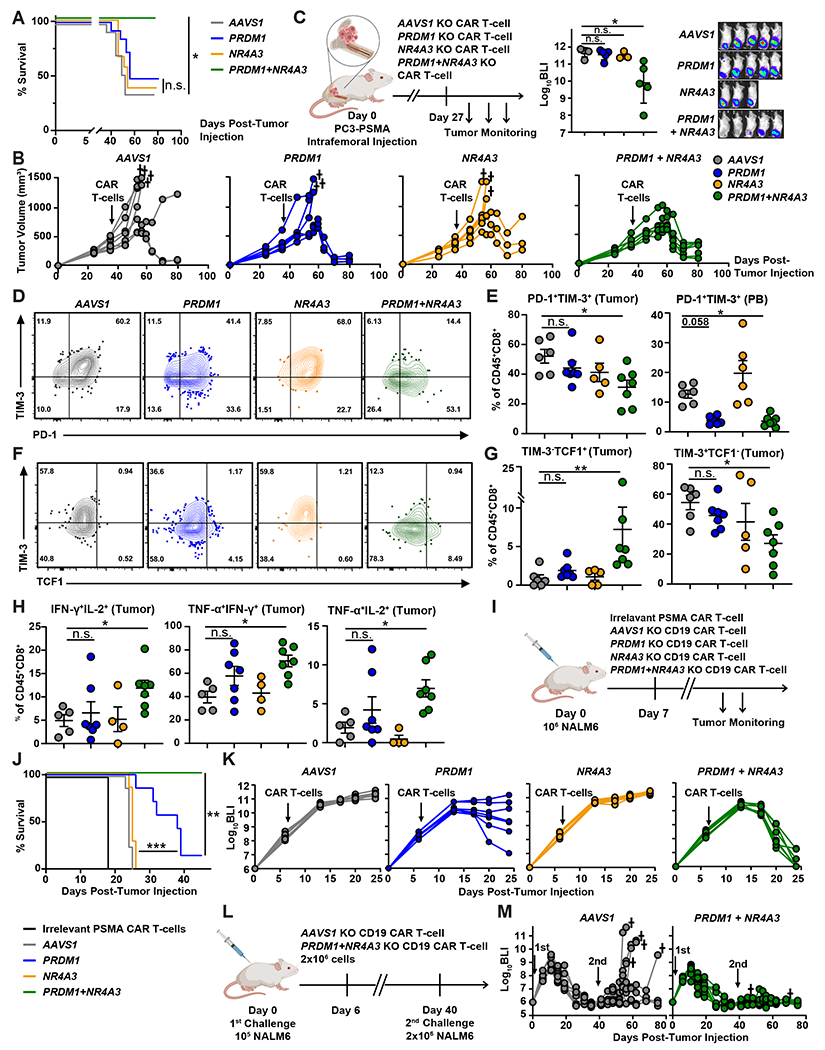
Chimeric antigen receptor (CAR) T cells have not induced meaningful clinical responses in solid tumors. Loss of T cell stemness, poor expansion capacity, and exhaustion during prolonged tumor antigen exposure are major causes of CAR T cell therapeutic resistance. Single-cell RNA-sequencing analysis of CAR T cells from a first-in-human trial in metastatic prostate cancer identified two independently validated cell states associated with antitumor potency or lack of efficacy. Low expression of PRDM1, encoding the BLIMP1 transcription factor, defined highly potent TCF7 [encoding T cell factor 1 (TCF1)]-expressing CD8+ CAR T cells, whereas enrichment of HAVCR2 [encoding T cell immunoglobulin and mucin-domain containing-3 (TIM-3)]-expressing CD8+ T cells with elevated PRDM1 was associated with poor outcomes. PRDM1 knockout promoted TCF7-dependent CAR T cell stemness and proliferation, resulting in marginally enhanced leukemia control in mice. However, in the setting of PRDM1 deficiency, a negative epigenetic feedback program of nuclear factor of activated T cells (NFAT)-driven T cell dysfunction was identified. This program was characterized by compensatory up-regulation of NR4A3 and other genes encoding exhaustion-related transcription factors that hampered T cell effector function in solid tumors. Dual knockout of PRDM1 and NR4A3 skewed CAR T cell phenotypes away from TIM-3+CD8+ and toward TCF1+CD8+ to counter exhaustion of tumor-infiltrating CAR T cells and improve antitumor responses, effects that were not achieved with PRDM1 and NR4A3 single knockout alone. These data underscore dual targeting of PRDM1 and NR4A3 as a promising approach to advance adoptive cell immuno-oncotherapy.


Conflict of interest statement

I.Y.J., S.F.L., M.M.D, D.L.S. and J.A.F. have filed patent applications in the field of T-cell therapy for cancer and have received royalties. Patents related to this work are as follows: Biomarkers and CAR T-cell therapies with enhanced efficacy (US20200087376A1) and CAR T-cell therapies with enhanced efficacy (US20210047405A1). M.M.D. and J.A.F. have received research funding from Tmunity Therapeutics. M.M.D. serves on the Scientific Advisory Board for Cellares Corporation. S.F.L. has served as a consultant for Novartis Pharmaceuticals, Kite Pharma, and Wugen and receives clinical trial funding from Novartis Pharmaceuticals. J.A.F. is a member of the Scientific Advisory Boards of Cartography Bio. and Shennon Biotechnologies Inc.

Figures

Figure 1.
Figure 1.. TCF7- and HAVCR2-expressing CD8+ populations within infusion products are associated with favorable and poor CAR T-cell therapeutic potency, respectively.
(A) Uniform manifold approximation and projection (UMAP) plots showing sub-clustering of CD8+ T-cells from CAR T-cell infusion products for patients with mCRPC. Cells are labeled according to marker gene expression and patient origin. (B) Expression of PRDM1 and TCF7 is shown for CD8+ T-cell subclusters. (C to E) Scores of gene signatures enriched in (C) TCF7-expressing T-cells in LCMV clone 13 (GSE83978; left) and LCMV Armstrong infection (GSE83978; right), (D) exhausted T-cells (GSE136796) and (E) the IFN response (dbGaP phs002323.v1.p1) are shown. (F and G) Shown are CD8+ T-cell subcluster-specific gene signature scores enriched in (F) pre-manufactured T-cells from patients with ALL with poor CD19 CAR T-cell persistence (dbGaP phs002323.v1.p1) and (G) anti-CD19 CAR T-cell infusion products of complete responder patients (CR) and non-responder (NR) patients with LBCL (GSE151511). (H) Differentially expressed genes were compared between TCF7- and HAVCR2-expressing CD8+ clusters. Top bars indicate cell clusters, patient origin, CD19 CAR T-cell response score (GSE151511), and cell cycle. (I) Differential expression of transcription factors between TCF7- and HAVCR2-expressing CD8+ clusters is shown. (J) PRDM1 and TCF7 expression was evaluated in CD19 CAR-T infusion products from patients with chronic lymphocytic leukemia (CLL; CR: complete response; PRTD: very good partial response; PR: partial response; NR: no response); FPKM: Fragments per kilo base of transcript per million mapped fragments. *P < 0.05, **P < 0.01, ***P < 0.001, n.s., not significant as measured by Kruskal-Wallis test with a post-hoc Dunn’s multiple comparison test. Violin plots in (B) to (G) indicate the distribution of data with rectangles in the middle of the density curves showing the ends of the first and third quartiles and central horizontal line depicting the median. Horizontal bars in (J) show the mean.
Figure 2.
Figure 2.. CRISPR/Cas9-mediated PRDM1 KO potentiates early memory PSMA CAR T-cell differentiation.
(A) PRDM1 editing efficiency was measured by Sanger sequencing and subsequent TIDE (Tracking of Indels by Decomposition) analysis. Data are presented as scatter points, where the mean and S.E.M. bars are included. (B) Amplicon sequencing of PRDM1 indel variants generated by CRISPR/Cas9-mediated gene editing is shown. Arrow indicates cleavage site. (C) Representative Western blot analysis for BLIMP1 expression is shown. (D) Schematic of the restimulation assay used to “stress test” PRDM1 KO PSMA CAR T-cells. CAR T-cells were challenged with PSMA-expressing PC3 prostate tumor targets every 4 to 5 days at an effector to target (E:T) ratio of 3:1. (E) Effector cytokines produced by CAR T-cells after the initial tumor cell challenge. (F) Representative CAR T-cell expansion kinetics during the restimulation assay for one donor are shown. Left: CAR T-cell expansion after each stimulation, Right: Cumulative CAR T-cell expansion. Arrows indicate the timing of PC3-PSMA tumor cell challenge. (G) Summary of the expansion capacity of AAVS1 and PRDM1 KO CAR T-cells during the restimulation assay with four different donors. (H) Gene set enrichment analysis (GSEA) of PRDM1 KO versus AAVS1 KO CAR T-cells comparing gene signatures related to the cell cycle and mitotic DNA replication. CAR-T samples were harvested on day 5 following the first tumor challenge. NES: normalized enrichment score, FDR: false discovery rate. (I) Early memory marker expression was measured by flow cytometry after two consecutive tumor cell stimulations. (J) Volcano plot displaying the results of differential gene expression analysis when comparing PRDM1 KO to control AAVS1 KO CAR T-cells. (K to M) GSEA of PRDM1 KO versus AAVS1 KO CAR T-cells comparing gene sets associated with (K) memory T-cells (GSE10239), (L) GO_Fatty acid_Beta oxidation, and (M) the KEGG_TCA cycle. All knockout and restimulation experiments were conducted with CAR T-cells manufactured from 4 different healthy donors. RNA-seq experiments were conducted with CAR T-cells manufactured from 2 different healthy individuals, each with replicates generated from two independent experiments. *P < 0.05, **P < 0.01, ***P < 0.001, as measured by paired t-tests.
Figure 3.
Figure 3.. PRDM1 KO increases TCF7 expression and enhances early memory CAR T-cell differentiation in a TCF7-dependent manner.
(A) TCF1 expression was measured by flow cytometric analysis of PRDM1 KO versus AAVS1 KO PSMA CAR T-cells. CAR T-cells derived from n = 4 different healthy individuals. MFI: mean fluorescence intensity. (B) Analysis of CAR T-cells for transcripts enriched in TCF7-expressing stem cell-like T-cells previously observed in LCMV mouse models (GSE83978). (C) GSEA of PRDM1 KO relative to AAVS1 KO CAR T-cells comparing gene sets associated with a TCF7+ T-cell memory state (GSE83978) and loss of stemness (GSE84105). p.adj, adjusted P value. (D) GSEA of PRDM1 KO versus AAVS1 KO CAR T-cells evaluating gene sets enriched in TCF7+ (left) and HAVCR2+ CD8+ clusters (right). Gene signatures were derived from CAR T-cell infusion products of patients with mCRPC shown in Figure 1. (E) Representative histogram shows TCF1 expression by flow cytometry in PRDM1 and TCF7 KO CAR T-cell variants. (F) Expansion kinetics are shown during a restimulation assay of gene-edited CAR T-cells. CAR T-cells were challenged with PC3-PSMA target cells every 5 days at an E:T of 3:1. Arrows indicate the timing of PC3-PSMA cell restimulation. Data represent the mean ± S.D. (n = 3 independent experiments). (G) Frequencies of CAR T-cell variants expressing CCR7 and CD62L and (H) representative flow cytometry plots showing CCR7 and CD45RO expression following the first in vitro tumor cell challenge. Data indicate mean ± S.D. from n = 3 independent experiments. (I) CAR T-cell polyfunctionality (IL-2, IFN-γ and TNF-α expression) was evaluated after a 15-hour co-culture with PC3-PSMA cells. Data show mean ± S.D. from n = 3 independent experiments. *P < 0.05, **P < 0.01, ***P < 0.001. Data in panel (A) and panels (F and G) were analyzed using a paired t-test and one-way ANOVA test with a post-hoc Tukey’s multiple comparison test, respectively.
Figure 4.
Figure 4.. PRDM1 KO marginally enhances solid tumor control, despite increases in CAR T-cell early memory phenotype and proliferative capacity.
(A and B) CAR T-cells were restimulated five times with PC3-PSMA target cells every 4 to 5 days at an E:T ratio of 3:1. (A) The heat map shows the relative effector cytokine secretion by AAVS1 KO and PRDM1 KO CAR T-cells after first and fifth tumor cell restimulations. (B) Killing kinetics of AAVS1 KO and PRDM1 KO CAR T-cells are shown. CAR T-cells were isolated after the fifth restimulation timepoint and co-cultured with PC3-PSMA cells at a ratio of E:T = 3:1. Cytotoxicity was monitored by real-time cellular impedance monitoring technology (xCELLigence). T-cells without CAR transduction were used as a negative control and 20% Tween-20 treatment served as a full lysis control. Data are expressed as mean ± S.D. from n = 6 individual donors. (C) A schematic of the high tumor burden PC3-PSMA xenograft mouse model. Male NSG mice were subcutaneously transplanted with 5 × 10⁶ PC3-PSMA cells, and 3.5 × 10⁵ PSMA CAR T-cells were given intravenously when tumor volume reached about 500 mm3. (D) Tumor growth was monitored by caliper measurements. † = death. (E) CAR T-cell expansion kinetics in the peripheral blood are shown. (F) Absolute numbers of human T-cells in the peripheral blood on day 38 post-CAR T-cell injection are shown. (G) Frequencies of peripheral blood CAR T-cells expressing CCR7 and CD62L were measured by flow cytometry. Data are shown as mean ± S.D.; n = 6 for (D) and (G) and n = 4 to 5 for (E) and (F). *P < 0.05, **P < 0.01, as determined by Mann Whitney U tests.
Figure 5.
Figure 5.. PRDM1 KO CAR T-cells fail to sustain antitumor effector function due to upregulation of exhaustion-related transcription factors.
(A) CD8+ CAR T-cells were isolated after the fourth tumor restimulation for bulk RNA-seq. The volcano plot illustrates differential gene expression analysis in PRDM1 KO compared to control AAVS1 KO CAR T-cells after the fourth consecutive tumor cell challenge. (B) The heat map shows expression of transcription factor-encoding genes associated with T-cell exhaustion. RNA-seq experiments were conducted with CAR T-cells manufactured from 2 different individuals, each with replicates generated from two independent experiments (left). A similar profile of exhausted murine TILs (GSE113221) is shown in the right panel. (C) Expansion kinetics of PRDM1 and NR4A3 KO CAR T-cells during a restimulation assay. PSMA CAR T-cells were challenged with PC3-PSMA tumor cells every 5 days at an E:T ratio of 3:1. Arrows indicate the timing of PC3-PSMA challenge. Data are mean ± S.D. from n = 3 different donors. (D and E) Concentrations of effector cytokines produced by AAVS1 KO, PRDM1 KO, NR4A3 KO and PRDM1/NR4A3 dual KO CAR T-cells are shown. (D) The heat map shows effector cytokine secretion 24 hours following the first and fifth tumor cell challenges. (E) Graphical summaries are shown for effector cytokine production after the fifth CAR T-cell stimulation with tumor targets. Data are mean ± S.D. (n = 3). (F) Killing kinetics are shown for the indicated CAR T-cell/tumor cell co-cultures. (G) CAR T-cells were isolated after the fifth round of antigen stimulation and co-cultured with PC3-PSMA tumor cells at an E:T ratio of 3:1 for a “stressed” cytotoxicity assay. Data in (F and G) indicate mean ± S.D. (n = 6). For (C to G), data are representative of 3 independent experiments performed with engineered CAR T-cells manufactured from 3 different healthy individuals. (H) CAR T-cells were repetitively challenged with PC3 or PC3-PSMA tumor targets every 5 days at an E:T ratio of 3:1. The expansion capacity (left) and viability (right) of CAR T-cells were assessed over time. Data are depicted as the mean ± S.D. from n = 3 independent donors assayed in 2 independent experiments. For all panels, *P < 0.05, **P < 0.01, ***P < 0.001, n.s., not significant, as determined by a one-way ANOVA test with a post-hoc Tukey’s multiple comparison test.
Figure 6.
Figure 6.. Upregulation of exhaustion-related transcription factors in PRDM1 KO CAR T-cells is attributed to increased chromatin accessibility and calcineurin-NFAT signaling.
(A to D) ATAC-seq analysis of AAVS1 KO and PRDM1 KO CAR T-cells is shown. At the end of manufacturing, CAR+ T-cells were enriched and subjected to ATAC-seq analysis. (A) The volcano plot shows differentially accessible chromatin regions. (B) Top transcription factor motifs enriched in PRDM1 KO compared to AAVS1 KO CAR T-cells are shown. (C) A BLIMP1 binding motif enriched in open chromatin regions of PRDM1 KO CAR T-cells is shown. The P value was calculated by HOMER motif analysis. (D) ATAC–seq tracks of TOX, TOX2, and NR4A3 loci are shown. Open chromatin regions in PRDM1 KO CAR T-cells and the binding motifs of BLIMP1 and NFAT2 are indicated. ATAC-seq experiments were conducted with CAR T-cells manufactured from 2 different donors, each with replicates generated from two independent experiments. (E) Expression of granzyme B and perforin were measured by flow cytometry. (F and G) A cytotoxicity assay was used to determine the time needed to kill 50% of tumor target cells (KT50). (F) Representative killing kinetics of AAVS1 and PRDM1 KO CAR T-cells are shown. Data show mean ± S.D. (n = 3). (G) KT50 values were compared between AAVS1 and PRDM1 KO CAR T-cells. Data were generated from 6 independent experiments with CAR T-cells manufactured from 4 different donors. (H to J) Expression of exhaustion-related TOX, NR4A2 and NR4A3 following repetitive tumor cell challenges is shown. AAVS1 KO and PRDM1 KO CAR T-cells were challenged with PC3-PSMA cells every 2 to 4 days at an E:T ratio of 1:1 in the presence or absence of 100 nM FK506. Following two consecutive rounds of stimulation, CAR T-cells were isolated and expression of exhaustion-associated transcription factors or corresponding genes were measured. (H) TOX expression was measured by flow cytometry. (I) NR4A2 and (J) NR4A3 expression were measured by qRT-PCR. Data indicate mean ± S.D. (n = 3). *P < 0.05, *P < 0.01, ***P < 0.001, n.s., not significant. Data in (G) and (H to J) were analyzed using a paired t-test and one-way ANOVA test with a post-hoc Tukey’s multiple comparison test, respectively.
Figure 7.
Figure 7.. PRDM1/NR4A3 dual KO enhances in vivo CAR T-cell antitumor activity by preserving TCF1+CD8+ T-cells and increasing effector function.
(A and B) Male NSG mice were subcutaneously engrafted with 5 × 10⁶ PC3-PSMA tumor cells, and 3.5 × 10⁵ PSMA CAR T-cells were given intravenously when tumor volume reached about 500 mm3. (A) Kaplan–Meier curves showing overall survival in each group. The Gehan-Breslow-Wilcoxon test was used for statistical analysis (n = 12 to 14 mice per group). (B) Tumor growth was monitored over time in a representative experiment. (C) Male NSG mice were intrafemorally injected with 2 × 10⁵ PC3-PSMA tumor cells. On day 27, 1 to 2 × 10⁵ PSMA CAR T-cells were injected intravenously, and tumor burden was measured by bioluminescent imaging (BLI, (p/sec/cm2/sr)). (D to H) Tumor and peripheral blood (PB) samples were harvested from mice injected subcutaneously with PC3-PSMA tumor cells on day 45 post-tumor implantation, when the tumor size was comparable between the groups. Samples were stained with hCD45, murine CD45 (mCD45), CD4, and CD8 antibodies and analyzed by flow cytometry. (D) Representative flow cytometry plots (E) and quantification show frequencies of cells expressing PD-1 and TIM-3 in CD45+CD8+ T-cells derived from PB and tumors. Representative flow cytometry plots in (D) show a tumor sample. (F) Representative flow cytometry plots and (G) quantification show frequencies of TIM-3- and TCF1-expressing CD45+CD8+ T-cells derived from tumors. (H) Effector cytokine expression was measured by flow cytometry following ex vivo stimulation of CAR TILs. TILs were activated with 50 ng/mL PMA and 1 μg/mL ionomycin in presence of 5 μg/mL Brefeldin A for 6-hours, followed by IFN-γ and TNF-α staining (n = 4 to 7). Statistical analysis in (C, E, G, and H) was conducted using a Kruskal-Wallis test with a post-hoc Dunn’s multiple comparisons test, *P < 0.05, **P < 0.01, n.s., not significant; mean ± S.E.M. shown. (I) A schematic of the NALM-6 xenograft model. Briefly, NSG mice were intravenously injected with 1 × 10⁶ NALM6-CBG cells. On day 7 post tumor injection, 3 × 10⁵ gene-edited anti-CD19 or control CAR T-cells were treated (n = 7 to 8 per group). (J) survival and (K) graphical summaries of longitudinal bioluminescent tumor burden are shown for NSG mice treated, as indicated. Data are representative of two independent experiments. The Gehan-Breslow-Wilcoxon test was used for survival analysis shown in (J). (L) A schematic of the NALM-6 rechallenge model is shown. Briefly, NSG mice were intravenously injected with 1 × 10⁵ NALM6-CBG cells. On day 6 post-tumor injection, 2 × 10⁶ anti-CD19 CAR T-cells were infused (n = 9 to 10 per group). Surviving mice were rechallenged with a second dose of NALM-6 cells on day 40. (M) Longitudinal tumor burden is shown.

References

    1. Porter DL, Hwang W-T, Frey NV, Lacey SF, Shaw PA, Loren AW, Bagg A, Marcucci KT, Shen A, Gonzalez V, Ambrose D, Grupp SA, Chew A, Zheng Z, Milone MC, Levine BL, Melenhorst JJ, June CH, Chimeric antigen receptor T cells persist and induce sustained remissions in relapsed refractory chronic lymphocytic leukemia. Science Translational Medicine 7, 303ra139–303ra139 (2015); published online EpubSeptember 2, 2015 (10.1126/scitranslmed.aac5415). - DOI - PMC - PubMed
    1. Neelapu SS, Locke FL, Bartlett NL, Lekakis LJ, Miklos DB, Jacobson CA, Braunschweig I, Oluwole OO, Siddiqi T, Lin Y, Timmerman JM, Stiff PJ, Friedberg JW, Flinn IW, Goy A, Hill BT, Smith MR, Deol A, Farooq U, McSweeney P, Munoz J, Avivi I, Castro JE, Westin JR, Chavez JC, Ghobadi A, Komanduri KV, Levy R, Jacobsen ED, Witzig TE, Reagan P, Bot A, Rossi J, Navale L, Jiang Y, Aycock J, Elias M, Chang D, Wiezorek J, Go WY, Axicabtagene Ciloleucel CAR T-Cell Therapy in Refractory Large B-Cell Lymphoma. The New England Journal of Medicine 377, 2531–2544 (2017); published online Epub2017-12-28 (10.1056/NEJMoa1707447). - DOI - PMC - PubMed
    1. Maude SL, Laetsch TW, Buechner J, Rives S, Boyer M, Bittencourt H, Bader P, Verneris MR, Stefanski HE, Myers GD, Qayed M, De Moerloose B, Hiramatsu H, Schlis K, Davis KL, Martin PL, Nemecek ER, Yanik GA, Peters C, Baruchel A, Boissel N, Mechinaud F, Balduzzi A, Krueger J, June CH, Levine BL, Wood P, Taran T, Leung M, Mueller KT, Zhang Y, Sen K, Lebwohl D, Pulsipher MA, Grupp SA, Tisagenlecleucel in Children and Young Adults with B-Cell Lymphoblastic Leukemia. The New England Journal of Medicine 378, 439–448 (2018); published online Epub2018-02-01 (10.1056/NEJMoa1709866). - DOI - PMC - PubMed
    1. Raje N, Berdeja J, Lin Y, Siegel D, Jagannath S, Madduri D, Liedtke M, Rosenblatt J, Maus MV, Turka A, Lam LP, Morgan RA, Friedman K, Massaro M, Wang J, Russotti G, Yang Z, Campbell T, Hege K, Petrocca F, Quigley MT, Munshi N, Kochenderfer JN, Anti-BCMA CAR T-Cell Therapy bb2121 in Relapsed or Refractory Multiple Myeloma. N Engl J Med 380, 1726–1737 (2019); published online EpubMay 2 (10.1056/NEJMoa1817226). - DOI - PMC - PubMed
    1. Cohen AD, Garfall AL, Stadtmauer EA, Melenhorst JJ, Lacey SF, Lancaster E, Vogl DT, Weiss BM, Dengel K, Nelson A, Plesa G, Chen F, Davis MM, Hwang WT, Young RM, Brogdon JL, Isaacs R, Pruteanu-Malinici I, Siegel DL, Levine BL, June CH, Milone MC, B cell maturation antigen-specific CAR T cells are clinically active in multiple myeloma. J Clin Invest 129, 2210–2221 (2019); published online EpubMar 21 (10.1172/JCI126397). - DOI - PMC - PubMed

Publication types

MeSH terms