. 2022 Nov 11;8(45):eabm3548.
doi: 10.1126/sciadv.abm3548. Epub 2022 Nov 9.

Identification of a minority population of LMO2+ breast cancer cells that integrate into the vasculature and initiate metastasis

Affiliations

Identification of a minority population of LMO2+ breast cancer cells that integrate into the vasculature and initiate metastasis

Shaheen S Sikandar et al. Sci Adv. .

Abstract

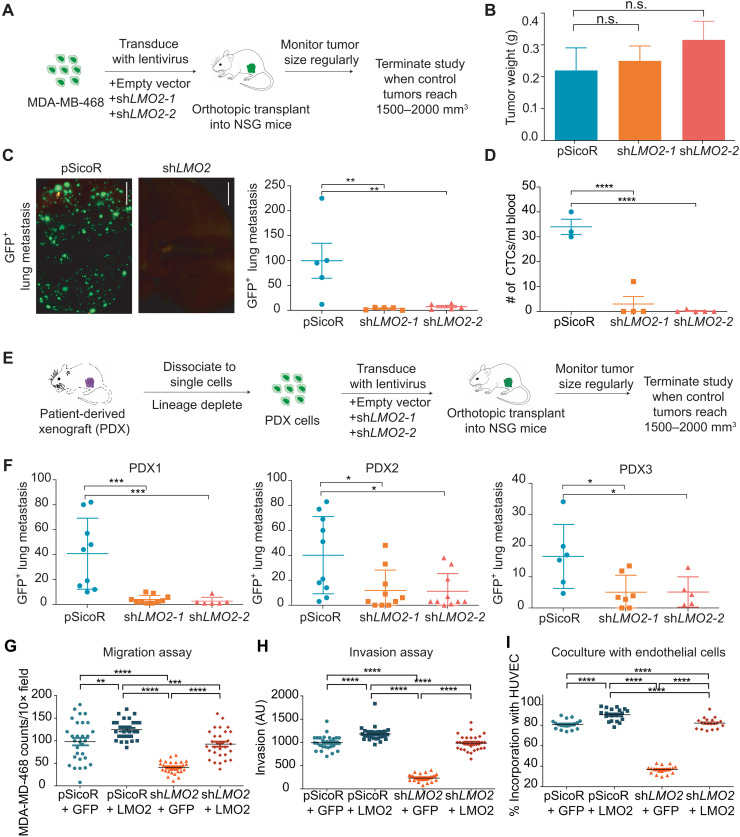
Metastasis is responsible for most breast cancer-related deaths; however, identifying the cellular determinants of metastasis has remained challenging. Here, we identified a minority population of immature THY1+/VEGFA+ tumor epithelial cells in human breast tumor biopsies that display angiogenic features and are marked by the expression of the oncogene, LMO2. Higher abundance of LMO2+ basal cells correlated with tumor endothelial content and predicted poor distant recurrence-free survival in patients. Using MMTV-PyMT/Lmo2CreERT2 mice, we demonstrated that Lmo2 lineage-traced cells integrate into the vasculature and have a higher propensity to metastasize. LMO2 knockdown in human breast tumors reduced lung metastasis by impairing intravasation, leading to a reduced frequency of circulating tumor cells. Mechanistically, we find that LMO2 binds to STAT3 and is required for STAT3 activation by tumor necrosis factor-α and interleukin-6. Collectively, our study identifies a population of metastasis-initiating cells with angiogenic features and establishes the LMO2-STAT3 signaling axis as a therapeutic target in breast cancer metastasis.


Figures

Fig. 1.
Fig. 1.. Identification of an immature basal epithelial population associated with proangiogenic signaling and poor survival in human breast cancer.
(A) Differentiation scores of basal epithelial cells from 17 human breast tumors profiled by scRNA-seq. Differentiation scores (0, more differentiated; 1, less differentiated) were determined by CytoTRACE (13). *P < 0.1; **P < 0.05; ***P < 0.01, unpaired two-tailed t test. (B) Plot showing protein-coding genes ordered by their enrichment in THY1+/ VEGFA+ basal cells from (A). (C) Paired bar plots showing fraction of LMO2+ cells in THY1+/VEGFA+ cells (red) and other cells (blue) in two human breast cancer datasets, tumor cells only, (n = 659) (23), and the basal cells (n = 910) from this study. Individual and combined P values by Fisher’s method. *P < 0.1; **P < 0.05; ***P < 0.01. (D) Heatmap depicting the top 30 differentially expressed genes, with selected lineage markers, in LMO2+ (n = 7 cells) versus LMO2 (n = 903 cells) basal epithelial cells from (A). A random subsample of 50 LMO2 basal cell transcriptomes is shown. Color scale (above) represents z score–normalized expression per gene. (E) Differential enrichment of the HALLMARK_ANGIOGENESIS pathway in LMO2+ versus LMO2 human breast cancer datasets described in (C). An empirical P value was calculated by Monte Carlo Approach (Materials and Methods). Combined P value by Fisher’s method *P < 0.1; **P < 0.05; ***P < 0.01. (F and G) Cell-type and survival association of LMO2+ basal cells across 508 bulk human breast tumor transcriptomes (18) deconvolved using CIBERSORTx. ER, estrogen receptor. (F) Coassociation patterns among cell type abundance profiles in bulk breast tumors, quantified by Pearson correlation. (G) Kaplan Meier curves showing differences in distant recurrence–free survival (DRFS) stratified by the median abundance of LMO2+ basal epithelial cells. DRFS was modeled as a function of LMO2+ basal cell status and ESR1 status (Materials and Methods). Adjusted log-rank P value and hazard ratio (HR) with 95% confidence interval for LMO2+ basal cell status is shown. ER, estrogen receptor.
Fig. 2.
Fig. 2.. Lmo2 lineage–traced tumor epithelial cells integrate into the vasculature and can form metastasis in PyMT tumors.
(A) Schematic diagram showing generation of the triple transgenic Rosa26mTmG reporter with MMTV-PyMT and Lmo2-CreERT2 mice (referred to as Lmo2-PyMT). (B) Schematic diagram showing the experimental scheme for Lmo2-PyMT tumors treated with tamoxifen. (C) Left Panel: FACS analysis of Lmo2-PyMT tumors 48 hours after tamoxifen pulse. Cells are gated on lineage (CD45, CD31, and Ter119) and DAPI cells (see fig. S3) and analyzed using TdTomato+ and GFP+. Middle and Right Panels: EpCAM and CD49f expression status in GFP+ and TdTomato+ cells. (D) Quantification of GFP+ cells from Lmo2-PyMT tumors (n = 5 mice). (E) Representative immunofluorescence image of Lmo2 lineage–traced cells (GFP+ green) colocalizing and integrating with endomucin (magenta)–stained tumor vasculature. High-resolution magnification of insets 1 and 2 are presented. Scale bars, 50 μm. (F) Schematic diagram showing the experimental scheme for Lmo2-PyMT tumors treated with tamoxifen to trace metastatic cells. (G) Left Panel: FACS analysis of Lmo2-PyMT tumors at tumor end point from (F). Cells are gated on lineage (CD45, CD31, and Ter119) and DAPI cells (see fig. S3) and analyzed using TdTomato+ and GFP+. Middle and Right Panel: EpCAM and CD49f expression status in GFP+ and TdTomato+ cells. Panel 4: Quantification of TdTomato+ and GFP+ cells from Lmo2-PyMT tumors (n = 4 mice). (H) Panel 1: Representative image of metastasis shown. Scale bar, 100 μm. Panel 2: Quantification of total number and area of GFP+ and TdTomato+ lung metastasis in Lmo2-PyMT tumors. Each dot represents a single metastatic focus (n = 4 mice). Data are shown as means ± SD, and statistical analysis was performed by unpaired, two-sided Wilcoxon rank sum test, *P < 0.05.
Fig. 3.
Fig. 3.. Knockdown of LMO2 reduces lung metastasis in human breast cancer.
(A) Schematic of LMO2 knockdown in MDA-MB-468 cells followed by orthotopic transplant in NSG mice to evaluate tumor burden and metastases. (B) Tumor weight in control (pSicoR) and LMO2 knockdown tumors generated from MDA-MB-468 cell xenografts as shown in (A) (n = 5 mice per group). not significant (n.s.), P > 0.05, ANOVA. (C) Spontaneous GFP+ lung metastases from mice with control and LMO2 knockdown tumors in (B) (n = 5 mice per group). Left: Representative immunofluorescence image. Scale bar, 5 mm. Right: Quantification. **P < 0.01, ANOVA. (D) Number of circulating tumor cells in control and LMO2 knockdown tumors (n = 3 mice in pSicoR, 4 in shLMO2-1, and 5 in shLMO2-2). ****P < 0.0001, ANOVA. (E) Schematic of LMO2 knockdown in patient-derived xenografts (PDXs) followed by orthotopic transplant in NSG mice to evaluate tumor burden and metastases. (F) Number of spontaneous GFP+ lung metastases in control and LMO2 knockdown tumors using PDXs. Data are combined from three independent experiments for PDX1 and PDX3 and from two independent experiment for PDX2 (n = 9 mice per group for PDX1, n = 6 mice per group for PDX2, n = 10mice per group for PDX3). *P < 0.05, **P < 0.01, ***P < 0.001, ****P < 0.0001, ANOVA. (G) MDA-MB-468 cells infected with shRNA targeting 3′UTR of LMO2 or a control shRNA pSicoR were infected with an empty vector control “GFP” or a LMO2 overexpression vector “+LMO2” to generate pSicoR+GFP, pSicoR + LMO2, shLMO2 + GFP, and shLMO2 + LMO2. Transwell migration quantified at 24 hours. (H) Spheroid invasion assay was quantified at day 5 using the breast cancer cells from (G). (I) MDA-MB-468 cells from (G) were cocultured with HUVEC cells, and the percentage of breast cancer cells colocalizing with HUVEC tubes was quantified using ImageJ. For all experiments in (G) to (I), n = 3 and 10 images were analyzed per condition per n. **P < 0.01, ***P < 0.001, ****P < 0.0001, ANOVA (A to I) All data are means ± SD. AU, arbitrary units.
Fig. 4.
Fig. 4.. LMO2 regulates the IL6-JAK-STAT3 pathway and binds to STAT3.
(A) Top: Schematic of bulk RNA-seq analysis in MDA-MB-468 cells infected with shRNAs targeting LMO2 or a control pSicoR. Bottom: Heatmap showing top and bottom 50 genes differentially expressed between control and LMO2 knockdown conditions, ordered by P adjusted value. (B) Left: Hallmark gene sets found to be significantly enriched by GSEA analysis. Normalized enrichment scores (corresponding to control pSicoR versus LMO2 knockdown) and false discovery rate (FDR) Q values are determined by the GSEA software. An FDR Q value cutoff of <0.25 was used to select significant gene sets. Right: Enrichment plots for HALLMARK_TNFα_SIGNALING_VIA_NFκB and HALLMARK_IL6_JAK_STAT3_SIGNALING are depicted. NES, normalized enrichment score. (C) Differential enrichment of the HALLMARK_IL6_JAK_STAT3_SIGNALING pathway in LMO2+ versus LMO2 cells from two independent human breast cancer datasets as described in Fig. 1C. **P < 0.05. (D) Proximity-mediated ligation assay showed that LMO2 had a stronger interaction with STAT3 compared to NF-κB in vitro (n = 3, 10 images were analyzed per condition per n). Statistical analysis was performed by ANOVA with Dunnett’s adjustment. ****P < 0.0001.
Fig. 5.
Fig. 5.. LMO2 stabilizes STAT3 signaling in breast cancer cells.
(A) Left: Proximity-mediated ligation assay between LMO2 and STAT3 in control and LMO2 knockdown cells. Right: Quantification of n = 3 experiments, 10 images per condition per n. Scale bar, 60 μm. ****P < 0.0001, ANOVA. (B) Western blot of the input, immunoprecipitated beads (control), IgG (control), and LMO2 to pull down STAT3. One representative blot (n = 3). (C) Western blot of the input, immunoprecipitated beads (control), IgG (control), and STAT3 to pull down LMO2. One representative blot (n = 3). (D) STAT3-luciferase reporter activity in control and LMO2 knockdown cells treated with IL-6, TNF-α, IFN-α, IFN-γ, and EGF. n = 3. *P < 0.05, ***P < 0.001 and ****P < 0.0001, n.s. P > 0.05, two-way ANOVA. (E) Immunoblotting (left) and quantification (right) of phosphorylated STAT3 in control and LMO2 knockdown cells treated with IL-6 and TNF-α. n = 3. ***P < 0.001, ****P < 0.0001, two-way ANOVA. (F) Proximity ligation assays between STAT3 and JAK2 in control and LMO2 knockdown cells. n = 3. ****P < 0.0001, ANOVA. (G) Proximity ligation assays between STAT3 and PIAS3 in control and LMO2 knockdown cells. n = 3. ****P < 0.0001, ANOVA. (H) Schematic of proposed mechanism of LMO2 in breast cancer metastasis. Cancer cells that express LMO2 have stabilized STAT3 signaling in response to IL-6 and TNF-α from the microenvironment, allowing these cells to intravasate into the circulation by incorporating into the vasculature.

References

    1. Siegel R. L., Miller K. D., Fuchs H. E., Jemal A., Cancer statistics, 2022. CA Cancer J. Clin. 72, 7–33 (2022). - PubMed
    1. Siegel R., Ward E., Brawley O., Jemal A., Cancer statistics, 2011. CA Cancer J. Clin. 61, 212–236 (2011). - PubMed
    1. Esposito M., Ganesan S., Kang Y., Emerging strategies for treating metastasis. Nat. Cancer 2, 258–270 (2021). - PMC - PubMed
    1. Lu W., Kang Y., Epithelial-mesenchymal plasticity in cancer progression and metastasis. Dev. Cell 49, 361–374 (2019). - PMC - PubMed
    1. Padmanaban V., Krol I., Suhail Y., Szczerba B. M., Aceto N., Bader J. S., Ewald A. J., E-cadherin is required for metastasis in multiple models of breast cancer. Nature 573, 439–444 (2019). - PMC - PubMed

Substances