. 2023 Feb 6;13(2):364-385.
doi: 10.1158/2159-8290.CD-22-0199.

Human Bone Marrow Organoids for Disease Modeling, Discovery, and Validation of Therapeutic Targets in Hematologic Malignancies

Affiliations

Human Bone Marrow Organoids for Disease Modeling, Discovery, and Validation of Therapeutic Targets in Hematologic Malignancies

Abdullah O Khan et al. Cancer Discov. .

Abstract

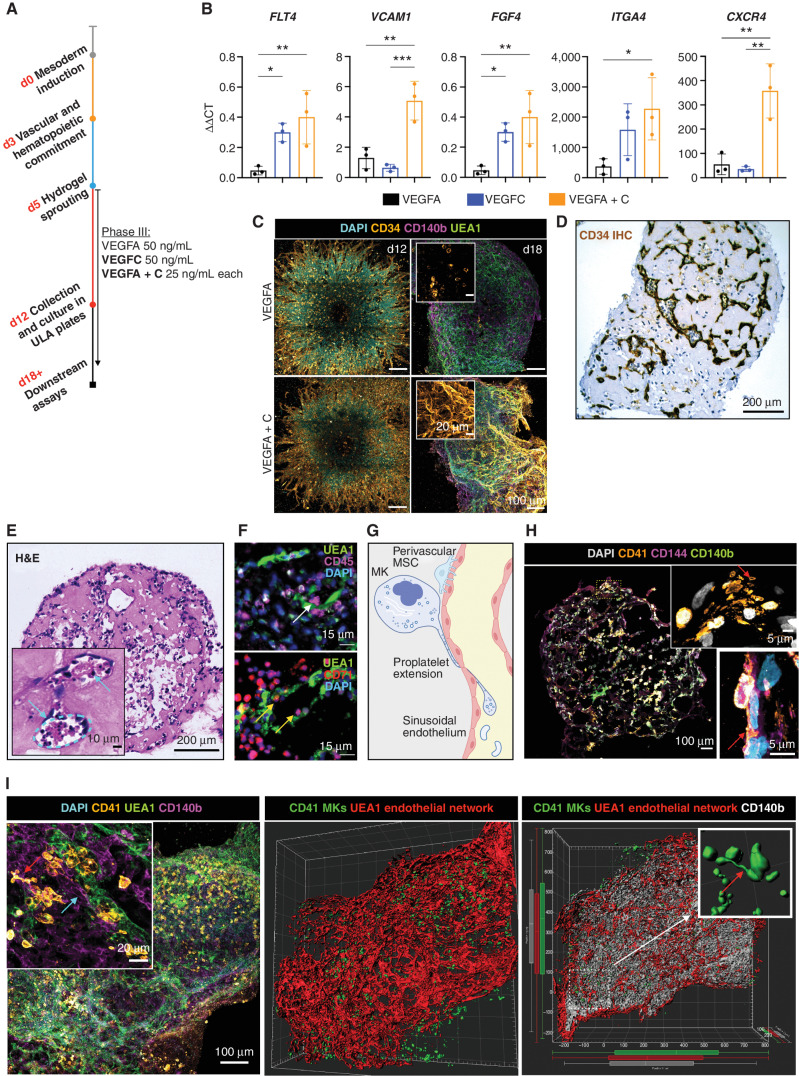
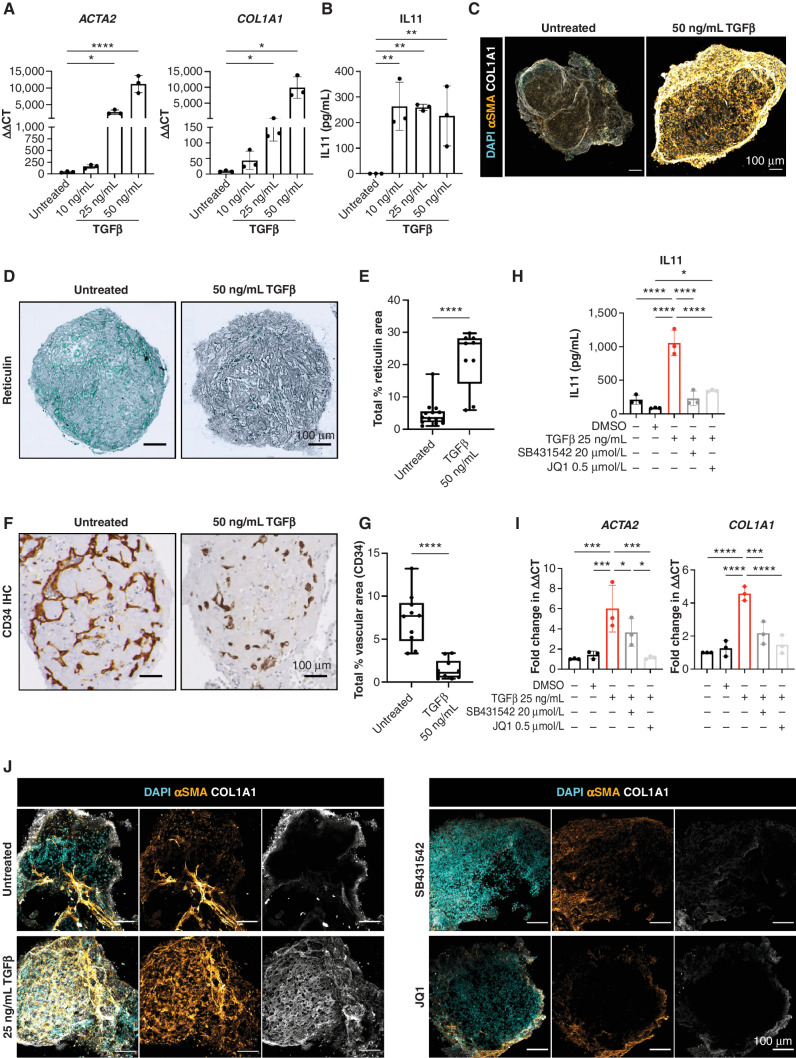
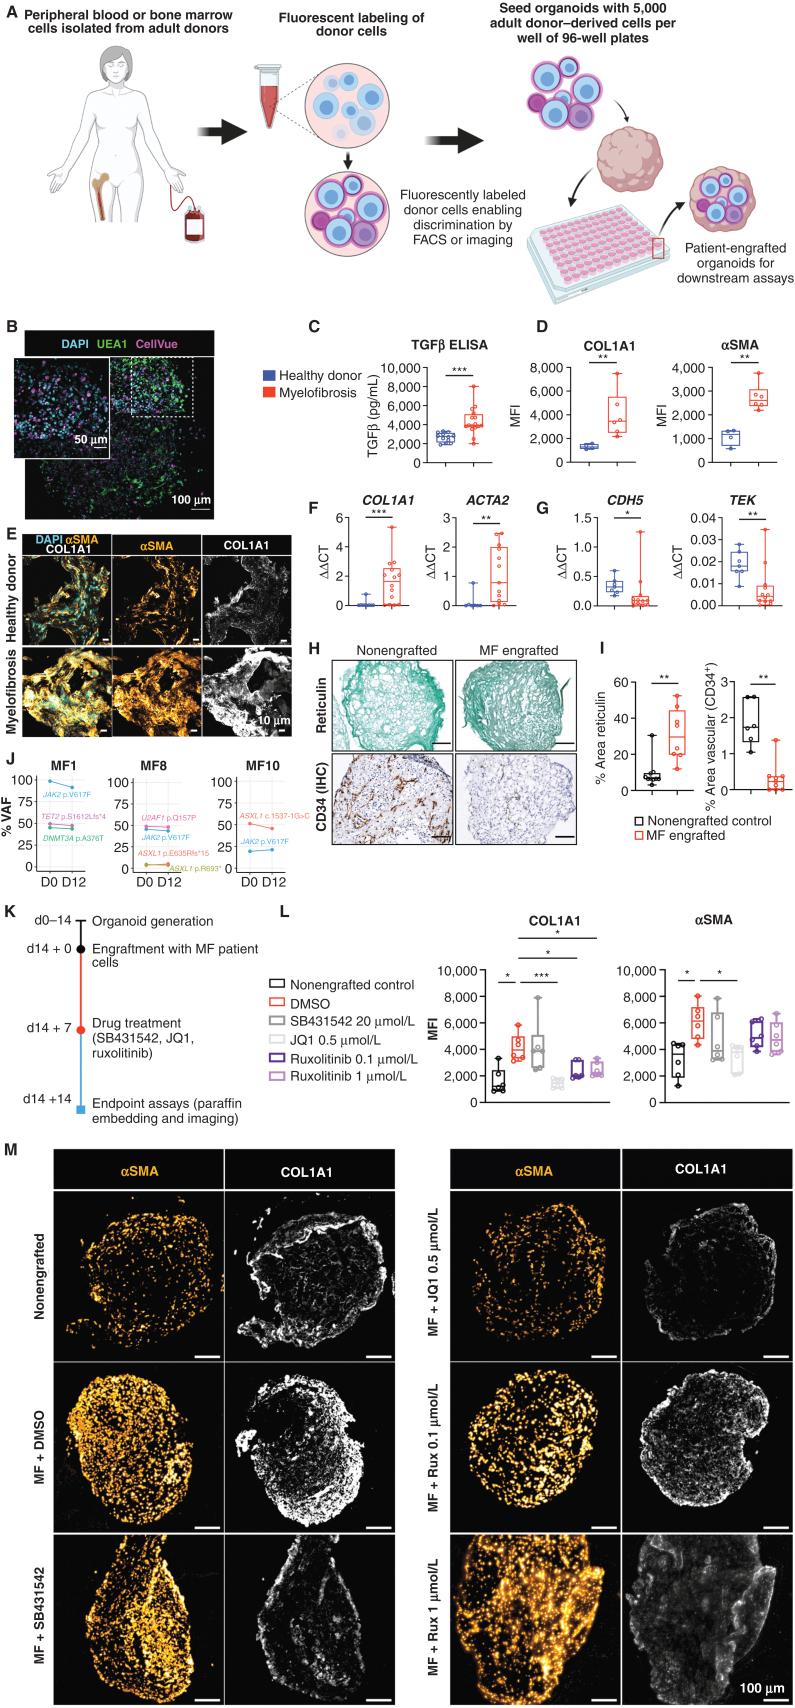
A lack of models that recapitulate the complexity of human bone marrow has hampered mechanistic studies of normal and malignant hematopoiesis and the validation of novel therapies. Here, we describe a step-wise, directed-differentiation protocol in which organoids are generated from induced pluripotent stem cells committed to mesenchymal, endothelial, and hematopoietic lineages. These 3D structures capture key features of human bone marrow-stroma, lumen-forming sinusoids, and myeloid cells including proplatelet-forming megakaryocytes. The organoids supported the engraftment and survival of cells from patients with blood malignancies, including cancer types notoriously difficult to maintain ex vivo. Fibrosis of the organoid occurred following TGFβ stimulation and engraftment with myelofibrosis but not healthy donor-derived cells, validating this platform as a powerful tool for studies of malignant cells and their interactions within a human bone marrow-like milieu. This enabling technology is likely to accelerate the discovery and prioritization of novel targets for bone marrow disorders and blood cancers.

Significance: We present a human bone marrow organoid that supports the growth of primary cells from patients with myeloid and lymphoid blood cancers. This model allows for mechanistic studies of blood cancers in the context of their microenvironment and provides a much-needed ex vivo tool for the prioritization of new therapeutics. See related commentary by Derecka and Crispino, p. 263. This article is highlighted in the In This Issue feature, p. 247.


Figures

Figure 1. Mixed-matrix hydrogels containing Matrigel and type I and IV collagens are optimal for production of vascularized, myelopoietic organoids. A, (i) Central bone marrow is a complex tissue including MSC, endothelial, hematopoietic stem and progenitor cells (HSC/HSPCs), myeloid and lymphoid subsets. (ii) Hematoxylin and eosin–stained section and (iii) model of human bone marrow highlighting the diverse hematopoietic and stromal cell types (created using Biorender.com). B, Differentiation workflow, in which iPSC aggregates undergo mesodermal induction (days 0–3) and commitment to hematopoietic and vascular lineages (days 3–5). Cell aggregates are then embedded in mixed-matrix hydrogels comprised of Matrigel and collagen I, collagen IV, or collagen I + IV mix at a 40:60 ratio to support vascular sprouting. Key media components are listed for each phase. C, Gating strategy and (D) quantification of stromal and hematopoietic cell types in day 18 organoids supported by Matrigel + collagen type I–only, collagen IV–only, and collagen I + IV hydrogels. E, Distribution of lineages as fractions of the whole organoid population. F, Radius of endothelial sprouts and (G) sprouting day 12 organoids immunostained for nuclei (DAPI), CD34, and CD144 (VE-cadherin). H–J, Whole organoid Z-stack imaging acquired at day 18 showing (H) CD34+ HSPCs and UEA1+ vessels that are negative for CD34; I, CD41+ megakaryocytes and (J) CD71+ erythroid cells dispersed throughout the organoids and associating with CD144+/UEA1+ vasculature. *, P < 0.05; **, P < 0.01; ***, P < 0.001, one-way ANOVA with multiple comparisons (Fisher LSD), n = 3 for endothelial sprout radius measurements. Two-way ANOVA with multiple comparisons (Fisher LSD); n = 3 (3 independent differentiations, 15 pooled organoids each) for flow cytometry analysis. Representative images are shown. See also Supplementary Fig. S1.
Figure 1.
Mixed-matrix hydrogels containing Matrigel and type I and IV collagens are optimal for production of vascularized, myelopoietic organoids. A, (i) Central bone marrow is a complex tissue including MSC, endothelial, hematopoietic stem and progenitor cell (HSC/HSPCs), and myeloid and lymphoid subsets. (ii) Hematoxylin and eosin–stained section and (iii) model of human bone marrow highlighting the diverse hematopoietic and stromal cell types (created using BioRender.com). B, Differentiation workflow, in which iPSC aggregates undergo mesodermal induction (days 0–3) and commitment to hematopoietic and vascular lineages (days 3–5). Cell aggregates are then embedded in mixed-matrix hydrogels comprised of Matrigel and collagen I, collagen IV, or collagen I + IV mix at a 40:60 ratio to support vascular sprouting. Key media components are listed for each phase. Gating strategy (C) and quantification (D) of stromal and hematopoietic cell types in day 18 organoids supported by Matrigel + collagen type I–only, collagen IV–only, and collagen I + IV hydrogels. MK, megakaryocyte. E, Distribution of lineages as fractions of the whole organoid population. F, Radius of endothelial sprouts. G, Sprouting day 12 organoids immunostained for nuclei (DAPI), CD34, and CD144 (VE-cadherin). H–J, Whole organoid Z-stack imaging acquired at day 18 showing CD34+ HSPCs and UEA1+ vessels that are negative for CD34 (H), CD41+ megakaryocytes (I), and CD71+ erythroid cells dispersed throughout the organoids and associating with CD144+/UEA1+ vasculature (J). *, P < 0.05; ***, P < 0.001 for one-way ANOVA with multiple comparisons [Fisher least significant difference (LSD)]; n = 3 for endothelial sprout radius measurements. Two-way ANOVA with multiple comparisons (Fisher LSD); n = 3 (3 independent differentiations, 15 pooled organoids each) for flow cytometry analysis. Representative images are shown. See also Supplementary Fig. S1.
Figure 2. The addition of VEGFC induces specialization of organoid vasculature to a bone marrow sinusoid-like phenotype. A, In the sprouting phase of differentiation (D5) in hydrogels, organoids were supplemented with either VEGFA or VEGFC, or both VEGFA and VEGFC. B, mRNA expression of canonical cell-surface receptors, growth factors, and adhesion markers of bone marrow sinusoidal endothelium in VEGFA-, VEGFC-, and VEGFA + C–treated samples. ΔΔCt values relative to housekeeping (GAPDH) and undifferentiated iPSCs shown. Each data point represents 15 organoids, 3 independent differentiations shown. *, P < 0.05; **, P < 0.01; ***, P < 0.001, for one-way ANOVA with multiple comparisons (Fisher LSD). C, CD34+ sprouting vessels at day 12 in both VEGFA and VEGFA + C conditions. At day 18, vessels were CD34 positive in VEGFA + C organoids but negative in VEGFA-only organoids. D, IHC staining for CD34 and (E) hematoxylin and eosin (H&E) staining of formalin-fixed, paraffin-embedded VEGFA + C organoid sections, with inset showing lumen-forming vessels containing hematopoietic cells (blue arrows). F, Immunofluorescence staining of paraffin-embedded sections of VEGFA + C organoids showing CD45+ hematopoietic (white arrow) and CD71+ erythroid cells (yellow arrows) migrating into the UAE1+ vessel lumen. G, Schematic demonstrating the process of proplatelet formation by megakaryocytes (image created by Biorender.com). H, Whole organoid image showing CD140b+ MSCs surrounding CD144+ vessels, with CD41+ megakaryocytes. Insets show megakaryocytes extending proplatelet protrusions into vessel lumen (red arrows). Top inset shows CD41+ platelet-like particles within vessel lumen. I, Confocal imaging and 3D render of whole-mount VEGFA + C organoids showing CD41+ megakaryocytes (red arrow) closely associating with UEA1+ vessel network that is invested with CD140b+ fibroblast/MSCs (blue arrow; left and center image). Inset (right) shows 3D rendered megakaryocytes displaying proplatelet formation (red arrow).
Figure 2.
The addition of VEGFC induces specialization of organoid vasculature to a bone marrow sinusoid-like phenotype. A, In the sprouting phase of differentiation (D5) in hydrogels, organoids were supplemented with either VEGFA or VEGFC, or both VEGFA and VEGFC. B, mRNA expression of canonical cell-surface receptors, growth factors, and adhesion markers of bone marrow sinusoidal endothelium in VEGFA-, VEGFC-, and VEGFA + C–treated samples. ΔΔCt values relative to housekeeping (GAPDH) and undifferentiated iPSCs shown. Each datapoint represents 15 organoids; 3 independent differentiations shown. *, P < 0.05; **, P < 0.01; ***, P < 0.001 for one-way ANOVA with multiple comparisons (Fisher least significant difference). C, CD34+ sprouting vessels at day 12 in both VEGFA and VEGFA + C conditions. At day 18, vessels were CD34 positive in VEGFA + C organoids but negative in VEGFA-only organoids. D and E, IHC staining for CD34 (D) and hematoxylin and eosin (H&E) staining of formalin-fixed, paraffin-embedded VEGFA + C organoid sections (E), with inset showing lumen-forming vessels containing hematopoietic cells (blue arrows). F, Immunofluorescence staining of paraffin-embedded sections of VEGFA + C organoids showing CD45+ hematopoietic (white arrow) and CD71+ erythroid cells (yellow arrows) migrating into the UAE1+ vessel lumen. G, Schematic demonstrating the process of proplatelet formation by megakaryocytes (MK; image created using BioRender.com). H, Whole organoid image showing CD140b+ MSCs surrounding CD144+ vessels with CD41+ megakaryocytes. Insets show megakaryocytes extending proplatelet protrusions into vessel lumen (red arrows). Top inset shows CD41+ platelet-like particles within vessel lumen. I, Confocal imaging and 3D render of whole-mount VEGFA + C organoids showing CD41+ megakaryocytes (red arrow) closely associating with the UEA1+ vessel network that is invested with CD140b+ fibroblast/MSCs (blue arrow; left and center image). Inset (right) shows 3D rendered megakaryocytes displaying proplatelet formation (red arrow).
Figure 3. scRNA-seq confirmed that hematopoietic and stromal cell lineages within organoids showed transcriptional similarity to human hematopoietic tissues. A, Uniform manifold approximation and projection (UMAP) plot showing annotated cell clusters. B, Gene set enrichment analysis of differentially expressed genes for each cluster using a curated set of 64 hematopoietic lineage gene sets. DC, dendritic cell; GMP, granulocyte-macrophage progenitor; HSC, hematopoietic stem cell; KEGG, Kyoto Encyclopedia of Genes and Genomes; LMPP, lymphoid-primed multipotent progenitor; MEMP, megakaryocyte-erythroid-mast cell progenitor; MK, megakaryocyte; MkE, megakaryocyte-erythroid; MPP, multipotent progenitor; NK, natural killer cell; pDC, plasmacytoid DC; prog., progenitor; VCAM EI, VCAM erythroblastic island; WP, WikiPathways. C, Expression of canonical stromal and hematopoietic cell genes for each of the annotated clusters. The color scale represents the average level of expression, and the circle size shows the percentage of cells within each cluster in which expression was detected for each gene. D and E, FDG showing differentiation trajectories for hematopoietic (D) and stromal (E) compartments, superimposed with expression scores of lineage signature gene sets. F, Organoid cells projected onto a published dataset of human hematopoietic and stromal cells using the Symphony package (33). Mono-Mac, monocyte-macrophage. See also Supplementary Figs. 2 and 3 and Supplementary Tables S1 and S2.
Figure 3.
scRNA-seq confirmed that hematopoietic and stromal cell lineages within organoids showed transcriptional similarity to human hematopoietic tissues. A, Uniform manifold approximation and projection (UMAP) plot showing annotated cell clusters. B, Gene set enrichment analysis of differentially expressed genes for each cluster using a curated set of 64 hematopoietic lineage gene sets. DC, dendritic cell; GMP, granulocyte-macrophage progenitor; HSC, hematopoietic stem cell; KEGG, Kyoto Encyclopedia of Genes and Genomes; LMPP, lymphoid-primed multipotent progenitor; MEMP, megakaryocyte-erythroid-mast cell progenitor; MK, megakaryocyte; MkE, megakaryocyte-erythroid; MPP, multipotent progenitor; NK, natural killer cell; pDC, plasmacytoid DC; prog., progenitor; VCAM EI, VCAM erythroblastic island; WP, WikiPathways. C, Expression of canonical stromal and hematopoietic cell genes for each of the annotated clusters. The color scale represents the average level of expression, and the circle size shows the percentage of cells within each cluster in which expression was detected for each gene. D and E, FDG showing differentiation trajectories for hematopoietic (D) and stromal (E) compartments, superimposed with expression scores of lineage signature gene sets. F, Organoid cells projected onto a published dataset of human hematopoietic and stromal cells using the Symphony package (33). Mono-Mac, monocyte-macrophage. See also Supplementary Figs. 2 and 3 and Supplementary Tables S1 and S2.
Figure 4. Endothelial, fibroblasts, and MSCs from organoid stroma support hematopoiesis, with increased hematopoietic support from VEGFA + C–stimulated vasculature. A, Comparison of expression of key receptors, adhesion proteins, growth factors and chemokines in endothelial cells from bone marrow organoids (Org) and human fetal bone marrow (FBM). B, Comparison of expression of growth factors and chemokines in MSCs from organoids and FBM. Size of dots represents % of expressing cells and color density indicates level of expression. C, Total predicted ligand–receptor interactions across clusters as predicted by CellPhoneDB (V2.0) showing extensive autocrine and paracrine interactions across BM organoid. D, Volcano plot showing significantly differentially expressed (DE) genes in endothelial cells (ECs) from VEGFA + C vs. VEGFA-only organoids (801 significantly upregulated and 700 significantly downregulated genes, P < 0.05, log2FC > 0.5 or −0.5). E, Violin plots showing key hematopoietic support factors and markers of bone marrow sinusoidal endothelium in ECs of VEGFA + C and VEGFA-only organoids. P values are indicated below x-axis labels, and mean value is indicated on violin plots. ***, P < 0.001; ****, P < 0.0001 for pairwise comparison Wilcox test applied [FDR]). F–H, Sankey plots comparing (F) TGFβ1, (G) CXCL12, and (H) CD44-mediated interactions in VEGFA + C vs. VEGFA-stimulated organoids. I, Expression of interacting receptor–ligand pairs between organoid HSPCs and cognate partner in organoid or FBM ECs (endo) and MSC/fibroblasts, with percentage of expressing cells and level of expression shown. J, Hematopoietic cytokines/growth factors produced by bone marrow organoids, measured by Luminex assay. Each data point represents supernatant pooled from 16 separately generated organoids. See also Supplementary Figs. 4–7.
Figure 4.
Endothelial cells (EC), fibroblasts, and MSCs from organoid stroma support hematopoiesis with increased hematopoietic support from VEGFA + C–stimulated vasculature. A, Comparison of expression of key receptors, adhesion proteins, and growth factors and chemokines in ECs from bone marrow organoids (Org.) and human fetal bone marrow (FBM). B, Comparison of expression of growth factors and chemokines in MSCs from organoids and FBM. Size of dots represents percentage of expressing cells, and color density indicates level of expression. C, Total predicted ligand–receptor interactions across clusters as predicted by CellPhoneDB (V2.0), showing extensive autocrine and paracrine interactions across BM organoid. MK, megakaryocyte; prog., progenitor. D, Volcano plot showing significantly differentially expressed (DE) genes in ECs from VEGFA + C versus VEGFA-only organoids (801 significantly upregulated and 700 significantly downregulated genes, P < 0.05, log2FC > 0.5 or −0.5). E, Violin plots showing key hematopoietic support factors and markers of bone marrow sinusoidal endothelium in ECs of VEGFA + C and VEGFA-only organoids. P values are indicated below x-axis labels, and mean value is indicated on violin plots. ***, P < 0.001; ****, P < 0.0001 for pairwise comparison Wilcox test applied (FDR). UMI, unique molecular identifier. F–H, Sankey plots comparing TGFβ1-mediated (F), CXCL12-mediated (G), and CD44-mediated (H) interactions in VEGFA + C versus VEGFA-stimulated organoids. Endo, endothelial; Ery, erythroid; Fibro, fibroblast; Mono, monocyte. I, Expression of interacting receptor–ligand pairs between organoid HSPCs and cognate partner in organoid or FBM ECs (endo) and MSCs/fibroblasts with percentage of expressing cells and level of expression shown. J, Hematopoietic cytokines/growth factors produced by bone marrow organoids, measured by Luminex assay. Each datapoint represents supernatant pooled from 16 separately generated organoids. See also Supplementary Figs. 4–7.
Figure 5. Bone marrow organoids model TGFβ-induced bone marrow fibrosis and enable inhibitor screening. A, Organoids were treated with 10, 25, or 50 ng/mL recombinant TGFβ and evaluated by qRT-PCR for expression of ACTA2 (αSMA) and COL1A1, indicators of fibrosis. B, Soluble IL11 detected in organoid media following treatment of organoids with TGFβ. C, Confocal Z-stack images of whole, untreated, and TGFβ (50 ng/mL)-treated organoids stained for αSMA and COL1A1. D, Reticulin staining of formalin-fixed, paraffin-embedded sections of TGFβ-treated organoids vs. control. E, Measurement of total reticulin stained area in untreated and TGFβ (50 ng/mL)-treated organoids. F, CD34 immunostaining of organoid vessels and (G) quantification of total vascular area of organoids with/without TGFβ treatment. H, Effect of two potential inhibitors of TGFβ-induced fibrosis (SB431542 and JQ1) on IL11 secretion and (I) ACTA2 and COL1A1 expression. J, αSMA and COL1A1 expression in TGFβ-treated organoids with/without indicated inhibitors. Representative images are shown. *, P < 0.01; **, P < 0.05; ***, P < 0.001; ****, P < 0.0001 for one-way ANOVA with multiple comparisons (Fisher LSD). T tests performed for image analysis of paraffin-embedded sections (reticulin and CD34). N = 3 with each repeat comprising 15 organoids pooled from 3 independent differentiations and treatments.
Figure 5.
Bone marrow organoids model TGFβ-induced bone marrow fibrosis and enable inhibitor screening. A, Organoids were treated with 10, 25, or 50 ng/mL recombinant TGFβ and evaluated by qRT-PCR for expression of ACTA2 (αSMA) and COL1A1, indicators of fibrosis. B, Soluble IL11 detected in organoid media following treatment of organoids with TGFβ. C, Confocal Z-stack images of whole, untreated, and TGFβ (50 ng/mL)-treated organoids stained for αSMA and COL1A1. D, Reticulin staining of formalin-fixed, paraffin-embedded sections of TGFβ-treated organoids versus control. E, Measurement of total reticulin stained area in untreated and TGFβ (50 ng/mL)-treated organoids. F and G, CD34 immunostaining of organoid vessels (F) and quantification of total vascular area of organoids with/without TGFβ treatment (G). H and I, Effect of two potential inhibitors of TGFβ-induced fibrosis (SB431542 and JQ1) on IL11 secretion (H) and ACTA2 and COL1A1 expression (I). J, αSMA and COL1A1 expression in TGFβ-treated organoids with/without indicated inhibitors. Representative images are shown. *, P < 0.01; **, P < 0.05; ***, P < 0.001; ****, P < 0.0001 for one-way ANOVA with multiple comparisons (Fisher least significant difference). T tests performed for image analysis of paraffin-embedded sections (reticulin and CD34). n = 3 with each repeat comprising 15 organoids pooled from 3 independent differentiations and treatments.
Figure 6. Engraftment of cells from patients with myelofibrosis, but not healthy donors, results in organoid “niche remodeling” and fibrosis. A, Cryopreserved peripheral blood or bone marrow cells from healthy donors and patients with blood cancers were fluorescently labeled, and 5,000 donor cells were seeded into each well of a 96-well plate containing individual organoids. B, Maximum-intensity projection of confocal Z-stack of a whole engrafted organoid 72 hours after seeding of the wells with donor cells, indicating donor cells engrafted throughout the volume of the organoids. C, Soluble TGFβ in organoids engrafted by cells from myelofibrosis patients and controls. D–G, Comparison of organoids engrafted with healthy donor and myelofibrosis cells for (D) collagen 1 (COL1A1) and αSMA immunofluorescence and (E) representative images; F, Col1A1 and ACTA2 gene expression; G, CDH5 and TIE2 expression. (*, P < 0.01; **, P < 0.05; ***, P < 0.001 for Mann–Whitney test, n = 4 healthy donors; n = 7 MF samples for qRT-PCR, n = 4 healthy donors; n = 6 MF samples for imaging and quantification of cryosections). H and I, Increased reticulin deposition with a concomitant reduction in vascular area in organoids engrafted with myelofibrosis cells vs. nonengrafted control organoids with paired t tests; each data point corresponds to a single organoid engrafted with cells from 3 donors. J, Variant allele frequencies of mutations detected by NGS of cells from myelofibrosis patients before seeding in organoids (day 0) compared with cells isolated by flow cytometry 12 days after culture in organoids, indicating maintenance of clonal architecture. K, Workflow for organoid generation, engraftment with cells from myelofibrosis (MF) patients, and treatment with inhibitors. L, αSMA and collagen 1 expression in nonengrafted organoids, and organoids engrafted with myelofibrosis cells treated with DMSO (control), SB431542, JQ1, and ruxolitinib. Each data point corresponds to total measurements per organoid within a block (n = 3 donors). One-way ANOVA with multiple comparisons (Fisher LSD). M, Representative images from (L). Schematic in A created on Biorender.com. *, P < 0.01; **, P < 0.05; ***, P < 0.001. See also Supplementary Fig. S8.
Figure 6.
Engraftment of cells from patients with myelofibrosis, but not healthy donors, results in organoid “niche remodeling” and fibrosis. A, Cryopreserved peripheral blood or bone marrow cells from healthy donors and patients with blood cancers were fluorescently labeled, and 5,000 donor cells were seeded into each well of a 96-well plate containing individual organoids. Schematic created using BioRender.com. B, Maximum-intensity projection of confocal Z-stack of a whole engrafted organoid 72 hours after seeding of the wells with donor cells, indicating donor cells engrafted throughout the volume of the organoids. C, Soluble TGFβ in organoids engrafted by cells from patients with myelofibrosis and controls. D–G, Comparison of organoids engrafted with healthy donor and myelofibrosis cells for collagen 1 (COL1A1) and αSMA immunofluorescence (D) and representative images (E), Col1A1 and ACTA2 gene expression (F), and CDH5 and TIE2 expression (G).n = 4 healthy donors; n = 7 myelofibrosis samples for qRT-PCR; n = 4 healthy donors; n = 6 myelofibrosis samples for imaging and quantification of cryosections. MFI, mean fluorescence intensity. H and I, Increased reticulin deposition with a concomitant reduction in vascular area in organoids engrafted with myelofibrosis (MF) cells versus nonengrafted control organoids with paired t tests; each datapoint corresponds to a single organoid engrafted with cells from 3 donors. J, Variant allele frequencies (VAF) of mutations detected by next-generation sequencing of cells from patients with myelofibrosisbefore seeding in organoids (day 0) compared with cells isolated by flow cytometry 12 days after culture in organoids, indicating maintenance of clonal architecture. K, Workflow for organoid generation, engraftment with cells from patients with myelofibrosis, and treatment with inhibitors. L, αSMA and collagen 1 expression in nonengrafted organoids, and organoids engrafted with myelofibrosis cells treated with DMSO (control), SB431542, JQ1, and ruxolitinib. Each data point corresponds to total measurements per organoid within a block (n = 3 donors). One-way ANOVA with multiple comparisons (Fisher least significant difference). M, Representative images from L. Rux, ruxolitinib. *, P < 0.01; **, P < 0.05; ***, P < 0.001 for Mann–Whitney test. See also Supplementary Fig. S8.
Figure 7. Bone marrow organoids support the engraftment, survival, and proliferation of cells from patients with myeloid and lymphoid hematologic malignancies. A, Organoids engrafted with CellVue-labeled model infant ALL cells from xenografts (Xeno iALL), primary cells from a patient with untreated chronic myeloid leukemia (CML) and THP-1 cells, an acute myeloid leukemia cell line. CellVue+ cells are visible throughout the volume of organoids. B, Organoids seeded with CD138+ cells isolated from bone marrow aspirates of patients with multiple myeloma show CellVue+ CD38+ plasma cell engraftment. C–E, Viability and proliferation of cells from 4 donors with multiple myeloma, 6 donors with acute lymphoblastic leukemia (ALL) and 3 Xeno iALL samples seeded simultaneously in the organoids, a 3D coculture with primary human BM-MSC (3D BM-MSC), and where possible, liquid culture. E, Serial dilution of CellTrace label, indicating cell proliferation, for multiple myeloma, Xeno iALL, and ALL cells in 3D BM-MSC and organoids on days 2, 5, 7, and 12 following thawing and plating. F, Engrafted multiple myeloma cells retained their immunophenotype at day 12, with more consistent maintenance of CD319 and CD38 in organoids than 3D BM-MSC. Representative images are shown. *, P < 0.01; **, P < 0.05; ***, P < 0.001. n = 4 for multiple myeloma, n = 3 for Xeno iALL and n = 3 for ALL, with each repeat comprised of a separate donor two-way ANOVA with repeated-measures and multiple comparisons (organoid cultures vs. 3D BM-MSC; Fisher LSD) for ALL and multiple myeloma, multiple un-paired t test for Xeno iALL data.
Figure 7.
Bone marrow organoids support the engraftment, survival, and proliferation of cells from patients with myeloid and lymphoid hematologic malignancies. A, Organoids engrafted with CellVue-labeled model infant ALL cells from xenografts (Xeno iALL), primary cells from a patient with untreated CML, and THP-1 cells, an acute myeloid leukemia cell line. CellVue+ cells are visible throughout the volume of organoids. B, Organoids seeded with CD138+ cells isolated from bone marrow aspirates of patients with multiple myeloma show CellVue+ CD38+ plasma cell engraftment. C–E, Viability and proliferation of cells from 4 donors with multiple myeloma, 6 donors with ALL, and 3 Xeno iALL samples seeded simultaneously in the organoids, a 3D coculture with primary human BM-MSC (3D BM-MSC), and where possible, liquid culture. E, Serial dilution of CellTrace label, indicating cell proliferation, for multiple myeloma, Xeno iALL, and ALL cells in 3D BM-MSC and organoids on days 2, 5, 7, and 12 following thawing and plating. F, Engrafted multiple myeloma cells retained their immunophenotype at day 12 with more consistent maintenance of CD319 and CD38 in organoids than 3D BM-MSC. Representative images are shown. *, P < 0.01; ***, P < 0.001; ns, not significant. n = 4 for multiple myeloma, n = 3 for Xeno iALL, and n = 3 for ALL, with each repeat comprised of a separate donor two-way ANOVA with repeated measures and multiple comparisons (organoid cultures vs. 3D BM-MSC; Fisher least significant difference) for ALL and multiple myeloma and multiple unpaired t test for Xeno iALL data. BM, bone marrow; FSC, forward scatter.

Comment in

References

    1. Baryawno N, Przybylski D, Kowalczyk MS, Kfoury Y, Severe N, Gustafsson K, et al. . A cellular taxonomy of the bone marrow stroma in homeostasis and leukemia. Cell 2019;177:1915–32. - PMC - PubMed
    1. Méndez-Ferrer S, Bonnet D, Steensma DP, Hasserjian RP, Ghobrial IM, Gribben JG, et al. . Bone marrow niches in haematological malignancies. Nat Rev Cancer 2020;20:285–98. - PMC - PubMed
    1. Tikhonova AN, Dolgalev I, Hu H, Sivaraj KK, Hoxha E, Cuesta-Domínguez Á, et al. . The bone marrow microenvironment at single-cell resolution. Nature 2019;569:222–8. - PMC - PubMed
    1. Leimkühler NB, Gleitz HFE, Ronghui L, Snoeren IAM, Fuchs SNR, Nagai JS, et al. . Heterogeneous bone-marrow stromal progenitors drive myelofibrosis via a druggable alarmin axis. Cell Stem Cell 2021;28:637–52. - PMC - PubMed
    1. Celik H, Krug E, Zhang CR, Han W, Issa N, Koh WK, et al. . A humanized animal model predicts clonal evolution and therapeutic vulnerabilities in myeloproliferative neoplasms. Cancer Discov 2021;11:3126–41. - PMC - PubMed

Publication types