. 2022 Nov 8;41(6):111613.
doi: 10.1016/j.celrep.2022.111613.

The memory B cell response to influenza vaccination is impaired in older persons

Affiliations

The memory B cell response to influenza vaccination is impaired in older persons

Alice R Burton et al. Cell Rep. .

Erratum in

Abstract

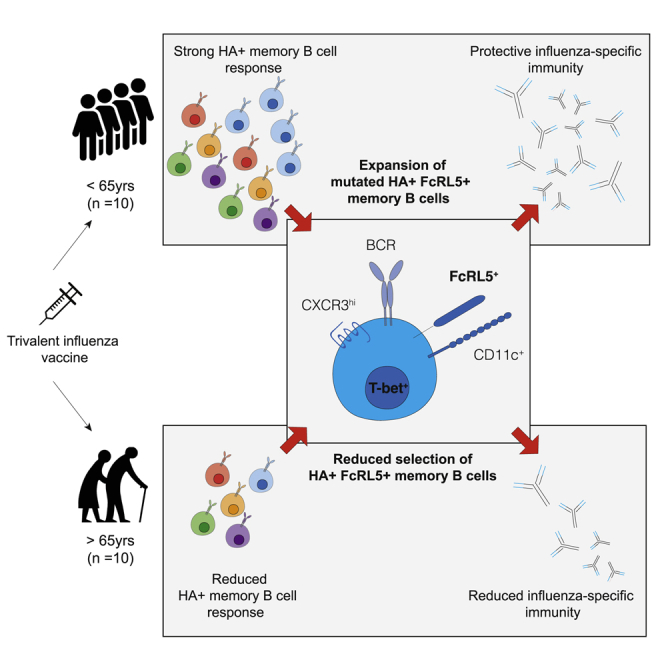
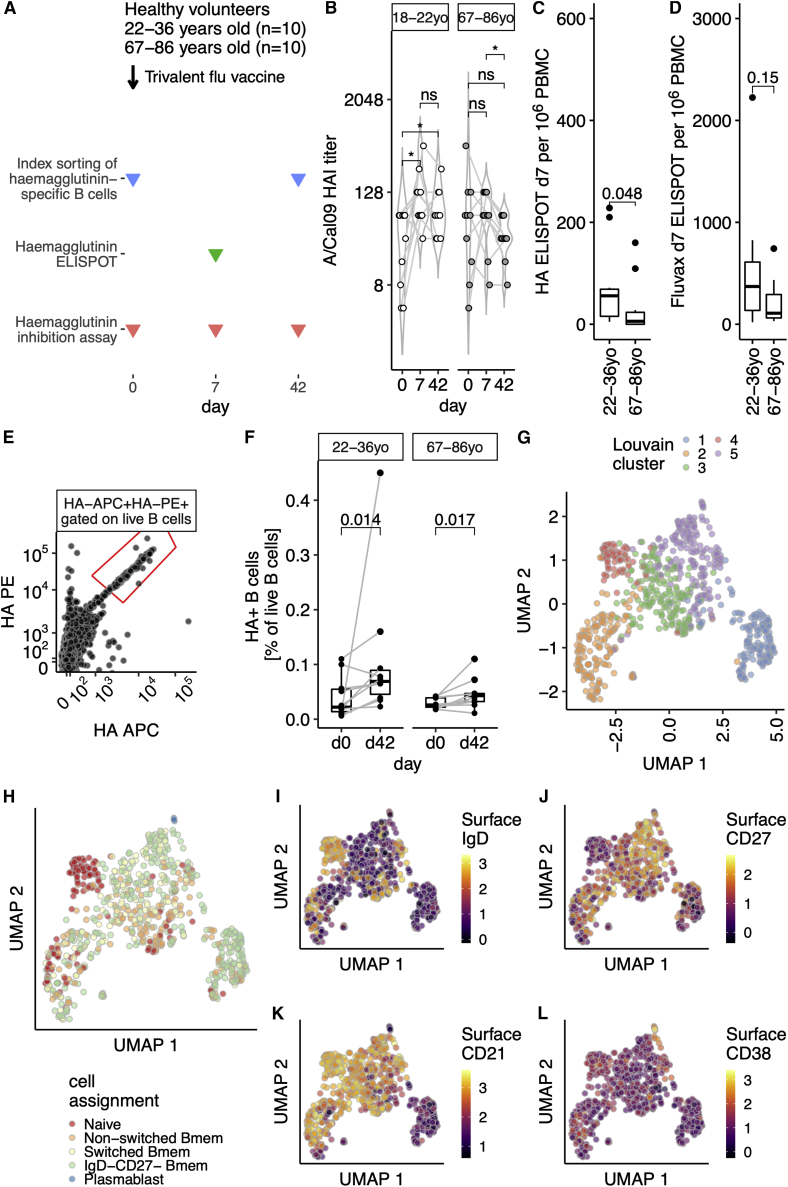
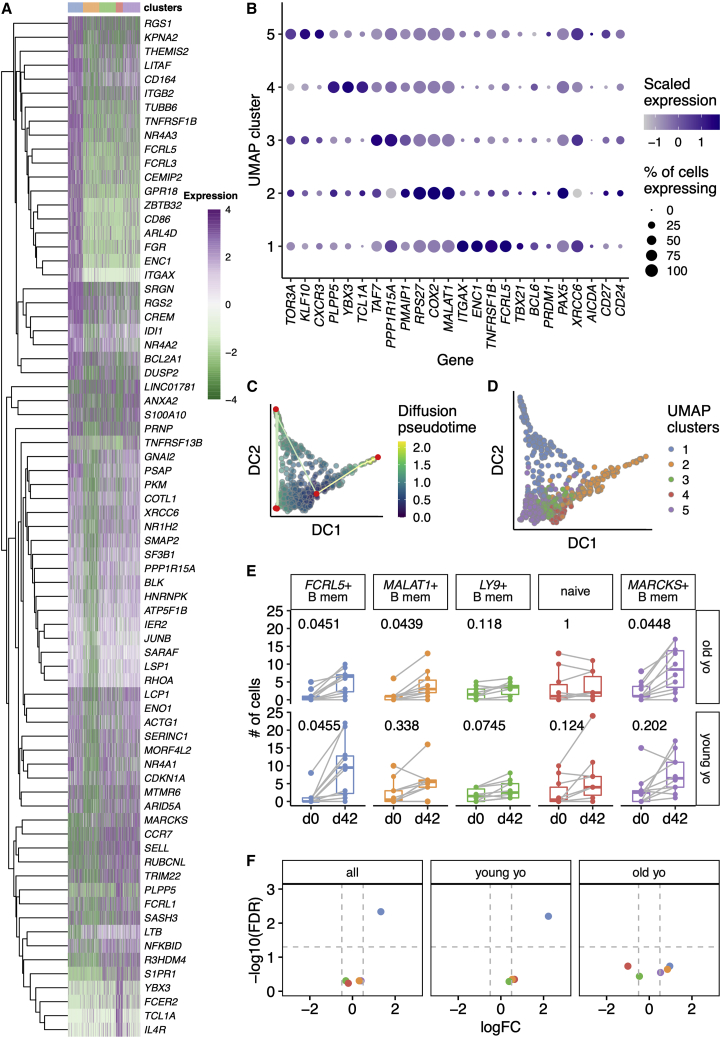
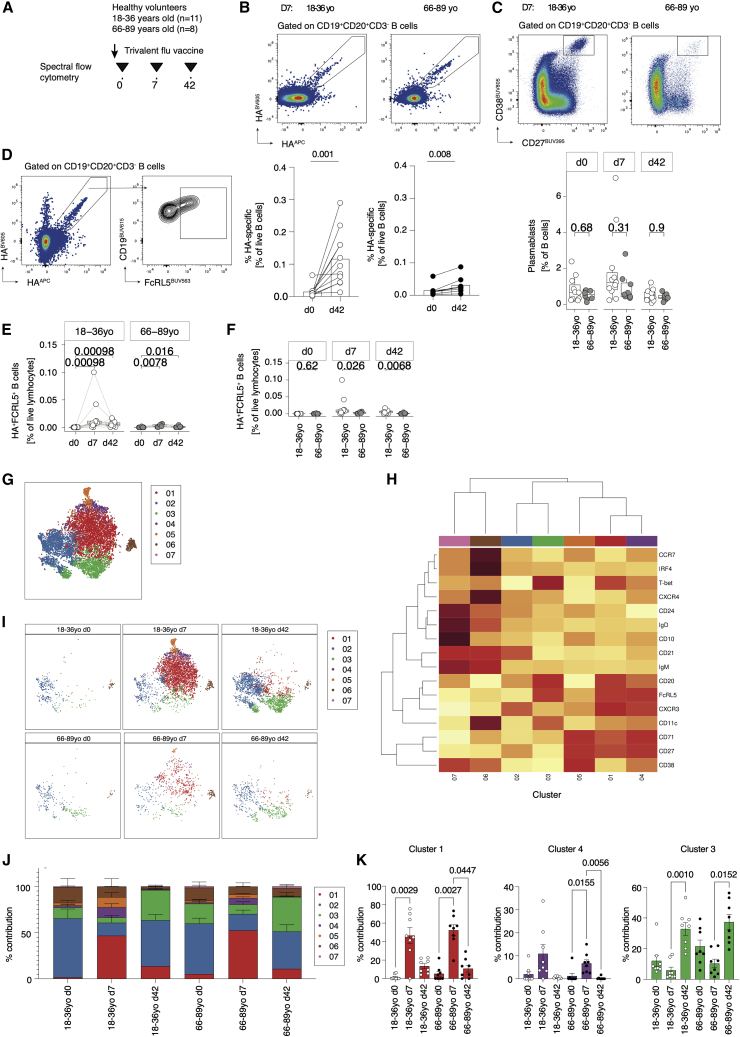
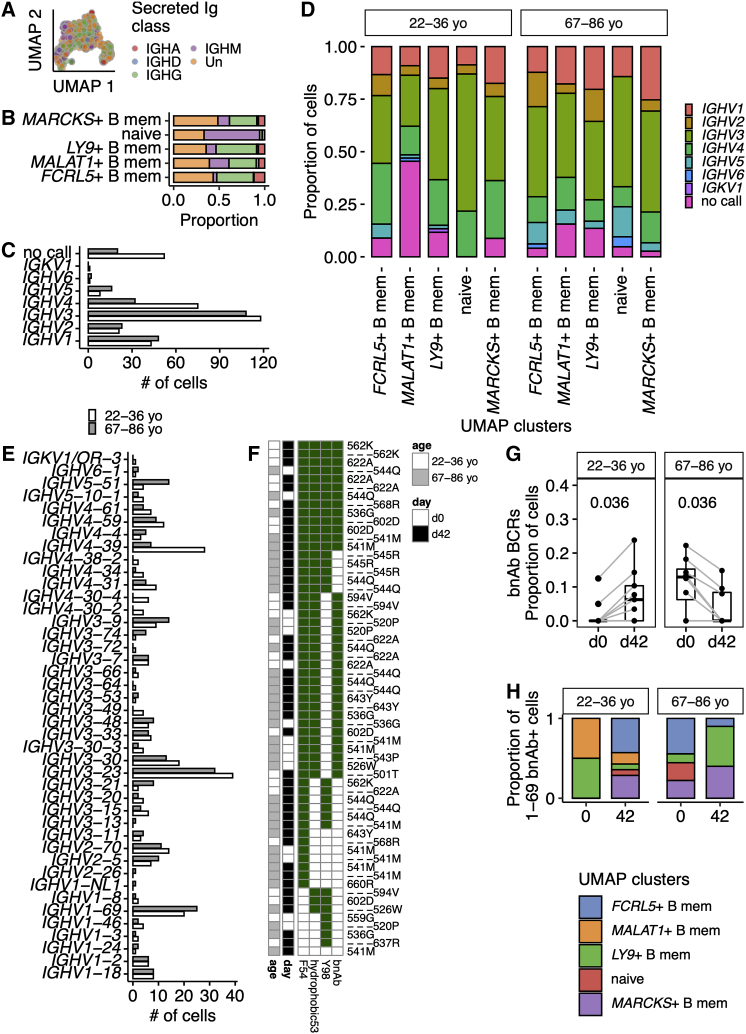
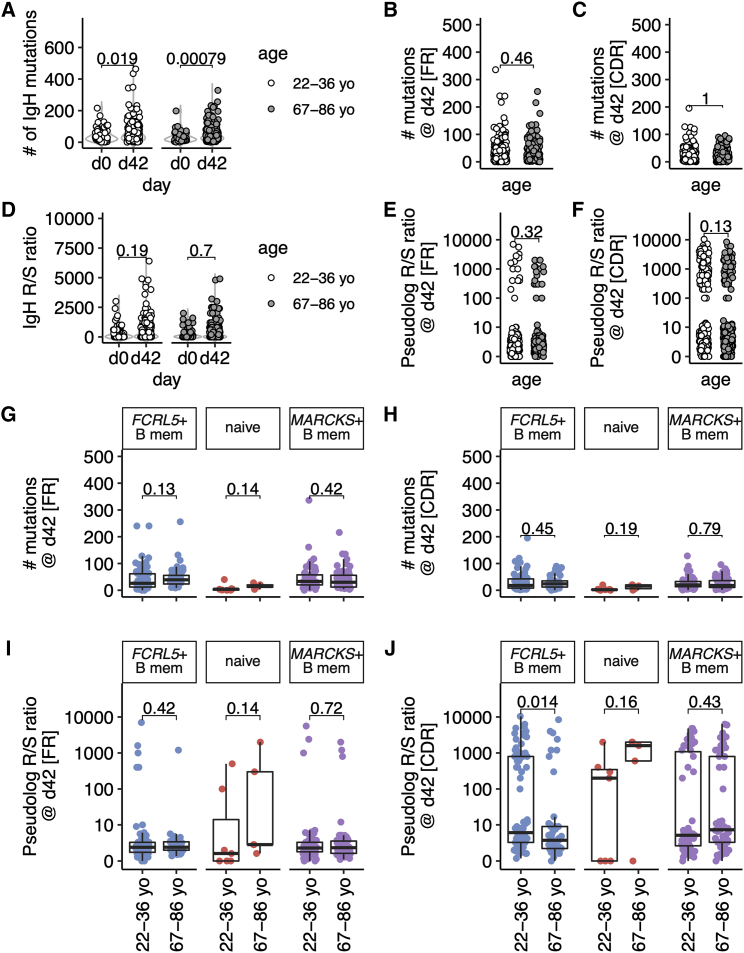
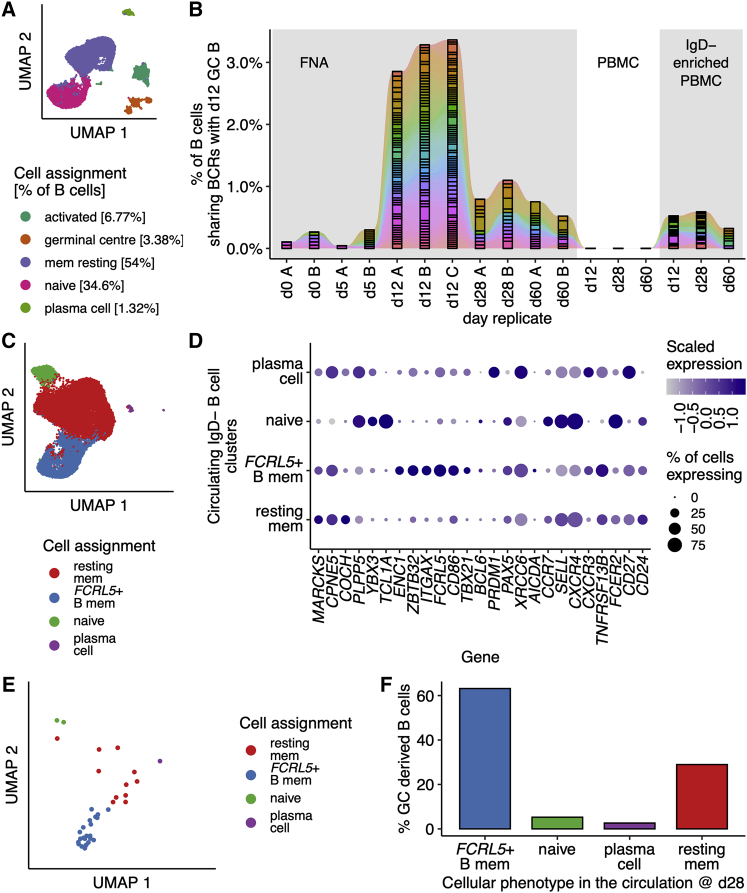
Influenza infection imparts an age-related increase in mortality and morbidity. The most effective countermeasure is vaccination; however, vaccines offer modest protection in older adults. To investigate how aging impacts the memory B cell response, we track hemagglutinin-specific B cells by indexed flow sorting and single-cell RNA sequencing (scRNA-seq) in 20 healthy adults that were administered the trivalent influenza vaccine. We demonstrate age-related skewing in the memory B cell compartment 6 weeks after vaccination, with younger adults developing hemagglutinin-specific memory B cells with an FcRL5+ "atypical" phenotype, showing evidence of somatic hypermutation and positive selection, which happened to a lesser extent in older persons. We use publicly available scRNA-seq from paired human lymph node and blood samples to corroborate that FcRL5+ atypical memory B cells can derive from germinal center (GC) precursors. Together, this study shows that the aged human GC reaction and memory B cell response following vaccination is defective.

Keywords: B cell; CP: Immunology; aging; antibody selection; influenza; memory; vaccination.


Conflict of interest statement

Declaration of interests The authors declare no competing interests.

Figures

None
Graphical abstract
Figure 1
Figure 1
Single-cell sequencing of hemagglutinin-specific B cells to study the aged vaccine response (A) Study design. Venepuncture performed on days 0 (just prior to 2016–2017 trivalent influenza vaccine immunization), 7, and 42. Peripheral blood mononuclear cells were isolated on the day of venepuncture and cryopreserved for later index sorting experiments. (B) Hemagglutinin inhibition (HAI) assay titers from days 0, 7, and 42 are shown for 22- to 36-year-old or 67- to 86-year-old volunteers as open or grayed circles, respectively (n = 10 in both groups). Data are from one technical replicate (of two independent experiments). (C and D) PBMC ELISpot at day 7 in both age groups for antibody-secreting cells after stimulation with HA (C) or TIV (D). Data are from eight experimental runs on separate days. (E) Recombinant biotinylated hemagglutinin multimers conjugated with streptavidin-PE or streptavidin-APC allows the identification of hemagglutinin-specific B cells. Gated on live, singlet CD19+ lymphocytes. Full gating strategy is shown in Figure S1B. (F) The proportion of hemagglutinin-binding B cells increases after vaccination, for both 22- to 36-year-olds or 67- to 86-year-olds. Proportion expressed as percentage of live B cells that did not bind free streptavidin. Data are from ten experimental runs on separate days. (G) UMAP embedding of single-cell RNA sequencing from A/Cal09-specific B cells, n = 771 cells. UMAP projection based on the first 40 principal components using the features with the top 10% variance, after removal of low-quality cells (Figure S1) and size normalization by deconvolution. Louvain clustering finds five clusters. Sorts were performed on 10 days with all four conditions present. Ten library preparations were performed and sequenced as ten lanes. (H) Cell-identity assignment based on published transcriptional profiles of 29 human immune subsets including the following B cell subsets: IgD+CD27 “naive,” IgD+CD27+ “non-switched Bmem,” IgDCD27+ “switched Bmem,” IgDCD27 “IgDCD27,” IgDCD27+CD38+ plasmablasts “PB,” and plasmacytoid DCs. The following numbers of cells were identified: naïve, 120 cells; non-switched Bmem, 165 cells; switched Bmem, 144 cells; IgDCD27 Bmem, 334 cells; plasmablast, 3 cells; plasmacytoid DCs, 1 cell. No cells were defined as T cells or members of other lymphoid or myeloid lineages. (I–L) UMAP embedding as in (G), showing the logicle transformed index sort surface expression of IgD (I), CD27 (J), CD21 (K), and CD38 (L) proteins. In (B), p values from paired two-tailed Wilcoxon signed-rank test (on log2 transformed data) are summarized: ns, p > 0.05; p < 0.05. In (C) and (D), groups are compared with a two-tailed Mann-Whitney test. In (F), samples from the same individual are indicated with a gray line and p values shown are from a paired two-tailed Wilcoxon signed-rank test. In (G)–(J), the scales reflect the decimal log of the logicle transformed fluorescence intensity value.
Figure 2
Figure 2
Transcriptional landscape is altered between young and old HA-specific memory B cells (A) Heatmap showing expression of the top 15 features from t tests distinguishing each UMAP cluster from any other cluster (FDR < 0.01, log2 fold change >2). Each row is a feature (n = 76) and its gene symbol is shown. Each column is a single cell (n = 771). Cells are ordered by UMAP cluster, as shown in the color bar above the heatmap. The 15 features with the largest fold changes were selected with tied positions allowed, and a feature could appear in more than one comparison. Features that did not map to a gene symbol and duplicated features were removed prior to plotting. Log2 expression values are row-normalized and centered. (B) Dot plot showing the expression of selected genes in each UMAP cluster. The size of the dot reflects the proportion of cells within that cluster which express the gene of interest. The color of each dot is scaled according to normalized expression of the given gene in that cluster. Genes were selected as follows: the top two genes from a t test comparison between each cluster from all other clusters (log2 fold change >0.5, FDR < 0.25); biologically relevant B cell genes: selected genes from (A), B cell transcription factors, DNA repair proteins, B cell chemokine receptors, and other B cell surface receptors. (C) Diffusion coefficient (DC)-based pseudotime analysis from A/Cal09-specific B cells from day 42. Cells are shaded based on their position in pseudotime. Nodes are plotted in red and paths are shown by straight lines. (D) Pseudotime analysis as in (C), with colors determined by the UMAP clusters in (A) and defined in Figure 1. (E) Box plots of the numbers of cells within each UMAP cluster comparing day 0 and day 42 cell numbers sorted for 22- to 36-year-old and 67- to 86-year-old individuals. Clusters are labeled with putative surface marker genes shown in (B). p values from two-tailed paired Mann-Whitney tests are shown, after Benjamini-Hochberg correction for five tests. (F) Volcano plots from differential abundance analysis for the whole study (“all”) or the two age groups individually. Shown are −log10 (Benjamini-Hochberg) FDR and log2 fold change (L2FC). Gray dashed lines are shown at −log10(0.05) and at L2FC ± 0.5.
Figure 3
Figure 3
FcRL5+ hemagglutinin-binding B cells have cellular heterogeneity after vaccination (A) Hemagglutinin-specific B cells were analyzed using multiparameter spectral flow cytometry in a set of younger (18–36 years old, n = 11) and older (66–89 years old, n = 8) receiving trivalent influenza vaccination (three independent experiments). (B) Representative plots and summary data showing the frequency of hemagglutinin-specific B cells at day 0 compared with day 42 post vaccination in younger (18–36 years old, n = 11) and older (66–89 years old, n = 8) receiving trivalent influenza vaccination (three independent experiments). (C) Representative plots and summary data showing the frequency of total plasmablasts (CD27hiCD38hi) at baseline, 7, and 42 days post vaccination in younger (18–36 years old, n = 11; white dots) and older (66–89 years old, n = 8: gray dots) donors (three independent experiments). (D) Example flow plot showing expression of FcRL5 on dual-staining hemagglutinin-specific B cells. (E) Paired analysis of FcRL5+ hemagglutinin-specific B cells at baseline, 7 days, and 42 days post vaccination in younger (18–36 years old, n = 1; white dots) and older (66–89 years old, n = 8: gray dots) donors (three independent experiments). (F) FcRL5+ hemagglutinin-specific B cells at baseline, 7 days, and 42 days post vaccination in younger (18–36 years old, n = 11; white dots) and older (66–89 years old, n = 8; gray dots) donors (three independent experiments). (G) t-SNE clustering analysis of all hemagglutinin-specific B cells across the time course of vaccination in both younger (18–36 years old; n = 11) and older (66–89 years old; n = 8) donors (three independent experiments). (H) Heatmap showing expression of markers defining seven clusters of hemagglutinin-specific B cells. Darker red shading indicates higher expression. (I) t-SNE analysis in (G) stratified by age and time point before or after vaccination. (J) Summary data showing the percentage prevalence of each cluster according to age group and days since vaccination. (K) Prevalence of each cluster (clusters 1, 4, and 3) stratified by time point post vaccination and age. In (B) and (E), p values are from Wilcoxon signed-rank tests. In (C) and (F), p values are from Mann-Whitney tests. In (K), p values are from a Kruskal-Wallis test.
Figure 4
Figure 4
Differences in heavy-chain V segment usage, including broadly neutralizing IGHV1-69, in aged individuals after TIV immunization (A) UMAP embedding as previously, showing secreted immunoglobulin classes of that cell’s most abundant immunoglobulin heavy-chain transcript. Isotypes are combined to immunoglobulin class (e.g., IgG1, IgG2, IgG3, IgG4 grouped as IGHG): IGHA, n = 48 cells; IGHD, n = 12 cells; IGHG, n = 217 cells; IGHM, n = 112 cells; Un, unassigned n = 272 cells. (B) For each UMAP cluster, the proportion of secreted immunoglobulin classes are plotted. Each immunoglobulin class is indicated with the same shading as in (A). (C) V segment family usage in the immunoglobulin heavy chain at day 42 for younger and older individuals. (D) V segment family usage by HA-specific immunoglobulin heavy chains at day 42 for younger and older individuals expressed as the proportion of the cells separated by each UMAP cluster. (E) V allele usage in the immunoglobulin heavy chain at day 42 for younger and older individuals. (F) Heatmap summarizing the presence of biophysical attributes characteristic of broadly neutralizing antibody for IGHV1-69 B cells. The presence of F54, a hydrophobic residue at 53 and a tyrosine at 97, 98, or 99 are shown. An antibody is expected to be a bnAb if F54, there is a hydrophobic residue at position 53, and a Y within the CDR3. Presence of a characteristic is shown by a green box, and empty boxes reflect its absence. On the left side of the panel, the age group of the cell is shown (cells from 18- to 36-year-olds and 65- to 98-year-olds in white and gray, respectively), and the day of the sample is shown (day 0 and day 42 in white and black, respectively). The individual identifiers are listed next to each row and some individuals. (G) The proportion of B cells from each study day that encode IGHV1-69 bnAbs. Only those individuals with paired data from day 0 and day 42 are shown, which required >1 successfully filtered B cell with a productive heavy chain on both days. BnAbs were defined as shown in (F). Gray lines link the same individual. Paired two-tailed Mann-Whitney p values are shown. (H) The proportion of IGHV1-69 B cells within each UMAP cluster for both age groups and on days 0 and 42 after TIV.
Figure 5
Figure 5
Somatic hypermutation is reduced in hemagglutinin-specific memory B cells from aged individuals after TIV immunization (A) The number of nucleotide mutations within the antibody heavy chain is shown for each cell for days 0 and 42 and for older and younger individuals (n = 10/group). (B and C) The number of nucleotide mutations within the antibody heavy chain is shown for each region at day 42 and for older and younger individuals for FR (framework regions, B) or CDR (complementarity-determining regions, C). (D) The ratio of replacement/silent mutations within the antibody heavy chain is shown for each cell for days 0 and 42 and for older and younger individuals. The replacement/silent ratio was calculated as number of replacement mutations/(number of silent mutations + 0.01), as many cells had zero silent mutations and ≥1 replacement mutations. (E and F) The ratio of replacement/silent mutations within the heavy chain is shown for each cell from day 42 from both age groups (n = 10/group). (G and H) The number of mutations in the antibody heavy chain at day 42 plotted by age group for each UMAP cluster, for FR (G) or CDR (H). (I and J) The ratio of replacement/silent mutations in the antibody heavy chain at day 42 plotted by age group for each UMAP cluster, for FR (I) or CDR (J). Data are from ten younger and ten older people. In (G)–(J), each UMAP cluster is labeled and the colors correspond to its appearance in Figures 1, 2, and 4. For (E), (F), (I), and (J), the ratio of replacement/silent mutations was calculated as in (D) and plotted as a pseudolog. In (A)–(J), p values from two-tailed unpaired Mann-Whitney tests are shown. Where data are transformed for plotting (E, F, I, J), the test was performed on the untransformed data. The box plots show the median, and interquartile range (IQR), with whiskers extending to the furthest data point, up to a maximum of 1.5× IQR. In (E), (F), (I), and (J), the box plots correspond to the median and IQR of the transformed data.
Figure 6
Figure 6
GC emigrant memory B cells are FCRL5+ (A) UMAP of B cells (n = 27,265 cells) from fine-needle aspirates (FNAs) of draining axillary lymph nodes from a single healthy volunteer on days 0, 5, 12, 28, and 60 after quadrivalent influenza vaccine (QIV), as reported by Turner et al. (2020). (B) The B cell receptors detected in GC (GC) B cells on day 12 after QIV immunization are shared with earlier lymph node (LN) B cells, and are detectable in peripheral blood mononuclear cells (PBMC) that have been enriched for B cell memory (IgD−) at days 28 and 60 post vaccination. (C) UMAP of circulating B cells (n = 21,568 cells) from IgD− enriched PBMCs at days 0, 5, 12, 28, and 60 after QIV. Clusters were identified by Louvain clustering and annotated based on (D). (D) Dot plot showing the scaled normalized expression of selected genes used to annotate the clusters identified in (C). (E) UMAP of circulating QIV-specific B cells from IgD− enriched PBMCs at day 28 which share a GC BCR, n = 38 cells. (F) The percentage of QIV-specific B cells, present in the circulation at day 28, as in (E), is shown for each B cell cluster.

Similar articles

Cited by

References

    1. Allaire J.J., Xie Y., McPherson J., Luraschi J., Ushey K., Atkins A., Wickham H., Cheng J., Chang W., Iannone R. Dynamic Documents for R; 2021. rmarkdown.
    1. Allen J.C., Toapanta F.R., Chen W., Tennant S.M. Understanding immunosenescence and its impact on vaccination of older adults. Vaccine. 2020;38:8264–8272. doi: 10.1016/j.vaccine.2020.11.002. - DOI - PMC - PubMed
    1. Amezquita R.A., Lun A.T.L., Becht E., Carey V.J., Carpp L.N., Geistlinger L., Marini F., Rue-Albrecht K., Risso D., Soneson C., et al. Orchestrating single-cell analysis with Bioconductor. Nat. Methods. 2020;17:137–145. doi: 10.1038/s41592-019-0654-x. - DOI - PMC - PubMed
    1. Andrews S.F., Huang Y., Kaur K., Popova L.I., Ho I.Y., Pauli N.T., Henry Dunand C.J., Taylor W.M., Lim S., Huang M., et al. Immune history profoundly affects broadly protective B cell responses to influenza. Sci. Transl. Med. 2015;7:316ra192. doi: 10.1126/scitranslmed.aad0522. - DOI - PMC - PubMed
    1. Angerer P., Haghverdi L., Büttner M., Theis F.J., Marr C., Buettner F. destiny: diffusion maps for large-scale single-cell data in R. Bioinformatics. 2015;32:1241–1243. doi: 10.1093/bioinformatics/btv715. - DOI - PubMed

Publication types