

NF1 loss of function as an alternative initiating event in pancreatic ductal adenocarcinoma
- PMID: 36351408
- PMCID: PMC9716579
- DOI: 10.1016/j.celrep.2022.111623
NF1 loss of function as an alternative initiating event in pancreatic ductal adenocarcinoma
Abstract
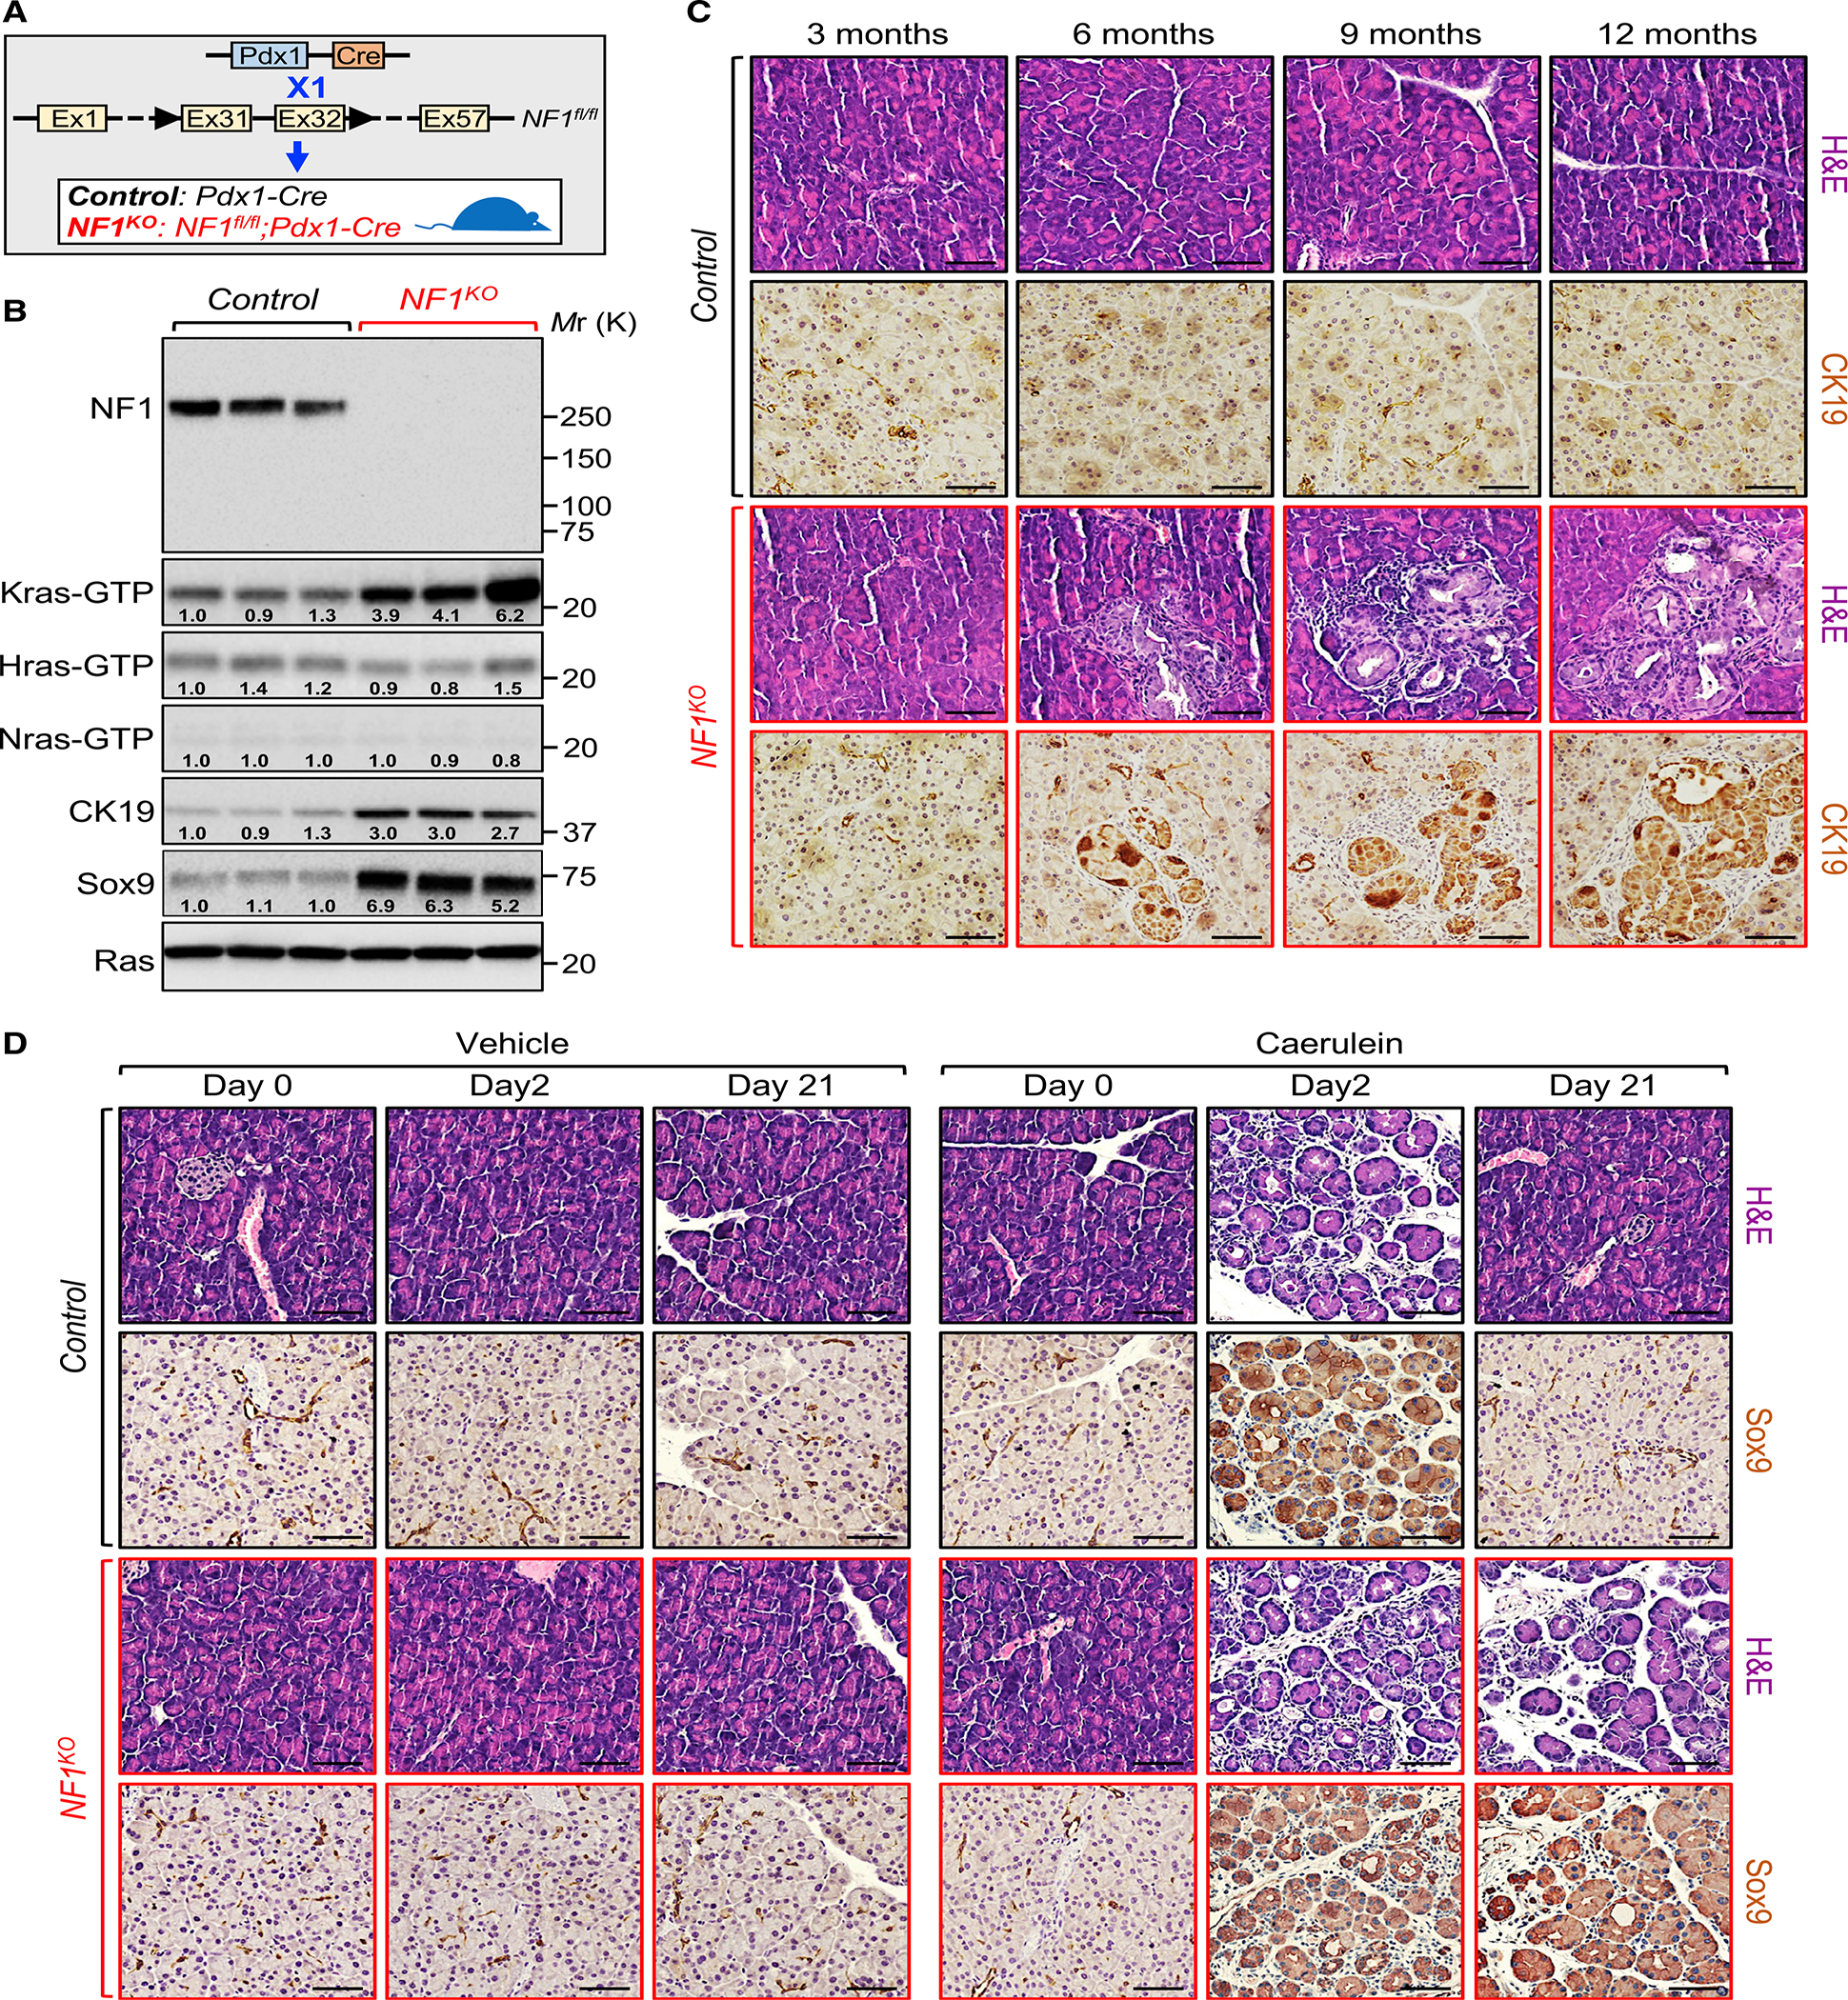
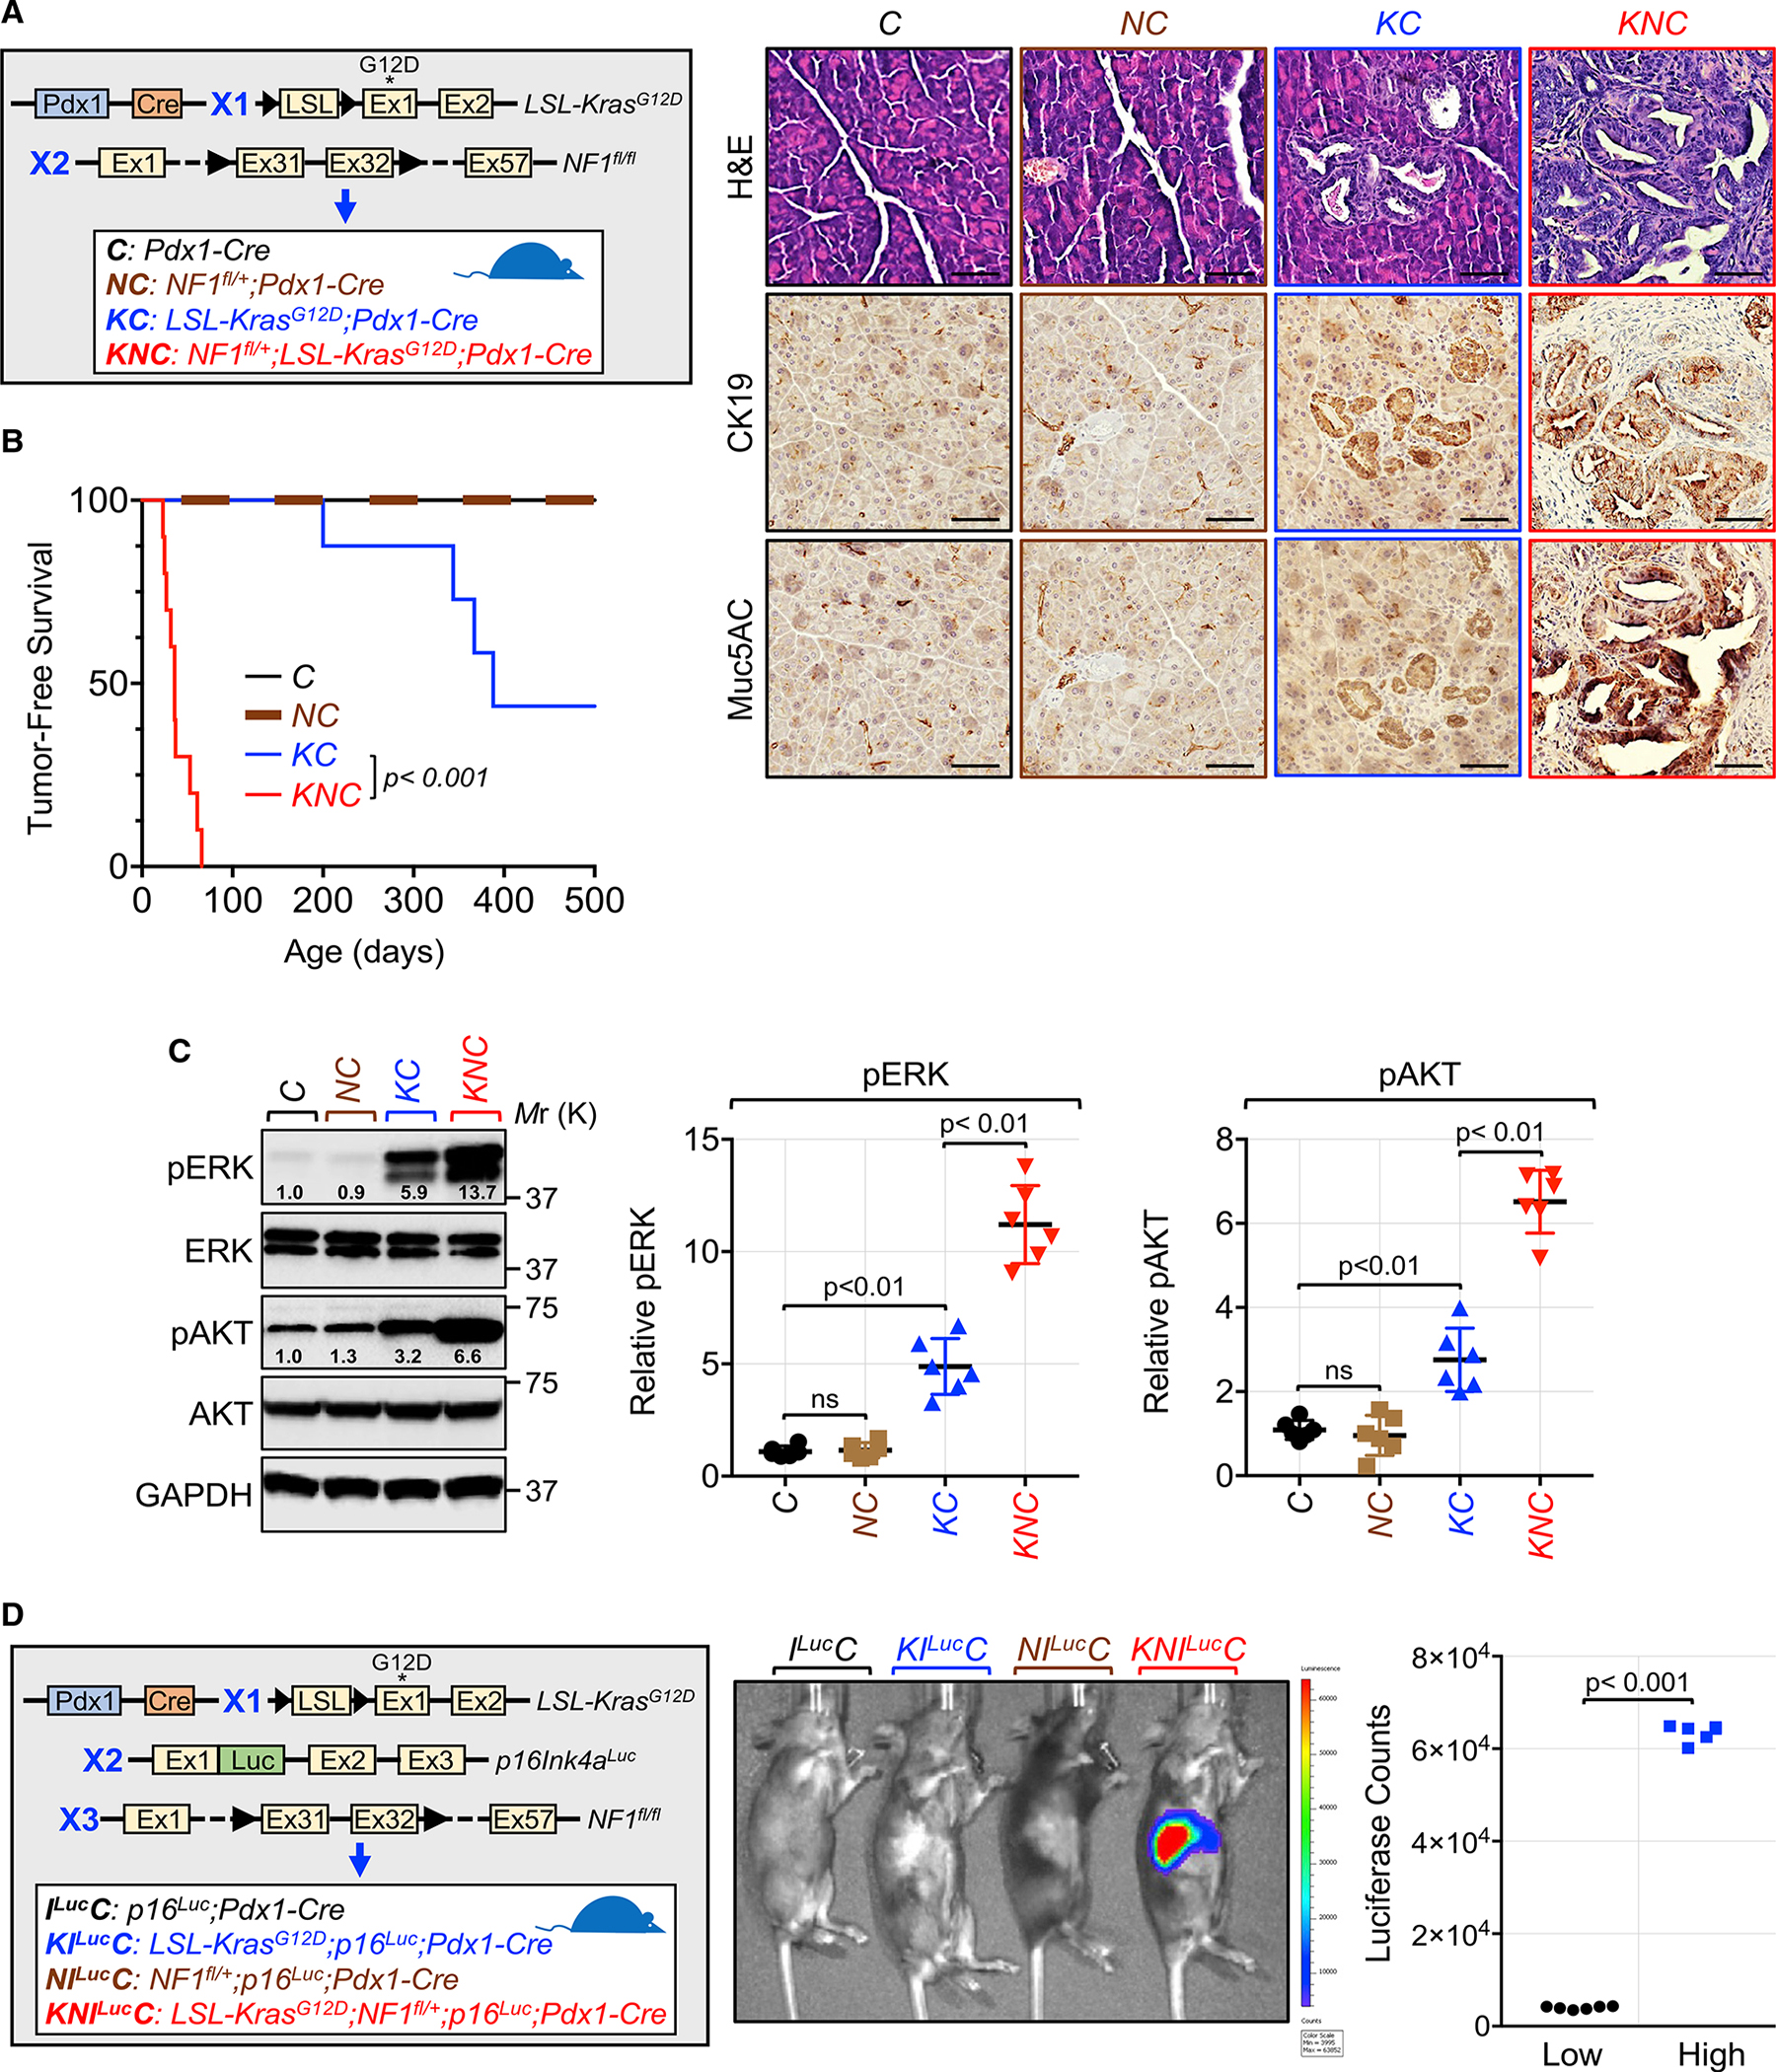
A long-standing question in the pancreatic ductal adenocarcinoma (PDAC) field has been whether alternative genetic alterations could substitute for oncogenic KRAS mutations in initiating malignancy. Here, we report that Neurofibromin1 (NF1) inactivation can bypass the requirement of mutant KRAS for PDAC pathogenesis. An in-depth analysis of PDAC databases reveals various genetic alterations in the NF1 locus, including nonsense mutations, which occur predominantly in tumors with wild-type KRAS. Genetic experiments demonstrate that NF1 ablation culminates in acinar-to-ductal metaplasia, an early step in PDAC. Furthermore, NF1 haploinsufficiency results in a dramatic acceleration of KrasG12D-driven PDAC. Finally, we show an association between NF1 and p53 that is orchestrated by PML, and mosaic analysis with double markers demonstrates that concomitant inactivation of NF1 and Trp53 is sufficient to trigger full-blown PDAC. Together, these findings open up an exploratory framework for apprehending the mechanistic paradigms of PDAC with normal KRAS, for which no effective therapy is available.
Keywords: CP: Cancer; alternative genetic drivers in pancreatic ductal adenocarcinoma; mosaic analysis with double markers; mutant KRAS; pancreatic ductal adenocarcinoma initiation; tumor-suppressor gene NF1; tumor-suppressor gene PML; tumor-suppressor gene TP53.
Copyright © 2022 The Author(s). Published by Elsevier Inc. All rights reserved.
Conflict of interest statement
Declaration of interests The authors declare no competing interests.
Figures


Similar articles
-
mTORC1 and mTORC2 Converge on the Arp2/3 Complex to Promote KrasG12D-Induced Acinar-to-Ductal Metaplasia and Early Pancreatic Carcinogenesis.Gastroenterology. 2021 Apr;160(5):1755-1770.e17. doi: 10.1053/j.gastro.2020.12.061. Epub 2021 Jan 1. Gastroenterology. 2021. PMID: 33388318
-
Oncogenic KRAS engages an RSK1/NF1 pathway to inhibit wild-type RAS signaling in pancreatic cancer.Proc Natl Acad Sci U S A. 2021 May 25;118(21):e2016904118. doi: 10.1073/pnas.2016904118. Proc Natl Acad Sci U S A. 2021. PMID: 34021083 Free PMC article.
-
Maintenance of acinar cell organization is critical to preventing Kras-induced acinar-ductal metaplasia.Oncogene. 2013 Apr 11;32(15):1950-8. doi: 10.1038/onc.2012.210. Epub 2012 Jun 4. Oncogene. 2013. PMID: 22665051 Free PMC article.
-
Interplays of glucose metabolism and KRAS mutation in pancreatic ductal adenocarcinoma.Cell Death Dis. 2022 Sep 24;13(9):817. doi: 10.1038/s41419-022-05259-w. Cell Death Dis. 2022. PMID: 36151074 Free PMC article. Review.
-
A special subtype: Revealing the potential intervention and great value of KRAS wildtype pancreatic cancer.Biochim Biophys Acta Rev Cancer. 2022 Jul;1877(4):188751. doi: 10.1016/j.bbcan.2022.188751. Epub 2022 Jun 19. Biochim Biophys Acta Rev Cancer. 2022. PMID: 35732240 Review.
Cited by
-
New Therapeutic Targets in RAS Wild-type Pancreatic Cancer.Curr Treat Options Oncol. 2024 Dec;25(12):1556-1562. doi: 10.1007/s11864-024-01242-z. Epub 2024 Nov 15. Curr Treat Options Oncol. 2024. PMID: 39546212 Review.
-
Impact of Mutational Status on Intracellular Effects of Cell-Permeable CaaX Peptides in Pancreatic Cancer Cells.Chembiochem. 2025 May 27;26(10):e202401076. doi: 10.1002/cbic.202401076. Epub 2025 Apr 24. Chembiochem. 2025. PMID: 40270247 Free PMC article.
-
The oncogenic role of NF1 in gallbladder cancer through regulation of YAP1 stability by direct interaction with YAP1.J Transl Med. 2023 May 5;21(1):306. doi: 10.1186/s12967-023-04157-9. J Transl Med. 2023. PMID: 37147639 Free PMC article.
-
K128 ubiquitination constrains RAS activity by expanding its binding interface with GAP proteins.EMBO J. 2024 Jul;43(14):2862-2877. doi: 10.1038/s44318-024-00146-w. Epub 2024 Jun 10. EMBO J. 2024. PMID: 38858602 Free PMC article.
-
Molecular and Clinical Features of Pancreatic Acinar Cell Carcinoma: A Single-Institution Case Series.Cancers (Basel). 2024 Oct 9;16(19):3421. doi: 10.3390/cancers16193421. Cancers (Basel). 2024. PMID: 39410042 Free PMC article.
References
-
- Siegel RL, Miller KD, and Jemal A (2020). Cancer statistics, 2020. CA. Cancer J. Clin. 70, 7–30. - PubMed
-
- Mizrahi JD, Surana R, Valle JW, and Shroff RT (2020). Pancreatic cancer. Lancet 395, 2008–2020. - PubMed
-
- Stathis A, and Moore MJ (2010). Advanced pancreatic carcinoma: current treatment and future challenges. Nat. Rev. Clin. Oncol. 7, 163–172. - PubMed
-
- Almoguera C, Shibata D, Forrester K, Martin J, Arnheim N, and Perucho M (1988). Most human carcinomas of the exocrine pancreas contain mutant c-K-ras genes. Cell 53, 549–554. - PubMed
-
- Hezel AF, Kimmelman AC, Stanger BZ, Bardeesy N, and Depinho RA (2006). Genetics and biology of pancreatic ductal adenocarcinoma. Genes Dev. 20, 1218–1249. - PubMed
Publication types
MeSH terms
Substances
Grants and funding
LinkOut - more resources
Full Text Sources
Medical
Molecular Biology Databases
Research Materials
Miscellaneous
