. 2022 Nov 8;41(6):111627.
doi: 10.1016/j.celrep.2022.111627.

Large-scale all-optical dissection of motor cortex connectivity shows a segregated organization of mouse forelimb representations

Affiliations

Large-scale all-optical dissection of motor cortex connectivity shows a segregated organization of mouse forelimb representations

Francesco Resta et al. Cell Rep. .

Abstract

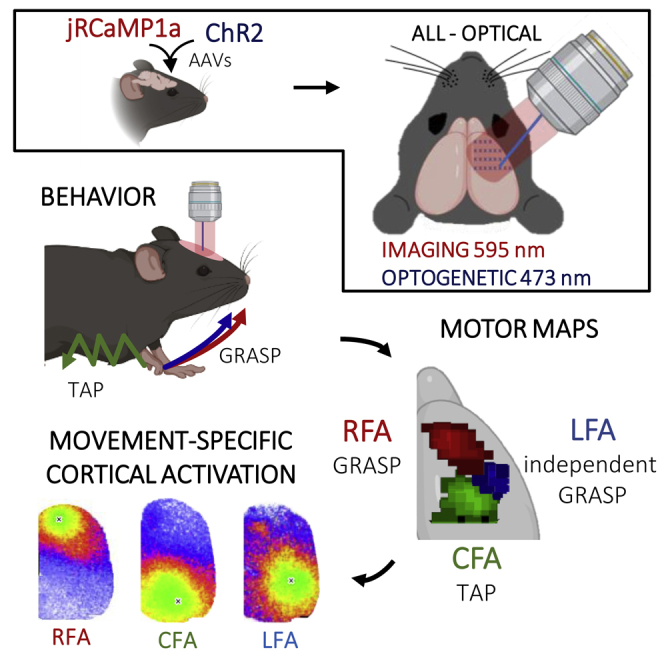
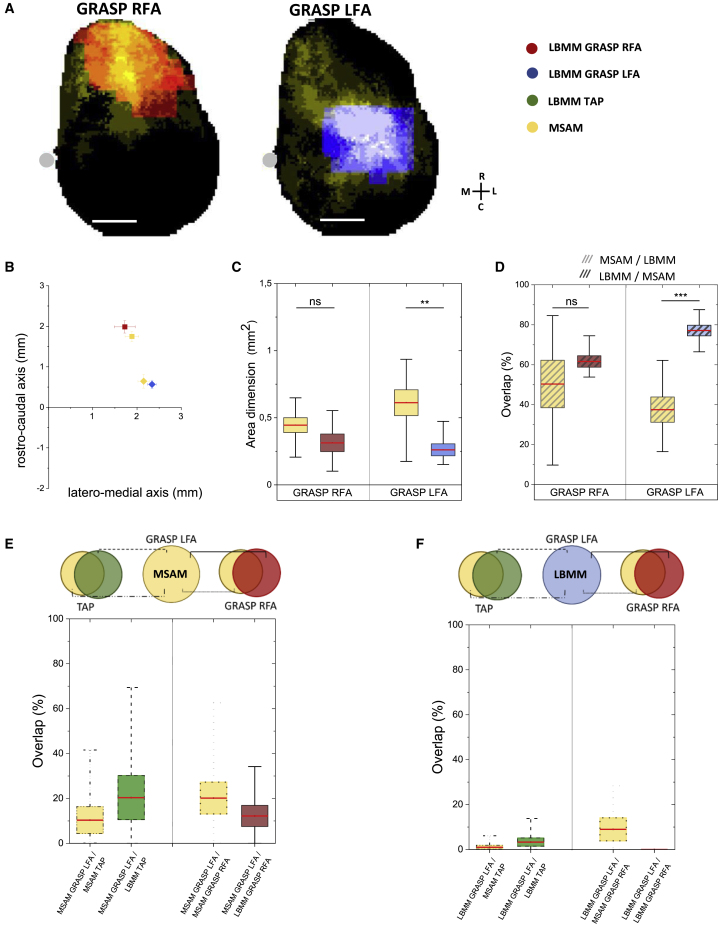
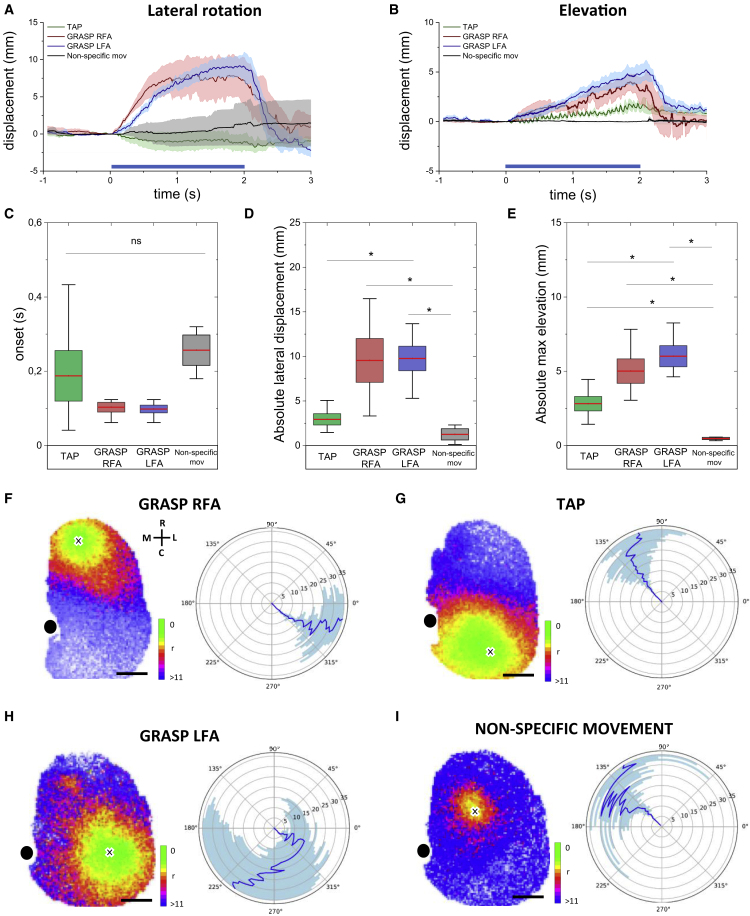
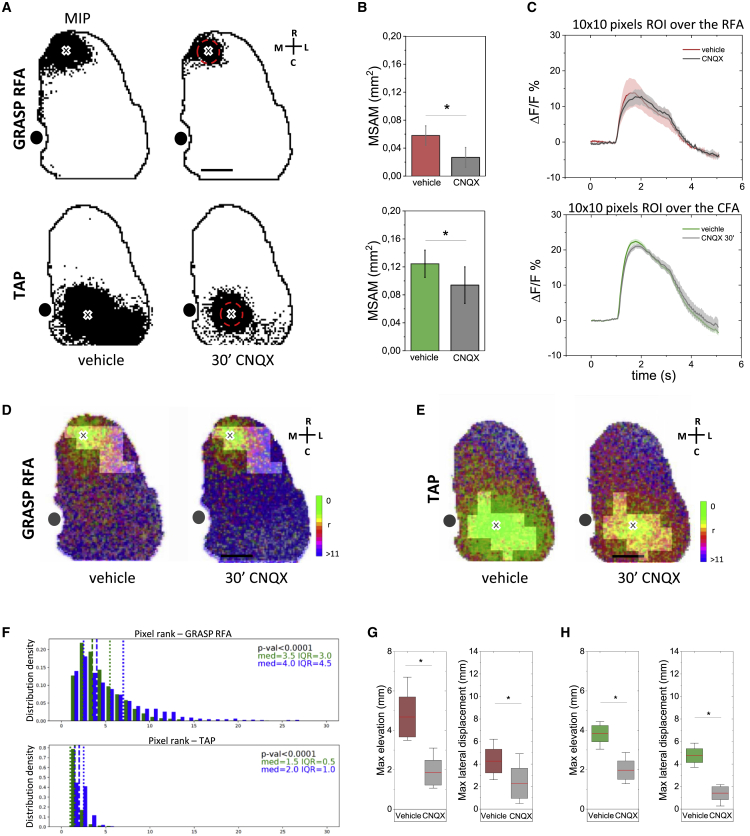
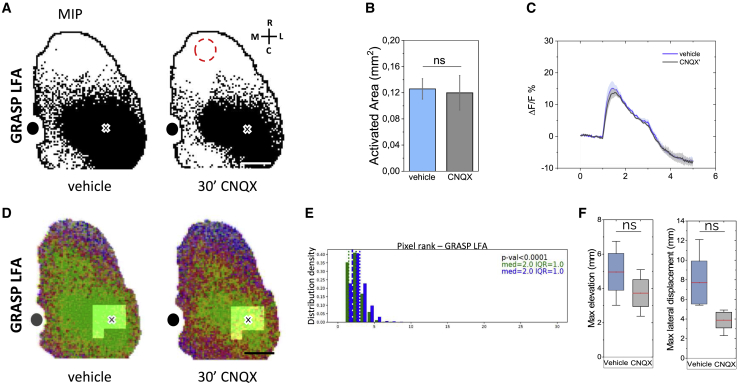
In rodent motor cortex, the rostral forelimb area (RFA) and the caudal forelimb area (CFA) are major actors in orchestrating the control of complex forelimb movements. However, their intrinsic connectivity and reciprocal functional organization are still unclear, limiting our understanding of how the brain coordinates and executes voluntary movements. Here, we causally probe cortical connectivity and activation patterns triggered by transcranial optogenetic stimulation of ethologically relevant complex movements exploiting a large-scale all-optical method in awake mice. Results show specific activation features for each movement class, providing evidence for a segregated functional organization of CFA and RFA. Importantly, we identify a second discrete lateral grasping representation area, namely the lateral forelimb area (LFA), with unique connectivity and activation patterns. Therefore, we propose the LFA as a distinct forelimb representation in the mouse somatotopic motor map.

Keywords: CFA; CP: Neuroscience; ChR2; RFA; calcium imaging; grasping; in vivo; jRCaMP1a; motor cortex organization; motor mapping; optogenetics; wide-field microscopy.


Conflict of interest statement

Declaration of interests The authors declare no competing interests.

Figures

None
Graphical abstract
Figure 1
Figure 1
Experimental design to perform parallel functional imaging and light-based motor mapping in awake mice (A) Schematic representation of the double-path wide-field fluorescence microscope. (B) (Left) Schematic representation of the right cortical hemisphere and the CFA and RFA relative positions. Red square outline is the FOV of the wide-field fluorescence microscope. Scale bar, 1 mm. (Right) Example of the in vivo fluorescence spatial distribution of jRCaMP1a along the mediolateral plane passing through RFA and CFA. Yellow dot indicates bregma. Scale bar, 1 mm. White cross represents the rostrocaudal (R–C) and mediolateral (M–L) axes. (C) In vivo long-term quantification of jRCaMP1a (red) and ChR2 (blue) spatial distribution along the mediolateral plane passing through RFA (n = 7; solid line) and CFA (n = 7; dashed line) injection sites, as in (B). (D) Ex vivo coronal slices showing the rostrocaudal transfection extension of jRCaMP1a and ChR2. Scale bar, 1 mm. (E) Representative immunohistochemistry images showing the neuronal expression of jRCaMP1a (red), ChR2 (blue), and NeuN (yellow) in the motor cortex. Scale bar, 50 μm. (F) Quantification of the colocalization ratio jRCaMP1a+/NeuN+ (70.2 ± 4.9%, n = 7). Error bars represent SEM.
Figure 2
Figure 2
Stereotyped cortical activation features of optogenetically evoked movements (A) (Left) Representative cartoons describing the evoked movements. Blue dots are the reflected laser stimulus representation. Red arrows indicate movement trajectories. (Right) Example frames from behavior recording during grasping-like movement (top) and locomotion-like movement (bottom). (B) Reconstruction of the mean trajectories evoked by optogenetic stimulation of GRASP RFA (red), GRASP LFA (blue), TAP (green), and non-specific movement (light gray). Dark traces show the movement trajectory during the 2 s stimulus period. Light traces show the movement trajectory 1 s post stimulation. Black circle indicates the forelimb start point. Error bars represent SEM. (C) Average light-based motor maps for GRASP movement (red) and TAP movement (green). White crosses represent the maps’ center of mass and cross-bar lengths represent SEM (GRASP RC = 1.8 ± 0.2 mm; GRASP LM = 1.8 ± 0.2 mm; TAP RC = −1.0 ± 0.2 mm; TAP LM = 1.6 ± 0.2 mm; n = 8). (D) Representative average calcium responses to the optogenetic stimulus train (10 ms, 16 Hz, 2 s) at increasing laser powers. The calcium response was extracted from an ROI placed over the site of stimulation. Yellow line represents the calcium response threshold associated with complex movement execution. Blue shading represents the stimulation period. Shading indicates SEM (nmice = 1; ntrain = 3). (E) Representative wide-field image sequences of cortical activation at different laser powers. White dot indicates bregma. Red dot represents the site of stimulus. Dashed lines indicate the stimulus period. Scale bar, 1 mm. (F) (Left) Calcium transients evoked at the minimum laser power (TAP, n = 11; GRASP, n = 11). Black line indicates average calcium transient. (Right) Representative image sequences of cortical activation at minimum evoking power in two extremes (lower and higher power). Red dot represents the site of stimulus. Dashed lines indicate the stimulus period. Yellow dashed dots indicate the ROI where the calcium transients were calculated. White dot indicates bregma. Scale bar, 1mm. (G) Linear regression between power thresholds and evoked calcium transient amplitudes recorded in the same animal (TAPintercept = 16.7 ± 1.8; TAPslope = −0.3 ± 0.4; GRASPintercept = 11.4 ± 1.7; GRASPslope = 0.2 ± 0.2; n = 11).
Figure 3
Figure 3
Movement-specific cortical functional connectivity is bounded to discrete modules (A) Representative schemes of cortical movement representations (left, LBMM GRASP n = 7, red; right, LBMM TAP n = 8, green) and their related average movement-specific activation map (MSAM; yellow; GRASP n = 7 and TAP n = 8). Gray dot indicates bregma. Scale bar, 1 mm. (B) Centers of mass of the LBMM (TAP MSAM, LM = 1.5 ± 0.1 mm, RC = −1.0 ± 0.2 mm; TAP LBMM, LM = 1.6 ± 0.2 mm, RC = −1.0 ± 0.2 mm; n [TAP] = 8. GRASP MSAM, LM = 1.7 ± 0.1 mm, RC = 1.9 ± 0.2 mm; GRASP LBMM, LM = 1.7 ± 0.2 mm, RC = 1.8 ± 0.2 mm, n [GRASP] = 7). Colors as in (A). Cross-bar lengths represent SEM. (C) Quantification of the area dimensions of the TAP LBMM (green), the GRASP LBMM (red), and the relative MSAMs (yellow). The red line corresponds to the mean, the box shows the standard error range, and whisker lengths are the extreme data points (TAP MSAM = 0.53 ± 0.06 mm2; TAP LBMM = 0.40 ± 0.04 mm2; n [TAP] = 8; GRASP MASM = 0.48 ± 0.06 mm2; GRASP LBMM = 0.64 ± 0.14 mm2; n [GRASP] = 7, two-tailed t test). (D and E) Comparison of the LBMM (D) and the MSAM (E) overlap (n = 7). The box shows the standard error range, and whiskers lengths are the extreme data points.
Figure 4
Figure 4
Identification of the lateral forelimb area (LFA) as a distinct grasping representation module (A) Representative schemes of the cortical movement representations (GRASP RFA in red; GRASP LFA in blue) and their related average MSAM (yellow) (n = 7). Gray dot indicates bregma. Scale bar, 1 mm. (B) Centers of mass of GRASP RFA LBMM (red), GRASP LFA LBMM (blue), and MSAMs (yellow) (LBMM RFARC = 2.0 ± 0.2 mm; RFALM = 1.7 ± 0.2 mm vs. LFARC = 0.6 ± 0.1 mm; LFALM = 2.3 ± 0.6 mm; MSAM RFARC = 1.7 ± 0.1 mm; RFALM = 1.9 ± 0.2 mm vs. LFARC = 0.6 ± 0.2 mm; LFALM = 2.1 ± 0.1 mm; n = 7). (C) Quantification of the area dimensions of the LBMMs and the relative MSAM (GRASP RFA MSAM = 0.44 ± 0.06 mm2; GRASP RFA LBMM = 0.31 ± 0.07 mm2; GRASP LFA MSAM = 0.61 ± 0.09 mm2; GRASP LFA LBMM = 0.26 ± 0.04 mm2; n = 7, ∗∗p < 0.01 two-tailed t test). (D) Quantification of the overlay between MSAMs and LBMMs per movement category (GRASP RFA MSAM/LBMM = 50% ± 12%; GRASP LFA MSAM/LBMM = 38% ± 6%; GRASP RFA LBMM/MSAM = 61% ± 3%; GRASP LFA LBMM/MSAM = 77% ± 2%; n = 7, ∗∗∗p < 0.001 two-tailed t test). Red lines indicate mean values, boxes show the standard error range, and whisker length represents the extreme data points. (E) Multiple comparison between GRASP LFA MSAM and the other movement category maps (n = 7). (F) Multiple comparison between GRASP LFA LBMM and the other movement category maps (n = 7).
Figure 5
Figure 5
Cortical activity propagation analysis reveals movement-specific spatiotemporal patterns of activation (A) Mediolateral forelimb displacement profiles. Dark traces represent the average mediolateral displacement per movement category. Shading indicates SEM. Dark blue line at the bottom shows the stimulus period. (B) As in (A), mean elevation displacement along the y axis. (C) Box-and-whisker plots showing the onset time per movement type (TAP, 0.19 ± 0.07 s; GRASP RFA, 0.10 ± 0.01 s; GRASP LFA, 0.10 ± 0.01 s; n = 5; non-specific mov, 0.26 ± 0.04 s, n = 3; one-way ANOVA with post hoc Bonferroni test). The box shows the standard error range, and whiskers lengths are the extreme data points. (D) Comparison of the absolute maximum displacement along the mediolateral axis (TAP, 2.9 ± 0.6 mm; GRASP RFA, 9.5 ± 2.5 mm; GRASP LFA, 9.8 ± 1.4 mm; n = 5; non-specific mov, 1.2 ± 0.6, n = 3; p < 0.05; one-way ANOVA with post hoc Bonferroni test). The box shows the standard error range, and whiskers lengths are the extreme data points. (E) Comparison of the absolute maximum elevation (TAP, 2.81 ± 0.48 mm; GRASP RFA, 5.01 ± 0.83 mm; GRASP LFA, 6.01 ± 0.71 mm; n = 5; non-specific mov, 0.47 ± 0.08 mm, n = 3; p < 0.05; one-way ANOVA with post hoc Bonferroni test). The box shows the standard error range, and whiskers lengths are the extreme data points. (F) (Left) Average map of the spatiotemporal activity propagation during GRASP RFA stimulation. (Right) Polar plot, centered on the stimulation site, showing the average propagation direction. Blue line represents the radius-dependent circular mean. Shading represents the standard deviation. (G–I) As in (F), spatiotemporal activity propagation maps and polar plots are shown in (G), (H), and (I) for TAP, GRASP LFA, and non-specific movement stimulations, respectively. Scale bars, 1 mm. Color bars, pixel ranks from 0 to <11 (nmice = 7; ntrain = 20).
Figure 6
Figure 6
Excitatory synaptic block leads to movement impairment and disruption of the associated connectivity features (A) Representative MIP showing optogenetically evoked cortical activation during vehicle (left) and CNQX topical application (right) in RFA (top) and CFA (bottom). Cross represents the stimulus site. Red dashed lines indicate the CNQX topical application site. Black dot represents bregma. Scale bar, 1 mm. (B) Quantification of the effect of CNQX topical application on MSAM extension in RFA (top) and CFA (bottom) (GRASP, vehicle = 0.05 ± 0.01 mm2 vs. CNQX = 0.02 ± 0.01 mm2, n = 3; TAP, vehicle = 0.12 ± 0.02 mm2 vs. CNQX = 0.09 ± 0.02 mm2, n = 3; p < 0.05, paired-sample t test). (C–E) Averaged evoked calcium transient profiles (C), recorded from an ROI placed over the site of stimulation, in vehicle and following CNQX topical application in RFA (top) and CFA (bottom) (GRASP, vehicle 14.72 ± 4.20 ΔF/F vs. CNQX 11.62 ± 3.66 ΔF/F, n = 3, paired-sample t test; TAP, vehicle 25.80 ± 1.31 ΔF/F vs. CNQX 21.26 ± 0.63 ΔF/F, n = 3, paired-sample t test). Shading represents SEM. Representative activity propagation maps of GRASP RFA (D) and TAP (E) showing the effects of CNQX topical application. Bright areas represent the LBMM. Scale bar, 1 mm. Color bar, pixel ranks from 0 to <11. (F) Pixel rank distribution of the region corresponding to the LBMM (bright area in [D] and [E]) for GRASP RFA (top) and TAP (bottom), before (green) and after (blue) CNQX topical application (n = 3). med, median; IQR, interquartile range; Wilcoxon signed-rank test. (G) CNQX topical application effect on GRASP RFA kinematics. Comparison of the absolute left-forelimb maximum elevation (left) and the absolute maximum displacement along the mediolateral axis (right) in vehicle (brown) and CNQX topical application (gray) in RFA (maximum elevation, vehicle 4.6 ± 1 mm vs. CNQX 1.8 ± 0.6 mm; GRASP maximum lateral displacement, vehicle 4.2 ± 1 mm vs. CNQX 2.2 ± 1 mm, n = 3; p < 0.05, paired-sample t test). Red lines indicate means, boxes show the standard error range, whisker length represents the extreme data points. (H) CNQX topical application effect on TAP CFA kinematics. Comparison of the absolute left-forelimb maximum elevation (left) and the absolute maximum displacement along the mediolateral axis (right) in vehicle (green) and CNQX topical application (gray) in CFA (maximum elevation, vehicle 3.8 ± 0.4 mm vs. CNQX 1.9 ± 0.4 mm; maximum lateral displacement: vehicle 4.7 ± 1 mm vs. CNQX 1.4 ± 1 mm, n = 3; p < 0.05, paired-sample t test). Red lines indicate means, boxes show the standard error range, and whisker length represents the extreme data points.
Figure 7
Figure 7
LFA-evoked grasping does not require RFA activation (A) Representative MIPs showing optogenetically evoked cortical activation in LFA during RFA topical application of vehicle (left) and CNQX (right). Cross represents the stimulus site. Red dashed line indicates the CNQX topical application site. Black dot represents bregma. Scale bar, 1 mm. (B) Quantification of the effect of CNQX topical application in RFA on LFA MSAM extension (vehicle 0.12 ± 0.01 mm2 vs. CNQX 0.11 ± 0.02 mm2; n = 3; paired-sample t test). (C) Averaged LFA evoked calcium transient profiles in vehicle and following CNQX topical application in RFA (vehicle 15 ± 2 ΔF/F vs. CNQX 13 ± 1 ΔF/F; n = 3; paired-sample t test). Shading represents SEM. (D) Representative activity propagation maps of GRASP LFA showing the effect of CNQX topical application in RFA. (E) Pixel rank distribution of the region corresponding to the LBMM (bright area in [D]) for GRASP LFA, before (vehicle) and after CNQX topical application (n = 3). med, median; IQR, interquartile range; Wilcoxon signed-rank test. (F) Effects of RFA CNQX topical application on GRASP LFA kinematics. Comparison of the absolute left forelimb maximum elevation (left) and the maximum lateral displacement (right) following LFA stimulation in vehicle and RFA CNQX topical application (maximum elevation, vehicle 4.9 ± 1.8 mm vs. CNQX 3.7 ± 1.4 mm; lateral displacement, vehicle 7.7 ± 2.0 mm vs. CNQX 1.3 ± 1.0 mm; n = 3; paired-sample t test). Red lines indicate means, boxes show the standard error range, and whisker length represents the extreme data points.

Similar articles

Cited by

References

    1. Akerboom J., Carreras Calderón N., Tian L., Wabnig S., Prigge M., Tolö J., Gordus A., Orger M.B., Severi K.E., Macklin J.J., Looger L.L. Genetically encoded calcium indicators for multi-color neural activity imaging and combination with optogenetics. Front. Mol. Neurosci. 2013;6:2. doi: 10.3389/fnmol.2013.00002. - DOI - PMC - PubMed
    1. Anderson C.T., Sheets P.L., Kiritani T., Shepherd G.M.G. Sublayer-specific microcircuits of corticospinal and corticostriatal neurons in motor cortex. Nat. Neurosci. 2010;13:739–744. doi: 10.1038/nn.2538. - DOI - PMC - PubMed
    1. Ayling O.G.S., Harrison T.C., Boyd J.D., Goroshkov A., Murphy T.H. Automated light-based mapping of motor cortex by photoactivation of channelrhodopsin-2 transgenic mice. Nat. Methods. 2009;6:219–224. doi: 10.1038/nmeth.1303. - DOI - PubMed
    1. Baker A., Kalmbach B., Morishima M., Kim J., Juavinett A., Li N., Dembrow N. Specialized subpopulations of deep-layer pyramidal neurons in the neocortex: bridging cellular properties to functional consequences. J. Neurosci. 2018;38:5441–5455. doi: 10.1523/JNEUROSCI.0150-18.2018. - DOI - PMC - PubMed
    1. Balasubramanian K., Papadourakis V., Liang W., Takahashi K., Best M.D., Suminski A.J., Hatsopoulos N.G. Propagating motor cortical dynamics facilitate movement initiation. Neuron. 2020;106:526–536.e4. doi: 10.1016/j.neuron.2020.02.011. e524. - DOI - PMC - PubMed

Publication types

LinkOut - more resources