. 2022 Nov 8;41(6):111611.
doi: 10.1016/j.celrep.2022.111611.

Cardiac myosin-specific autoimmune T cells contribute to immune-checkpoint-inhibitor-associated myocarditis

Affiliations

Cardiac myosin-specific autoimmune T cells contribute to immune-checkpoint-inhibitor-associated myocarditis

Taejoon Won et al. Cell Rep. .

Abstract

Immune checkpoint inhibitors (ICIs) are an effective therapy for various cancers; however, they can induce immune-related adverse events (irAEs) as a side effect. Myocarditis is an uncommon, but fatal, irAE caused after ICI treatments. Currently, the mechanism of ICI-associated myocarditis is unclear. Here, we show the development of myocarditis in A/J mice induced by anti-PD-1 monoclonal antibody (mAb) administration alone without tumor cell inoculation, immunization, or viral infection. Mice with myocarditis have increased cardiac infiltration, elevated cardiac troponin levels, and arrhythmia. Anti-PD-1 mAb treatment also causes irAEs in other organs. Autoimmune T cells recognizing cardiac myosin are activated and increased in mice with myocarditis. Notably, cardiac myosin-specific T cells are present in naive mice, showing a phenotype of antigen-experienced T cells. Collectively, we establish a clinically relevant mouse model for ICI-associated myocarditis and find a contribution of cardiac myosin-specific T cells to ICI-associated myocarditis development and pathogenesis.

Keywords: CP: Immunology; ICI; ICI-associated myocarditis; PD-1; autoimmune T cells; cardiac myosin; immune checkpoint inhibitor.


Conflict of interest statement

Declaration of interests The authors declare no competing interests.

Figures

Figure 1.
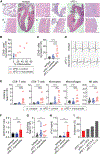
Figure 1.. αPD-1 mAb treatment induces irAEs in multiple organs in mice
(A) Representative images of H&E staining on hearts, lungs, colons, skeletal muscles, and pancreases from αPD-1 mAb-treated A/J mice and isotype controls. Scale bars: 100 μm. (B) Pie charts showing the incidence of inflammation in hearts, lungs, colons, skeletal muscles, and pancreases after αPD-1 mAb treatment. (C) Flow cytometry analysis of CD62L and CD44 expression in peripheral blood mononuclear cell (PBMC) CD8+ and CD4+ T cells from αPD-1 mAb-treated mice and isotype controls. (D and E) Cell frequency of naive (CD62L+CD44) and memory (CD62L+CD44+) subsets in PBMC CD8+ T cells (D) and memory subset in PBMC CD4+ T cells (E) from mice with αPD-1 mAb or isotype Ab treatment. Pooled data of two experiments are shown. Student’s t test was used for statistical analysis. *p < 0.05; **p < 0.005.
Figure 2.
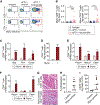
Figure 2.. αPD-1 mAb treatment causes ICI-associated myocarditis in mice
(A) Representative images of H&E staining on right atrium (RA), left ventricle (LV), pericardium (P), and endocardium (E) from αPD-1 mAb-treated A/J mice and isotype controls. Arrows indicate P. Scale bars: 100 (black) or 800 μm (gray). (B and C) Myocarditis development assessed by histology (B) and flow cytometry analysis (B and C). αPD-1 mAb-treated mice were divided into two subgroups by histologic observation−myocarditis development (αPD-1 myocarditis) and no myocarditis (αPD-1 control). Number of CD45+ infiltrating cells in hearts was assessed by flow cytometry. (D) Electrocardiogram trace of mice with αPD-1 myocarditis and isotype controls. (E) Number of cardiac CD8+ T cells (CD3+CD8+), CD4+ T cells (CD3+CD4+), monocytes (CD11b+ Ly6GF4/80+Ly6C+), macrophages (CD11b+Ly6G F4/80+CD64+Ly6C), and NK cells (NKp46+) in αPD-1 myocarditis, αPD-1 control, and isotype control mice. (F) Ratio of CD8+ T cells to CD4+ T cells in hearts of αPD-1 myocarditis, αPD-1 control, and isotype control mice. (G) Number of B cells (CD19+) in mouse hearts of αPD-1 myocarditis, αPD-1 control, and isotype control groups. (H) Serum cTnI levels in αPD-1 myocarditis, αPD-1 control, and isotype control mice. (I) Incidence of myocarditis in mice treated with αPD-1 mAb alone or in combination with CFA, αCTLA-4 mAb, or IL-12. Pooled data of two or three experiments are shown. One-way ANOVA with Tukey’s test was used for statistical analysis. *p < 0.05; **p < 0.005; ***p < 0.0005; ****p < 0.0001.
Figure 3.
Figure 3.. Cardiac T cells are activated in mice with PD-1 inhibitor-induced myocarditis
(A and B) Flow cytometry analysis (A) and cell frequencies (B) of effector (CD62LCD44+), memory (CD62L+CD44+), and naive (CD62L+CD44) cells in cardiac CD8+ and CD4+ T cells from αPD-1 mAb-treated mice and isotype controls. αPD-1 mAb-treated mice were divided into two subgroups−myocarditis development (αPD-1 myocarditis) and no myocarditis (αPD-1 control). (C) Cell frequency of CD69+ T cells in hearts of αPD-1 myocarditis, αPD-1 control, and isotype control mice. (D and E) Gene expression of cardiac CD8+ (D) and CD4+ (E) T cells in αPD-1 myocarditis, αPD-1 control, and isotype control groups. CD8+ and CD4+ T cells were fluorescence-activated cell sorted (FACS) from heart cells. (F and G) Flow cytometry analysis (F) and cell frequencies (G) of TIM-3PD-1+, TIM-3+PD-1+, and TIM-3+PD-1 cells in CD8+ and CD4+ T cells from hearts of αPD-1 myocarditis, αPD-1 control, and isotype control mice. (H and I) Gene expression of FACS cardiac CD8+ (H) and CD4+ (I) T cells from αPD-1 myocarditis, αPD-1 control, and isotype control mice. Pooled data of two or three experiments are shown in (A)–(C), (F), and (G). Representative data of two independent experiments are shown as mean values in (D), (E), (H), and (I). One-way ANOVA with Tukey’s test was used for statistical analysis. *p < 0.05; **p < 0.005; ***p < 0.0005; ****p < 0.0001.
Figure 4.
Figure 4.. T cells specific for cardiac myosin contribute to PD-1 inhibitor-induced myocarditis
(A and B) Flow cytometry analysis (A) and cell frequencies (B) of cardiac myosin-MHC tetramer-positive cells in CD8+ and CD4+ T cells of αPD-1 mAb-treated A/J mouse hearts and isotype controls. αPD-1 mAb-treated mice were divided into two subgroups−myocarditis development (αPD-1 myocarditis) and no myocarditis (αPD-1 control). CD8+ and CD4+ T cells were stained with Myhc338–348-H-2Dd and Myhc334–352-I-Ak tetramers, respectively. (C–F) Gene expression of cardiac-myosin-specific T cells in mice with αPD-1 myocarditis. Myhc tetramer-positive and -negative cells were FACS from cardiac CD8+ (C and E) and CD4+ (D and F) T cells. (G) Representative images of H&E staining on hearts from mice received Myhc-primed or control CD4+ donor T cells. All recipients were treated with αPD-1 mAb after T cell transfer. Scale bars: 50 μm. (H) Percentage of inflamed area in heart section from mice received Myhc-primed or control CD4+ donor T cells. (I) Number of CD45+ infiltrating cells in hearts assessed by flow cytometry analysis. Pooled data of two or three experiments are shown in (A), (B), and (G)–(I). Representative data of two independent experiments are shown as mean values in (C)–(F). One-way ANOVA with Tukey’s test (B) or Student’s t test (C–F, H, and I) was used for statistical analysis. *p < 0.05; **p < 0.005; ***p < 0.0005; ****p < 0.0001.
Figure 5.
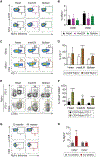
Figure 5.. PD-1-expressing cardiac myosin-specific T cells exist in naive A/J mice
(A and B) Flow cytometry analysis (A) and cell frequencies (B) of cardiac myosin-MHC tetramer-positive cells in CD8+ and CD4+ T cells of naive A/J mice. Hearts, mediastinal lymph nodes (medLNs), and spleens were examined. CD8+ and CD4+ T cells were stained with Myhc338–348-H-2Dd and Myhc334–352-I-Ak tetramers, respectively. (C and D) Flow cytometry plots (C) and frequencies (D) of PD-1-expressing cells in Myhc334–352 tetramer-positive and -negative CD4+ T cells. Cells were isolated from naive mouse hearts, medLNs, and spleens. (E and F) Flow cytometry analysis (E) and cell frequencies (F) of CD44+CD69+ cells in PD-1-positive and -negative cardiac-myosin-specific CD4+ T cells. Cells were isolated from naive hearts, medLNs, and spleens. (G and H) Flow cytometry plots (G) and cell frequencies (H) of cardiac myosin-MHC tetramer-positive cells among CD8+ and CD4+ T cells in the heart of naive young (12 weeks) and aged (44 weeks) mice. Pooled data of two experiments are shown. Student’s t test was used for statistical analysis. *p < 0.05; **p < 0.005; ****p < 0.0001.

Similar articles

Cited by

References

    1. Kraehenbuehl L, Weng CH, Eghbali S, Wolchok JD, and Merghoub T. (2022). Enhancing immunotherapy in cancer by targeting emerging immunomodulatory pathways. Nat. Rev. Clin. Oncol 19, 37–50. 10.1038/s41571-021-00552-7. - DOI - PubMed
    1. Bagchi S, Yuan R, and Engleman EG (2021). Immune checkpoint inhibitors for the treatment of cancer: clinical impact and mechanisms of response and resistance. Annu. Rev. Pathol 16, 223–249. 10.1146/annurev-pathol-042020-042741. - DOI - PubMed
    1. Esfahani K, Elkrief A, Calabrese C, Lapointe R, Hudson M, Routy B, Miller WH Jr., and Calabrese L. (2020). Moving towards personalized treatments of immune-related adverse events. Nat. Rev. Clin. Oncol 17, 504–515. 10.1038/s41571-020-0352-8. - DOI - PubMed
    1. Martins F, Sofiya L, Sykiotis GP, Lamine F, Maillard M, Fraga M, Shabafrouz K, Ribi C, Cairoli A, Guex-Crosier Y, et al. (2019). Adverse effects of immune-checkpoint inhibitors: epidemiology, management and surveillance. Nat. Rev. Clin. Oncol 16, 563–580. 10.1038/s41571-019-0218-0. - DOI - PubMed
    1. Song P, Zhang D, Cui X, and Zhang L. (2020). Meta-analysis of immune-related adverse events of immune checkpoint inhibitor therapy in cancer patients. Thorac. Cancer 11, 2406–2430. 10.1111/1759-7714.13541. - DOI - PMC - PubMed

Publication types

Substances

LinkOut - more resources