. 2022 Dec 1;109(12):2230-2252.
doi: 10.1016/j.ajhg.2022.10.010. Epub 2022 Nov 8.

EMILIN1 deficiency causes arterial tortuosity with osteopenia and connects impaired elastogenesis with defective collagen fibrillogenesis

Affiliations

EMILIN1 deficiency causes arterial tortuosity with osteopenia and connects impaired elastogenesis with defective collagen fibrillogenesis

Christin S Adamo et al. Am J Hum Genet. .

Abstract

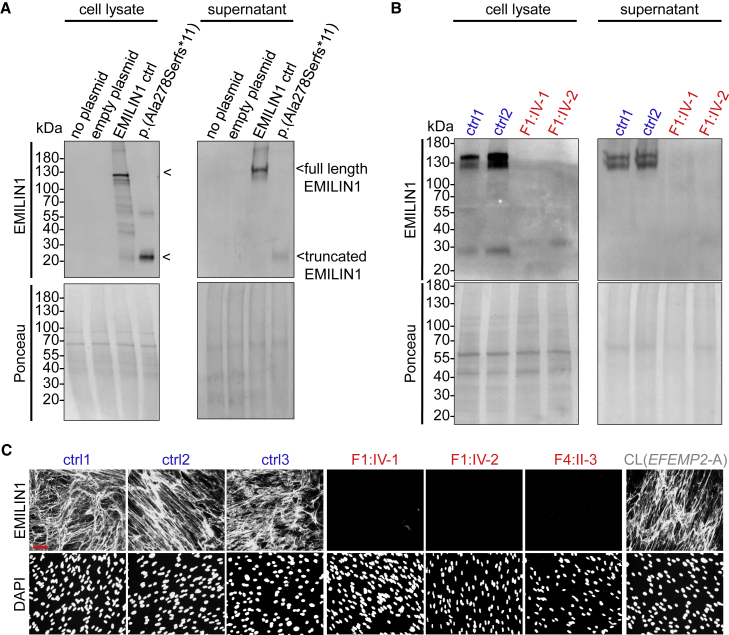
EMILIN1 (elastin-microfibril-interface-located-protein-1) is a structural component of the elastic fiber network and localizes to the interface between the fibrillin microfibril scaffold and the elastin core. How EMILIN1 contributes to connective tissue integrity is not fully understood. Here, we report bi-allelic EMILIN1 loss-of-function variants causative for an entity combining cutis laxa, arterial tortuosity, aneurysm formation, and bone fragility, resembling autosomal-recessive cutis laxa type 1B, due to EFEMP2 (FBLN4) deficiency. In both humans and mice, absence of EMILIN1 impairs EFEMP2 extracellular matrix deposition and LOX activity resulting in impaired elastogenesis, reduced collagen crosslinking, and aberrant growth factor signaling. Collagen fiber ultrastructure and histopathology in EMILIN1- or EFEMP2-deficient skin and aorta corroborate these findings and murine Emilin1-/- femora show abnormal trabecular bone formation and strength. Altogether, EMILIN1 connects elastic fiber network with collagen fibril formation, relevant for both bone and vascular tissue homeostasis.

Keywords: EFEMP2; EMILIN1; LOX; aortic aneurysm; arterial tortuosity; collagen; cutis laxa; elastic fiber; extracellular matrix; fracture.


Conflict of interest statement

Declaration of interests The authors declare no competing interests.

Figures

None
Graphical abstract
Figure 1
Figure 1
Clinical and molecular characteristics of affected individuals with EMILIN1 variants (A) Clinical pictures of F1:IV-1 (i, age 3 years; iii, age 7 years), F1:IV-2 (ii, age 3 months; iv, age 5 years), and F3:III-1 (v, vi, vii, age 3 months). Craniofacial features are mild and include downslanted palpebral fissures, epicanthal folds, a convex and/or broad nasal ridge and tip, long and flat philtrum, thin upper lip, and micrognathia. (B) Vascular imaging studies. i. 3D vascular imaging in F1:IV-1 showing arterial tortuosity and aortic root dilatation (frontal view). ii–iv. MR angiography and 3D vascular imaging indicating severe tortuosity of the aorta, intracranial, pulmonary, and carotid arteries in F2:IV-2 (axial, left sagittal, and frontal view). v–vi. Aortic aneurysm and tortuosity illustrated with CT rendering images (frontal view) and echocardiography in F3:III-1. vii–viii: Giant and progressive aortic aneurysm in F4:II-3 upon CT imaging (frontal and left sagittal views). (C) Conventional radiography and CT imaging showing fractures in most affected individuals (frontal views). i–iii: F2:IV-3 presenting with a fracture of the right clavicle and his older sibling F2:IV-2 presenting with bilateral fractures of the lower ribs and fibula. iv–v: F3:III-1 presenting with bilateral skull fractures. (D) Pedigree analysis of affected individuals in four unrelated families carrying EMILIN1 variants confirms segregation of the variants with the phenotype. (E) Schematic representation of the identified variants in EMILIN1 and corresponding protein in four unrelated families. i: Genomic position of each variant indicated within the exon structure of EMILIN1. ii. Schematic representation of the domains of EMILIN1, consisting of an N-terminal cysteine-rich EMI domain, followed by a coiled-coil structure, a leucine zipper motif, a short collagenous region, and a C-terminal gC1q domain. Alterations in protein domain structure are indicated correspondingly.
Figure 2
Figure 2
Bi-allelic pathogenic variants in EMILIN1 lead to loss of mRNA and protein production (A) Abolishment of protein production shown by introducing the p.Ala278Serfs11 EMILIN1 variant into a human EMILIN1 full-length overexpression construct. Secreted amounts of truncated EMILIN1 by HEK293 cells transfected with the p.Ala278Serfs11 construct were hardly detectable. (B) Western blot analyses of cell lysates and supernatants from F1:IV-1 and F1:IV-2 fibroblasts show complete abolishment of secreted EMILIN1. (C) Immunofluorescence analyses of F1:IV-1, F1:IV-2, and F4:II-3 fibroblast cultures indicate absence of EMILIN1 within assembled ECM networks. EMILIN1-positive fibers are detected in age-matched healthy controls and in fibroblast cultures derived from an individual with CL carrying a homozygous EFEMP2 pathogenic variant (CL(EFEMP2-A)). Scale bar, 50 μm.
Figure 3
Figure 3
EMILIN1 deficiency affects elastic fiber integrity (A) Severe disorganization and fragmentation of elastic fibers in aortic media from F2:IV-2 and an individual with CL carrying a bi-allelic EFEMP2 pathogenic variant (CL(EFEMP2-D)) as detected by Weigert’s Resorcin-Fuchsin staining. All obtained sections are matched to their anatomical locations (descending aorta). Reduced presence of intact elastic fibers is even more pronounced in end-stage vascular tissue. Scale bar, 25 μm. (B) Representative micrographs from TEM analysis of dermis from F1:IV-1, F3:III-1, F4:II-3, and CL(EFEMP2-B) skin biopsies (images of CL(EFEMP2-C) not shown) showing an abnormal ultrastructure of elastic fibers (ef) in cross section indicated by a fragmented elastin core and a bare mantle of microfibrils (indicated by asterisk where visible). The presence of collagen fibrils (col) in cross section is indicated. Elastin shows variability in staining intensity due to slight changes in fixation protocols used at the two different imaging centers. Scale bars, 500 nm. (C) TEM analysis after immunogold labeling of EMILIN1 in skin biopsies from F4:II-3 shows reduced presence of EMILIN1 within the elastic fiber/microfibril network in comparison to unaffected sibling (F4:II-2) or parent (F4:I-1). Scale bars, 200 nm. Font legend: red, affected individual; green, non-affected carrier; blue, control subject.
Figure 4
Figure 4
EMILIN1 deficiency specifically impacts EFEMP2 ECM deposition (A and B) EFEMP2 deposition by EMILIN1-deficient fibroblast cultures is severely impaired while FN1 network assembly appears to be unperturbed. F1:IV-1 and F1:IV-2 fibroblasts show impairment of EFEMP2 deposition similar to fibroblasts from a proband with CL carrying a homozygous EFEMP2 pathogenic variant (CL(EFEMP2-A)). F4:II-3 cells still assemble very thin EFEMP2-positive fibers with reduced intensity (boxed area at 2.5-fold magnification). Scale bar represents 50 μm. (C) TEM of skin biopsies subjected to immunogold labeling for EFEMP2 shows a strongly reduced presence of EFEMP2 signals within the elastic fiber/microfibril network of F4:II-3 when compared to unaffected sibling (F4:II-2) or parent (F4:I-1). Font legend: red, affected individual; green, non-affected carrier; blue, control subject.
Figure 5
Figure 5
Loss of EMILIN1 affects LOX activity as well as collagen network assembly and crosslinking (A) Reduced LOX levels in supernatants from F1:IV-1, F1:IV-2, F4:II-3, and EFEMP2-deficient CL(EFEMP2-A) fibroblast cultures shown by western blot analysis. (B) LOX enzyme activity measurements of fibroblast cell layers from F1:IV-1, F1:IV-2, and F4:II-3 show a significant reduction of 35%–70% after 9 days of culture. LOX activity of EFEMP2-deficient CL(EFEMP2-A) fibroblast cultures was reduced by 30%. LOX activity analyses were performed in triplicates and data from three independent experiments are shown. (C) Immunofluorescence analysis of collagen I networks in F1:IV-1, F1:IV-2, and F4:II-3 fibroblast cultures reveals very thin collagen I fibers at low density similar to those detected in EFEMP2-deficient cells from a CL individual (CL(EFEMP2-A)). Scale bar: 50 μm. (D) Negative staining TEM of supernatants from F1:IV-1, F1:IV-2, F4:II-3, as well as EFEMP2-deficient CL(EFEMP2-A) fibroblasts shows a thin and curly appearance of collagen fibrils with a less distinct cross-band pattern compared to controls. (E) Negative staining TEM of supernatants from Emilin1−/− dermal fibroblast cultures also shows a thin and curly appearance of collagen fibrils with a less distinct cross-band pattern. Scale bar in TEM micrographs: 200 nm. (F) Crosslink analysis of Emilin1−/− mouse skin at postnatal day 60 (P60) indicates a significant reduction of the sum of identified collagen crosslinks. DHLNL, dihydroxylysinonorleucine; HLNL, hydroxylysinonorleucine; HHMD, histidinohydroxymerodesmosine. Data are expressed as mean ± SD. ∗∗∗p < 0.001, ∗∗∗∗p < 0.0001. Two-tailed unpaired t test with Welch’s correction was used for statistical analysis to compare two groups.
Figure 6
Figure 6
EMILIN1 deficiency affects collagen synthesis and TGF-β activity (A, left) EMILIN1-deficient F1:IV-1, F1:IV-2, and EFEMP2-deficient CL(EFEMP2-A) fibroblasts show increased COL1A1 transcript levels by RT-qPCR. (A, right) Increased intracellular collagen I levels in F1:IV-1, F1:IV-2, F4:II-3, and CL(EFEMP2-A) fibroblasts by western blot analysis. (B) Significantly increased transcript levels of TGF-β-responsive genes CTGF and PAI1 in F1:IV-2 as well as COL3A1 in F1:IV-1 and F4:II-3 fibroblasts. RT-qPCR analyses in (A) and (B) were performed in triplicates and data from three independent experiments are shown. (C) Increased signals of phospho-SMAD2 (pSMAD2) and CTGF in the aortic walls of F2:IV-2 and CL(EFEMP2-D). Scale bar, 25 μm. (D) Increased collagen deposition within the expanded intralaminar spaces of aortic wall from F2:IV-2 by trichrome and picrosirius red staining. Detected collagen shows either a diffuse, loosely packed, or bulky appearance which is similar to the collagen distribution within the aortic wall of CL(EFEMP2-D). Scale bar, 25 μm. Data are expressed as mean ± SD. p < 0.05, ∗∗p < 0.01, ∗∗∗p < 0.001, ∗∗∗∗p < 0.0001. Two-tailed unpaired t test with Welch’s correction was used for statistical analysis in (A) and (B). ANOVA (analysis of variance) and subsequent Bonferroni multiple comparison post-tests were used for statistical analysis in (C).
Figure 7
Figure 7
EMILIN1 deficiency affects collagen fibril formation (A) TEM micrographs showing variable collagen fibril size in skin from affected individuals F1:IV-1 and F3:III-1 (aff((EMILIN1)), as well as from a CL proband with EFEMP2 deficiency (CL(EFEMP2-B)) when compared to control. Scale bars, 500 nm. (B, left) Histograms representing collagen fibril diameter measurements. (B, right) Quantification of collagen fibril diameters in skin from F1:IV-1 and F3:III-1 as well as CL(EFEMP2) (CL(EFEMP2-B) and CL(EFEMP2-C) combined) indicates a wider distribution shifted toward higher abundance of collagen fibrils with larger and more variable diameter. (C) TEM micrographs obtained from Emilin1−/− mouse skin at 12 weeks of age shows abnormal appearance of collagen fibrils with wider diameter. Scale bar, 500 nm. (D) Quantification of collagen diameters in Emilin1−/− skin at 12 weeks of age indicated increased presence of collagen fibrils with larger diameter. (Left) Histogram representing collagen fibril diameter measurements on TEM micrographs from Emilin1−/− and wild-type mouse skin. (right) Quantification of measured collagen fiber diameters obtained from TEM analysis of Emilin1−/− and wild-type mouse skin. Data are expressed as mean ± SD. ∗∗∗∗p < 0.0001. ANOVA and subsequent Bonferroni multiple comparison post-tests were used for statistical analysis.
Figure 8
Figure 8
EMILIN1 is required for proper bone structure in mice (A, top) Representative microCT images near the distal femoral metaphyseal region. (A, middle) magnified area and (A, bottom) corresponding cross-sectional view of adult Emilin1−/− mouse femur diaphysis at 14 weeks of age (P98) showing decreased trabecular bone. (B) Quantitative micro-CT analysis shows increased trabecular spacing, and increased cortical bone area in Emilin1−/− mice femora at P98. (C) Three-point-bending test shows a significant increase in stiffness of Emilin1−/− mouse femora at P98. (D) Bone mineral density is significantly reduced in femora of Emilin1−/− mice at P4. Data are expressed as mean ± SD. p < 0.05, ∗∗p < 0.01. Two-tailed unpaired t test with Welch’s correction was used for statistical analysis.

References

    1. Schmelzer C.E.H., Hedtke T., Heinz A. Unique molecular networks: Formation and role of elastin cross-links. IUBMB Life. 2020;72:842–854. - PubMed
    1. Bressan G.M., Daga-Gordini D., Colombatti A., Castellani I., Marigo V., Volpin D. Emilin, a component of elastic fibers preferentially located at the elastin-microfibrils interface. J. Cell Biol. 1993;121:201–212. - PMC - PubMed
    1. Schiavinato A., Keene D.R., Wohl A.P., Corallo D., Colombatti A., Wagener R., Paulsson M., Bonaldo P., Sengle G. Targeting of EMILIN-1 and EMILIN-2 to Fibrillin Microfibrils Facilitates their Incorporation into the Extracellular Matrix. J. Invest. Dermatol. 2016;136:1150–1160. - PubMed
    1. Colombatti A., Spessotto P., Doliana R., Mongiat M., Bressan G.M., Esposito G. The EMILIN/Multimerin family. Front. Immunol. 2011;2:93. - PMC - PubMed
    1. Schiavinato A., Keene D.R., Imhof T., Doliana R., Sasaki T., Sengle G. Fibulin-4 deposition requires EMILIN-1 in the extracellular matrix of osteoblasts. Sci. Rep. 2017;7:5526. - PMC - PubMed

Publication types

Supplementary concepts