. 2023 Feb;14(1):93-107.
doi: 10.1002/jcsm.13109. Epub 2022 Nov 9.

Interleukin-6 initiates muscle- and adipose tissue wasting in a novel C57BL/6 model of cancer-associated cachexia

Affiliations

Interleukin-6 initiates muscle- and adipose tissue wasting in a novel C57BL/6 model of cancer-associated cachexia

Isabella Pototschnig et al. J Cachexia Sarcopenia Muscle. 2023 Feb.

Abstract

Background: Cancer-associated cachexia (CAC) is a wasting syndrome drastically reducing efficacy of chemotherapy and life expectancy of patients. CAC affects up to 80% of cancer patients, yet the mechanisms underlying the disease are not well understood and no approved disease-specific medication exists. As a multiorgan disorder, CAC can only be studied on an organismal level. To cover the diverse aetiologies of CAC, researchers rely on the availability of a multifaceted pool of cancer models with varying degrees of cachexia symptoms. So far, no tumour model syngeneic to C57BL/6 mice exists that allows direct comparison between cachexigenic- and non-cachexigenic tumours.

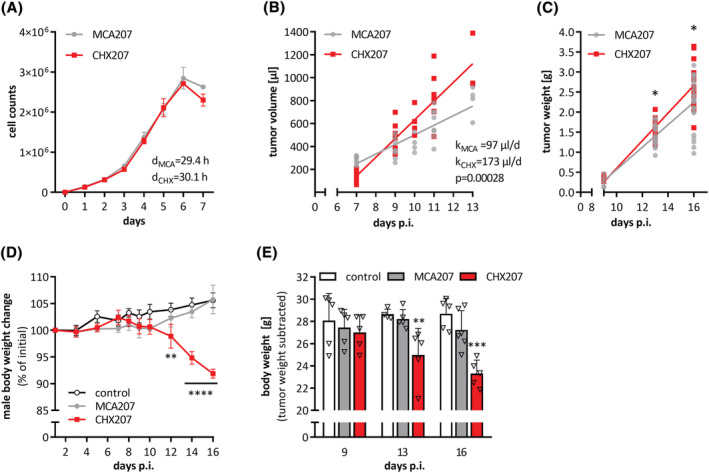
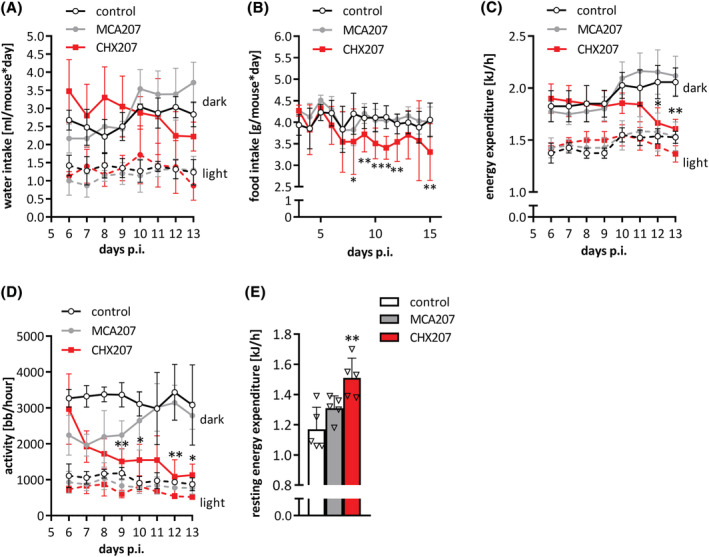
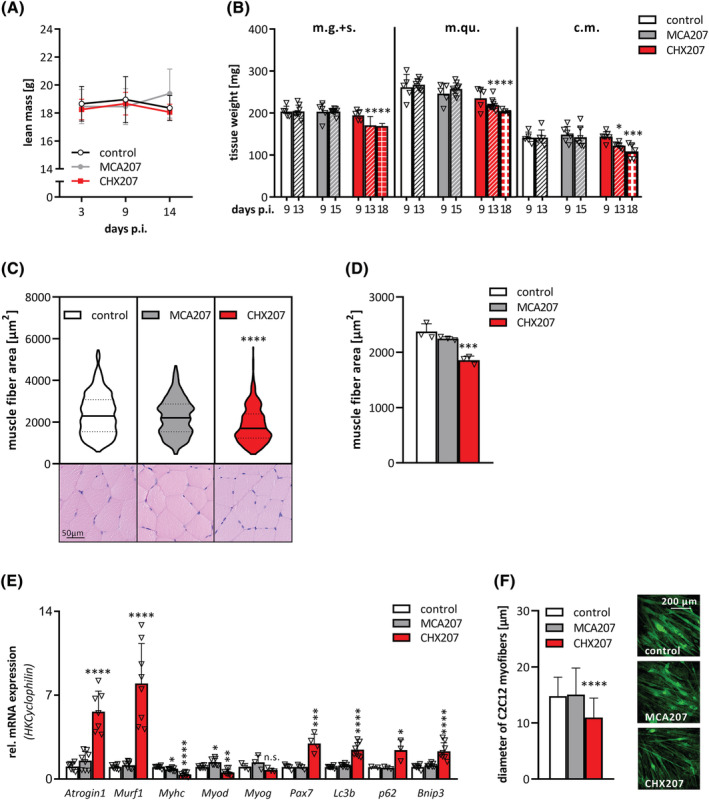
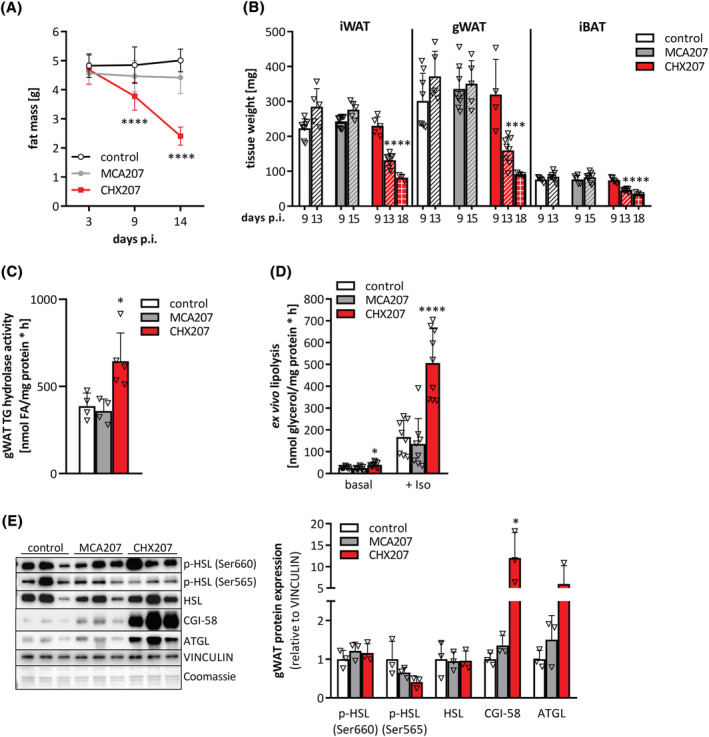
Methods: MCA207 and CHX207 fibrosarcoma cells were intramuscularly implanted into male or female, 10-11-week-old C57BL/6J mice. Tumour tissues were subjected to magnetic resonance imaging, immunohistochemical-, and transcriptomic analysis. Mice were analysed for tumour growth, body weight and -composition, food- and water intake, locomotor activity, O2 consumption, CO2 production, circulating blood cells, metabolites, and tumourkines. Mice were sacrificed with same tumour weights in all groups. Adipose tissues were examined using high-resolution respirometry, lipolysis measurements in vitro and ex vivo, and radioactive tracer studies in vivo. Gene expression was determined in adipose- and muscle tissues by quantitative PCR and Western blotting analyses. Muscles and cultured myotubes were analysed histologically and by immunofluorescence microscopy for myofibre cross sectional area and myofibre diameter, respectively. Interleukin-6 (Il-6) was deleted from cancer cells using CRISPR/Cas9 mediated gene editing.

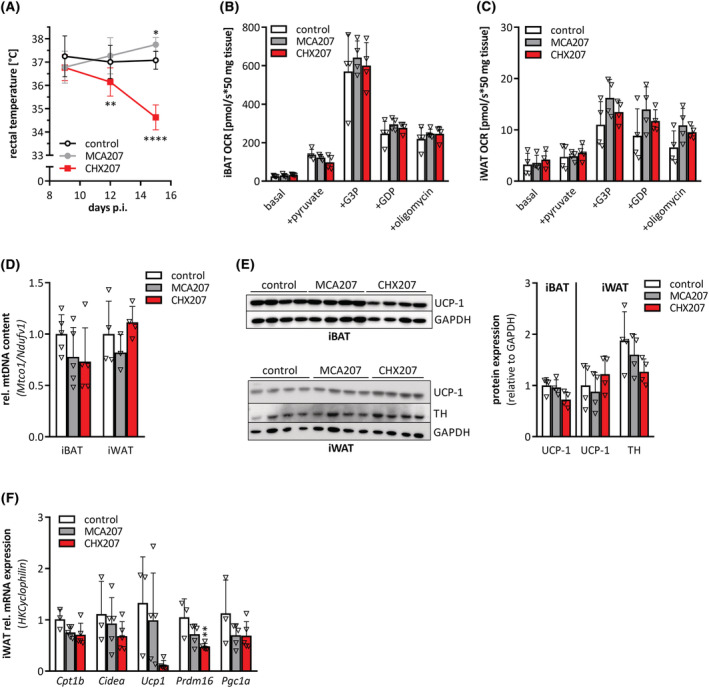
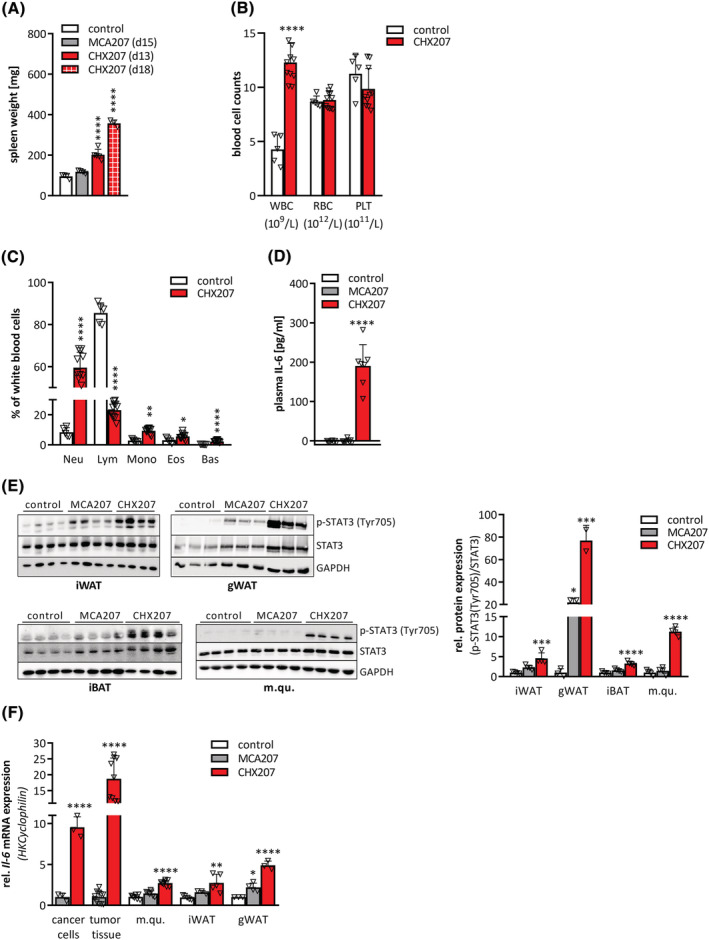
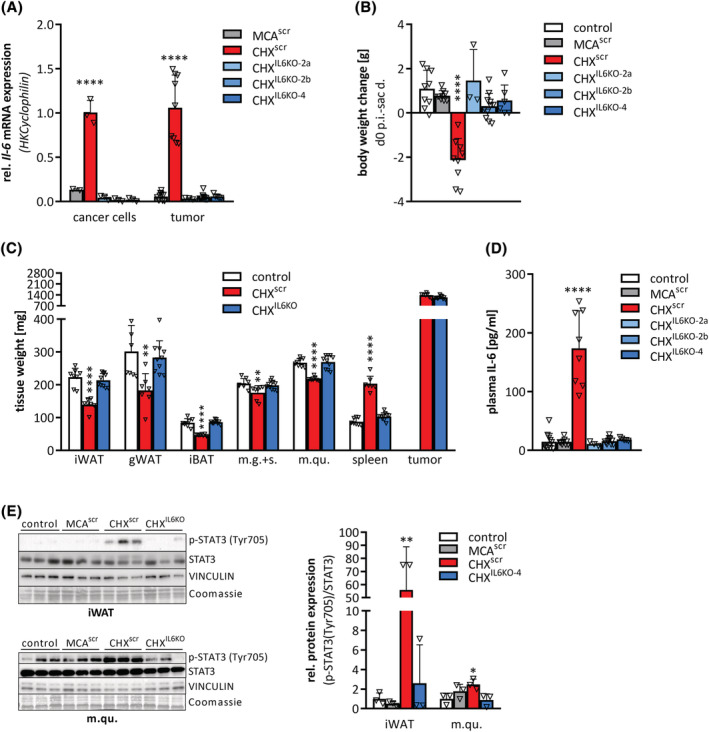
Results: CHX207, but not MCA207-tumour-bearing mice exhibited major clinical features of CAC, including systemic inflammation, increased plasma IL-6 concentrations (190 pg/mL, P ≤ 0.0001), increased energy expenditure (+28%, P ≤ 0.01), adipose tissue loss (-47%, P ≤ 0.0001), skeletal muscle wasting (-18%, P ≤ 0.001), and body weight reduction (-13%, P ≤ 0.01) 13 days after cancer cell inoculation. Adipose tissue loss resulted from reduced lipid uptake and -synthesis combined with increased lipolysis but was not associated with elevated beta-adrenergic signalling or adipose tissue browning. Muscle atrophy was evident by reduced myofibre cross sectional area (-21.8%, P ≤ 0.001), increased catabolic- and reduced anabolic signalling. Deletion of IL-6 from CHX207 cancer cells completely protected CHX207IL6KO -tumour-bearing mice from CAC.

Conclusions: In this study, we present CHX207 fibrosarcoma cells as a novel tool to investigate the mediators and metabolic consequences of CAC in C57BL/6 mice in comparison to non-cachectic MCA207-tumour-bearing mice. IL-6 represents an essential trigger for CAC development in CHX207-tumour-bearing mice.

Keywords: Adipose tissue; C57BL/6; Cachexia; Cancer; Interleukin-6.


Conflict of interest statement

The authors of this manuscript declare that they have no conflicts of interest.

Figures

Figure 1
Figure 1
CHX207 fibrosarcoma causes progressive body weight loss in C57BL/6J mice. (A) Proliferation of MCA207 and CHX207 cells in culture was determined by counting cells on 7 consecutive days after seeding (n = 3, d = doubling time). (B–E) Ten‐ to 11‐week‐old male C57BL/6J mice were injected with 1 × 106 MCA207, 1 × 106 CHX207 cells, or 1xPBS (control). (B) Tumour volume of MCA207‐ and CHX207‐tumour‐bearing mice was assessed by MR imaging at the indicated time points. (C) Mice were sacrificed, tumours were excised and weighed at Day 9, Day 13 or Day 16 p.i. (n = 10–14). (D) Body weight relative to initial body weight of male control‐ and tumour‐bearing mice (n = 4–6). (E) Tumour‐free body weight of male control‐ and tumour‐bearing mice (n = 4–6). Data are presented as means ± SD. Significance was determined by A,B,C) two‐sided Student’s t‐test or D,E) one‐way ANOVA followed by Tukey's post hoc analysis (*P ≤ 0.05, **P ≤ 0.01, ***P ≤ 0.001, ****P ≤ 0.0001).
Figure 2
Figure 2
Cachectic CHX207 mice show reduced activity, but higher resting energy expenditure. (A–E) Ten‐ to 11‐week‐old male C57BL/6J mice were injected with 1 × 106 MCA207 cells, 1 × 106 CHX207 cells, or 1× PBS (control) and were analysed using a laboratory animal monitoring system (PhenoMaster, TSE systems GmbH) for 4 consecutive days (dark and light cycles separated) either Days 6–9 or Days 10–13 p.i. for (A) water intake, (C) energy expenditure, or (D) locomotor activity. (B) Food intake was measured by manually weighing food pellets of single housed mice on 15 consecutive days. (E) Resting energy expenditure was determined of anaesthetized mice on Day 13 p.i. in a laboratory animal monitoring system (measurement for 90 min). Data are presented as means ± SD. Significance was determined by one‐way ANOVA followed by Tukey's post hoc analysis (n = 4–5, *P ≤ 0.05, **P ≤ 0.01).
Figure 3
Figure 3
CHX207‐induced skeletal muscle wasting results from reduced anabolic and increased catabolic signalling. (A–E) Ten‐ to 11‐week‐old male C57BL/6J mice were injected with 1 × 106 MCA207 cells, 1 × 106 CHX207 cells, or 1xPBS (control). (A) Total lean mass was determined by NMR (n = 10–14). (B) Mice were sacrificed with same tumour size and musculus gastrocnemius + soleus (m.g. + s.), musculus quadriceps (m.qu.) and cardiac muscle (c.m.) were excised and weighed (Day 9 p.i., n = 5; Day 13 or 15 p.i., n = 8–10; Day 18 p.i., n = 3). (C,D) muscle fibre areas (CSA) were measured on H&E‐stained cross‐sections of m.qu. Using CaseViewer (Day 18 p.i.; n = 3; >140 fibres per muscle). (C) Violin plot and representative histological images and (D) means of CSA. Each dot represents the mean of >140 CSA of one m.qu. (E) mRNA expression levels of marker genes for muscle catabolic signalling (Atrogin, Murf1), muscle protein synthesis/myogenic differentiation (Myhc, Myod, Myogenin, Pax7) and autophagy/apoptosis (Lc3b, p62, Bnip3) in m.qu. were determined by qRT‐PCR. Cyclophilin was used as housekeeping gene (Day 13 p.i., n = 4–8). (F) Differentiated C2C12 myotubes were incubated with control‐, 10% MCA207‐ or CHX207‐cancer cell conditioned medium for 48 h. Myotubes were visualized using Actinin antibody and confocal microscopy. Diameters of approximately 10 myotubes per field and 20 fields per condition were measured using Fiji. Data are presented as means ± SD. Significance was determined by one‐way ANOVA followed by Tukey's post hoc analysis (n = 4–6, *P ≤ 0.05, **P ≤ 0.01, ***P ≤ 0.001, ****P ≤ 0.0001).
Figure 4
Figure 4
Adipose tissue loss in CHX207 mice results from increased lipolysis. (A–E) Ten‐ to 11‐week‐old male C57BL/6J mice were injected with 1 × 106 MCA207 cells, 1 × 106 CHX207 cells, or 1× PBS (control). (A) Total fat mass was determined by NMR (n = 10–14). (B) Mice were sacrificed with same tumour size and inguinal subcutaneous (iWAT), gonadal (gWAT) white, and interscapular brown adipose tissue (iBAT) were excised and weighed (Day 9 p.i., n = 5; Day 13 p.i. and Day 15 p.i., n = 8–10; Day 18 p.i., n = 3). (C) In vitro TG hydrolase activity of gWAT tissue lysates (Day 13 p.i.). (D) Ex vivo lipolysis of gWAT fat explants was determined by measuring glycerol release in the presence (+Iso) or absence (basal) of 1 μM isoproterenol (Day 9 p.i., n = 9). (E) Western blotting analysis of p‐HSL (Ser660), p‐HSL (Ser565), HSL, CGI‐58 and ATGL in gWAT. VINCULIN was used as loading control (Day 9 p.i.). data are presented as means ± SD. Significance was determined by one‐way ANOVA followed by Tukey's post hoc analysis (*P ≤ 0.05, **P ≤ 0.01, ***P ≤ 0.001, ****P ≤ 0.0001).
Figure 5
Figure 5
CHX207‐induced cachexia is not associated with browning of WAT. (A–F) Ten‐ to 11‐week‐old male C57BL/6J mice were injected with 1 × 106 MCA207 cells, 1 × 106 CHX207 cells, or 1× PBS (control). (A) Rectal temperature was measured using a rectal probe (n = 10–14). (B,C) Oxygen consumption rates (OCRs) of total homogenates of (B) interscapular brown (iBAT), and (C) inguinal subcutaneous (iWAT) white adipose tissue were determined in the presence of pyruvate, glycerol‐3‐phosphate (G3P), guanosine diphosphate (GDP), and oligomycin (oligo) using an oxygraph on Day 9 p.i. (D) Relative mitochondrial content was determined by calculating the ratio of Mtco1 (mitochondria encoded) and Ndufv1 (nucleus encoded) mRNA levels of iBAT (n = 5) and iWAT (n = 4) (Day 13 p.i.). (E) Uncoupling protein‐1 (UCP‐1) protein in iBAT and UCP‐1 and tyrosine hydroxylase (TH) protein levels in iWAT (Day 13 p.i.) were determined by Western blotting analysis. GAPDH was used as loading control. (F) mRNA expression levels of Cpt1b, Cidea, Ucp1, Prdm16, and Pgc1a in iWAT were determined by qRT‐PCR (Day 9 p.i.). Cyclophilin was used as housekeeping gene. Data are presented as means ± SD. Significance was determined by one‐way ANOVA followed by Tukey's post hoc analysis (n = 4–5, *P ≤ 0.05, **P ≤ 0.01, ***P ≤ 0.001, ****P ≤ 0.0001).
Figure 6
Figure 6
CHX207 mice exhibit systemic inflammation and high levels of circulating IL‐6. (A–F) Ten‐ to 11‐week‐old male C57BL/6J mice were injected with 1 × 106 MCA207 cells, 1 × 106 CHX207 cells, or 1× PBS (control). (A) Mice were sacrificed at the indicated timepoints, spleens were excised and weighed. (B,C) Cell counts of whole blood from control and tumour‐bearing mice were analysed using an abacus Haematology analyser (n = 5–11, Day 14 p.i.). (B) Absolute counts of white blood cells (WBC), red blood cells (RBC), and platelets (PLT). (C) Relative white blood cells subtypes (neutrophils (Neu), lymphocytes (Lym), monocytes (Mono), eosinophils (Eos), basophils (bas)). (D) Plasma IL‐6 concentrations were determined using ELISA (n = 7–9). (E) Western blotting analysis of p‐STAT3 (Tyr705) and STAT3 protein expression and quantification of p‐STAT3 (Tyr705) relative to total STAT3 in inguinal white adipose tissue (iWAT), gonadal white adipose tissue (gWAT), interscapular brown adipose tissue (iBAT), and musculus quadriceps (m.qu.) (Day 13 p.i.). GAPDH was used as loading control. (F) mRNA expression levels of Il‐6 in MCA207‐ and CHX207‐cancer cells (n = 3–4) and tumour tissue, m.qu., iWAT and gWAT (Day 13 p.i., n = 7–11) were determined by qRT‐PCR. Cyclophilin was used as housekeeping gene. Data are presented as means + SD. Significance was determined by B,C,F) two‐sided Student's t‐test or A,D,E,F) one‐way ANOVA (*P ≤ 0.05, **P ≤ 0.01, ***P ≤ 0.001, ****P ≤ 0.0001).
Figure 7
Figure 7
Cancer cell derived IL‐6 initiates cachexia in CHX207 mice. (A–E) Ten‐ to 11‐week‐old male C57BL/6J mice were injected with either 1 × 106 MCAscr, CHXscr, CHXIL6KO‐2a, CHXIL6KO‐2b, or CHXIL6KO‐4 cells or 1× PBS (control) and were sacrificed with same tumour size (1.4 g) (n = 7–11, except for CHXIL6KO‐2a n = 3). (A) mRNA expression levels of Il‐6 in cancer cells and tumour tissue were determined by qRT‐PCR. Cyclophilin was used as housekeeping gene. (B) Body weight change from Day 0 p.i. (d0) to day of sacrifice (sac d.) (tumour weight was subtracted). (C) Inguinal subcutaneous (iWAT), gonadal (gWAT) white, interscapular brown adipose tissue (iBAT), musculus gastrocnemius + soleus (m.g. + s.), musculus quadriceps (m.qu.), spleen, and tumour were excised and weighed. (D) Plasma IL‐6 concentrations were determined by ELISA. (E) Western blotting analysis to detect p‐STAT3 (Tyr705) and STAT3 protein expression and quantification of p‐STAT3 (Tyr705) relative to total STAT3 in iWAT and m.qu. VINCULIN and Coomassie stain were used as loading controls. Data are presented as means + SD. Significance was determined by one‐way ANOVA (*P ≤ 0.05, **P ≤ 0.01, ***P ≤ 0.001, ****P ≤ 0.0001).

References

    1. Baracos VE, Martin L, Korc M, Guttridge DC, Fearon KCH. Cancer‐associated cachexia. Nat Rev Dis Primers 2018;4:17105. - PubMed
    1. Rohm M, Zeigerer A, Machado J, Herzig S. Energy metabolism in cachexia. EMBO Rep 2019;1–13. - PMC - PubMed
    1. Mueller TC, Bachmann J, Prokopchuk O, Friess H, Martignoni ME. Molecular pathways leading to loss of skeletal muscle mass in cancer cachexia ‐ can findings from animal models be translated to humans? BMC Cancer 2016;16:1–14. - PMC - PubMed
    1. Tisdale MJ. Adipose Tissue Cachexia. In Adipose Tissue in Health and Disease. Weinheim, Germany: Wiley‐VCH Verlag GmbH & Co. KGaA; 2010. p 333–345.
    1. Kir S, White JP, Kleiner S, Kazak L, Cohen P, Baracos VE, et al. Tumour‐derived PTH‐related protein triggers adipose tissue browning and cancer cachexia. Nature 2014;513:100–104. - PMC - PubMed

Publication types