

Integrating genome-wide polygenic risk scores and non-genetic risk to predict colorectal cancer diagnosis using UK Biobank data: population based cohort study
- PMID: 36351667
- PMCID: PMC9644277
- DOI: 10.1136/bmj-2022-071707
Integrating genome-wide polygenic risk scores and non-genetic risk to predict colorectal cancer diagnosis using UK Biobank data: population based cohort study
Abstract
Objective: To evaluate the benefit of combining polygenic risk scores with the QCancer-10 (colorectal cancer) prediction model for non-genetic risk to identify people at highest risk of colorectal cancer.
Design: Population based cohort study.
Setting: Data from the UK Biobank study, collected between March 2006 and July 2010.
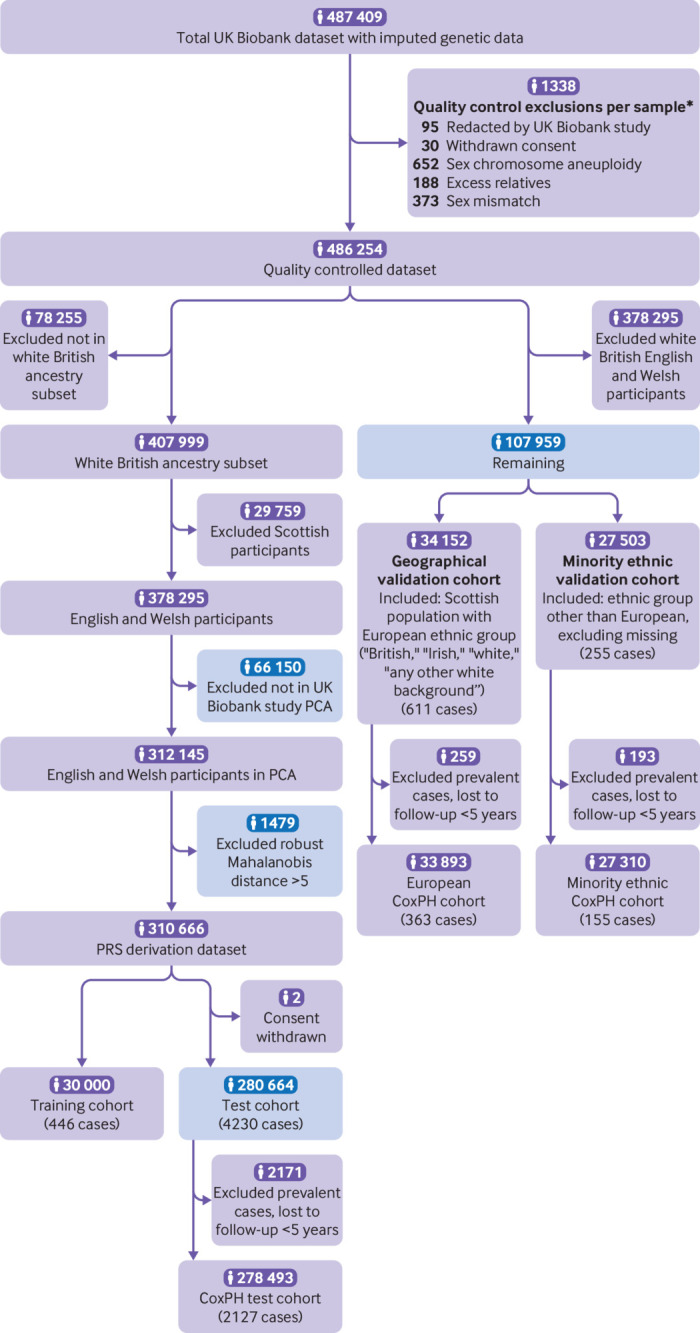
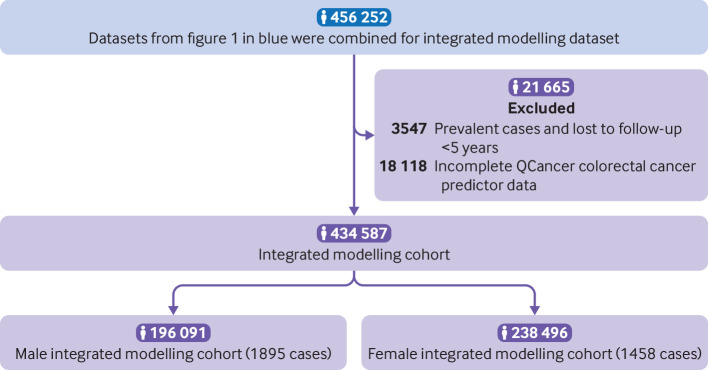
Participants: 434 587 individuals with complete data for genetics and QCancer-10 predictions were included in the QCancer-10 plus polygenic risk score modelling and validation cohorts.
Main outcome measures: Prediction of colorectal cancer diagnosis by genetic, non-genetic, and combined risk models. Using data from UK Biobank, six different polygenic risk scores for colorectal cancer were developed using LDpred2 polygenic risk score software, clumping, and thresholding approaches, and a model based on genome-wide significant polymorphisms. The top performing genome-wide polygenic risk score and the score containing genome-wide significant polymorphisms were combined with QCancer-10 and performance was compared with QCancer-10 alone. Case-control (logistic regression) and time-to-event (Cox proportional hazards) analyses were used to evaluate risk model performance in men and women.
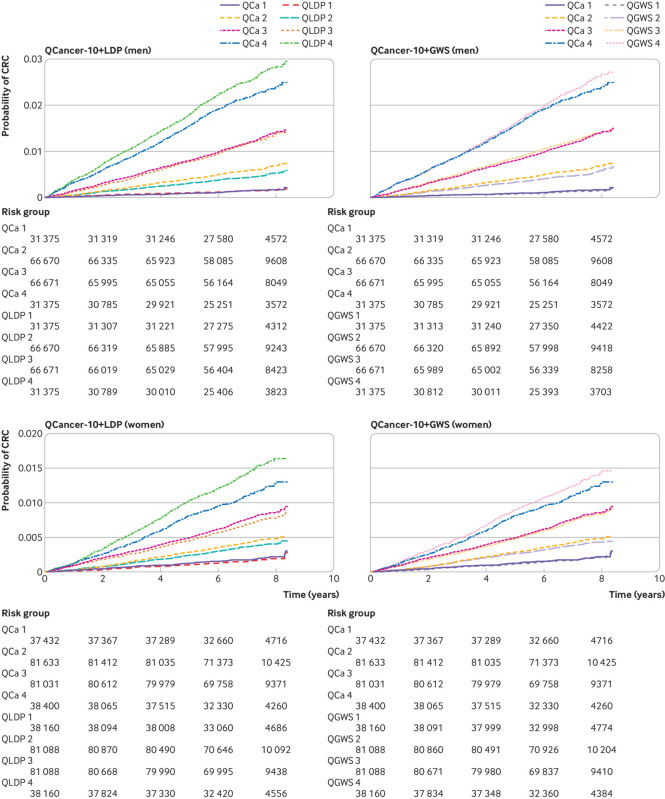
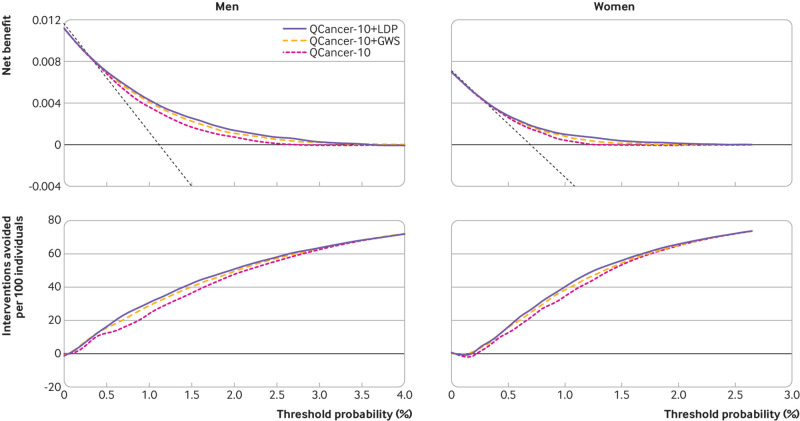
Results: Polygenic risk scores derived using the LDpred2 program performed best, with an odds ratio per standard deviation of 1.584 (95% confidence interval 1.536 to 1.633), and top age and sex adjusted C statistic of 0.733 (95% confidence interval 0.710 to 0.753) in logistic regression models in the validation cohort. Integrated QCancer-10 plus polygenic risk score models out-performed QCancer-10 alone. In men, the integrated LDpred2 model produced a C statistic of 0.730 (0.720 to 0.741) and explained variation of 28.2% (26.3 to 30.1), compared with 0.693 (0.682 to 0.704) and 21.0% (18.9 to 23.1) for QCancer-10 alone. In women, the C statistic for the integrated LDpred2 model was 0.687 (0.673 to 0.702) and explained variation was 21.0% (18.7 to 23.7), compared with 0.645 (0.631 to 0.659) and 12.4% (10.3 to 14.6) for QCancer-10 alone. In the top 20% of individuals at highest absolute risk, the sensitivity and specificity of the integrated LDpred2 models for predicting colorectal cancer diagnosis was 47.8% and 80.3% respectively in men, and 42.7% and 80.1% respectively in women, with increases in absolute risk in the top 5% of risk in men of 3.47-fold and in women of 2.77-fold compared with the median. Illustrative decision curve analysis indicated a small incremental improvement in net benefit with QCancer-10 plus polygenic risk score models compared with QCancer-10 alone.
Conclusions: Integrating polygenic risk scores with QCancer-10 modestly improves risk prediction over use of QCancer-10 alone. Given that QCancer-10 data can be obtained relatively easily from health records, use of polygenic risk score in risk stratified population screening for colorectal cancer currently has no clear justification. The added benefit, cost effectiveness, and acceptability of polygenic risk scores should be carefully evaluated in a real life screening setting before implementation in the general population.
© Author(s) (or their employer(s)) 2019. Re-use permitted under CC BY. No commercial re-use. See rights and permissions. Published by BMJ.
Conflict of interest statement
Competing interests: All authors have completed the ICMJE uniform disclosure form at www.icmje.org/disclosure-of-interest/ and declare: no support from any organisation for the submitted work other than those listed above; JH-C led the development of the QCancer-10 algorithm. JH-C is founder and shareholder of ClinRisk Ltd which supplies free open-source software for research purposes and also licenses other closed source software for a fee to implement risk prediction tools into NHS computer systems outside the submitted work and was its medical director until June 2019, JH-C is director of the QResearch database—a not-for-profit collaboration between University of Oxford and EMIS (commercial supplier of NHS computer systems), and is an adviser to the CMO in England on cancer screening; JEE has served on clinical advisory boards for Lumendi, Boston Scientific, and Paion, has served on the clinical advisory board and owns share options in Satisfai Health, reports speaker fees from Falk, Janssen and Medtronic, and serves on the ACPGBI/BSG guideline group for implementation faecal immunochemical testing for the detection of colorectal cancer in patients with symptoms suspicious of colorectal cancer.
Figures
References
MeSH terms
Grants and funding
LinkOut - more resources
Full Text Sources
Other Literature Sources
Medical