. 2022 Nov;10(6):e002948.
doi: 10.1136/bmjdrc-2022-002948.

Pregnancy induces pancreatic insulin secretion in women with long-standing type 1 diabetes

Affiliations

Pregnancy induces pancreatic insulin secretion in women with long-standing type 1 diabetes

Daniel Espes et al. BMJ Open Diabetes Res Care. 2022 Nov.

Abstract

Introduction: Pregnancy entails both pancreatic adaptations with increasing β-cell mass and immunological alterations in healthy women. In this study, we have examined the effects of pregnancy on β-cell function and immunological processes in long-standing type 1 diabetes (L-T1D).

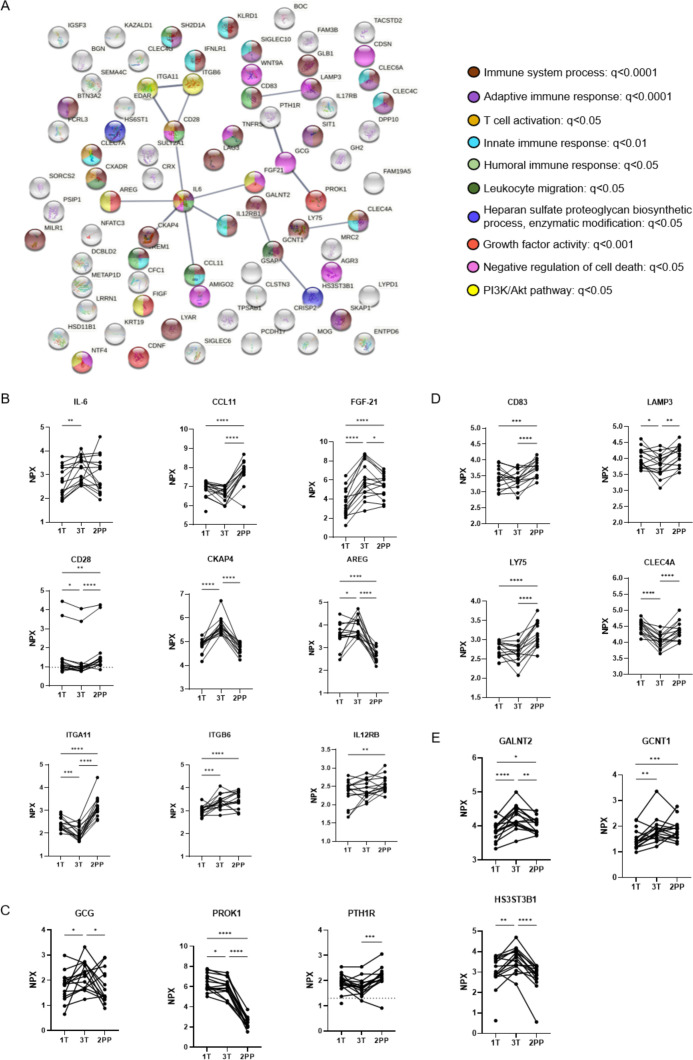
Research design and methods: Fasting and stimulated C-peptide were measured after an oral glucose tolerance test in pregnant women with L-T1D (n=17) during the first trimester, third trimester, and 5-8 weeks post partum. Two 92-plex Olink panels were used to measure proteins in plasma. Non-pregnant women with L-T1D (n=30) were included for comparison.

Results: Fasting C-peptide was detected to a higher degree in women with L-T1D during gestation and after parturition (first trimester: 64.7%, third trimester: 76.5%, and post partum: 64.7% vs 26.7% in non-pregnant women). Also, total insulin secretion and peak C-peptide increased during pregnancy. The plasma protein levels in pregnant women with L-T1D was dynamic, but few analytes were functionally related. Specifically, peripheral levels of prolactin (PRL), prokineticin (PROK)-1, and glucagon (GCG) were elevated during gestation whereas levels of proteins related to leukocyte migration (CCL11), T cell activation (CD28), and antigen presentation (such as CD83) were reduced.

Conclusions: In summary, we have found that some C-peptide secretion, that is, an indirect measurement of endogenous insulin production, is regained in women with L-T1D during pregnancy, which might be attributed to elevated peripheral levels of PRL, PROK-1, or GCG.

Keywords: C-peptide; diabetes mellitus, type 1; immunomodulation; pregnancy.


Conflict of interest statement

Competing interests: None declared.

Figures

Figure 1
Figure 1
Fasting and glucose-induced C-peptide levels in pregnant women with diabetes. Peripheral venous blood was collected from pregnant individuals with long-standing type 1 diabetes (L-T1D, n=17) during three visits: first trimester (1T), third trimester (3T), and 2 months post partum (2PP). For comparison, plasma samples from non-pregnant women with L-T1D (NP, n=30) were used. A reduced oral glucose tolerance test (OGTT) was performed to assess the effect of pregnancy on glucose-induced insulin secretion. C-peptide in plasma samples obtained during fasting and the OGTT was measured by an ultrasensitive ELISA. (A) The number of individuals with non-detectable (ND) and detectable (D) fasting C-peptide was calculated. A χ2 test was applied to compare frequencies for both outcomes in each group. (B) The absolute concentration of fasting C-peptide was estimated between the NP group and pregnant women with L-T1D. Data were transformed to 10-logarithmic values. Dots and lines represent individual samples and median values, respectively. Two-sided Mann-Whitney U test was applied for statistical analyses between each visit and the NP group. Longitudinal changes in (C) absolute fasting C-peptide concentrations, (D) total C-peptide secretion, and (E) peak C-peptide concentrations during OGTT are shown in 10-logarithmic values. Differences between peak and fasting C-peptide values during OGTT are visualized as (F) absolute change and (G) percental change. Calculations were made on non-transformed data. Fasting C-peptide was set to 100% to calculate percental change during OGTT (dashed line). Graphs show median values and 95% CIs for each visit. Non-parametric Friedman test with uncorrected Dunn’s test for familywise α-threshold was applied for statistical analysis. *P<0.05, **p<0.01, ***p<0.001. AUC, area under the curve.
Figure 2
Figure 2
Network analysis of divergent proteins between pregnant and non-pregnant women with diabetes. Peripheral venous blood was collected from women with long-standing type 1 diabetes (L-T1D) at two visits during pregnancy: first trimester (1T, n=16) and third trimester (3T, n=15). For comparison, plasma samples from non-pregnant women with L-T1D (NP, n=30) were used. Proximity extension assay was employed to measure 184 analytes in plasma. A network analysis was performed to assess functional and physical interactions between 49 diverging proteins (16 proteins for 1T vs NP, 47 proteins for 3T vs NP). (A) Nodes corresponding to 49 proteins (abbreviated names) were formed, and 11 edges (black lines) were identified in the network. This network had a PPI enrichment p value <0.001 and an average local clustering coefficient=0.265. Edge thickness indicates the confidence level of each interaction: high (0.700) and maximum (0.900) scores. Filled nodes represent proteins with a known or predicted three-dimensional structure. Functional enrichments within the network were computed, where colors represent annotations that could describe nodes connected by edges. Connected nodes were classified based on enrichments in the network and protein database explorations: (B) interleukin (IL)-6 governed pathways, (C) endocrine modification, (D) antigen processing, (E) diabetic complications, (F) and enzyme activity. Protein levels in plasma are shown as Normalized Protein eXpression (NPX) that is an arbitrary unit expressed on the log2-scale. Analytes that were detected below their lower limits of detection are indicated with dashed lines ([beta-galactosidase [GLB1]: 1.6 NPX, ARSB: −0.009 NPX). Dots represent individual samples and filled lines indicate mean values for the groups. Two-sided unpaired Welch’s t-test with adjustment for multiple testing was applied for statistical analysis, *q<0.05, **q<0.01, ***q<0.001, and ****q<0.0001. AREG, amphiregulin; CKAP4, cytoskeleton-associated protein; CLEC, C-type lectin; GCG, glucagon; PROK, prokineticin.
Figure 3
Figure 3
Network analysis of divergent proteins in pregnant women with diabetes. Plasma samples were obtained from pregnant women with long-standing type 1 diabetes (L-T1D) during three visits: first trimester (1T, n=16), third trimester (3T, n=15), and 2 months post partum (2PP, n=15). Proximity extension assay was employed to measure 184 analytes in plasma. A network analysis was performed to assess functional and physical interactions between 79 diverging proteins. (A) Nodes corresponding to all 79 proteins (abbreviated names) were formed, and 15 edges (black lines) were identified in the network. This network had a PPI enrichment p value <0.001 and an average local clustering coefficient=0.194. Edge thickness indicates the confidence level of each interaction: high (0.700) and maximum (0.900) scores. Filled nodes represent proteins with a known or predicted three-dimensional structure. Functional enrichments within the network were computed, where colors represent annotations that could describe nodes connected by edges. Connected nodes were classified based on enrichments in the network and protein database explorations: (B) IL-6 governed pathways, (C) endocrine modification, (D) antigen presentation pathway, (E) and enzyme activity. Protein levels in plasma are shown as Normalized Protein eXpression (NPX) that is an arbitrary unit expressed on the log2-scale. Analytes that were detected below their lower limits of detection are indicated with dashed lines (CD28: 0.98 NPX, PTH1R: 1.3 NPX). Dots and lines represent individual samples and repeated measures at the specified visits, respectively. A linear mixed effects model with maximum likelihood approach was chosen for parameter estimation. Visits and individuals constituted fixed and random effects, respectively. An unstructured covariance matrix was assumed. False discovery rate by the Benjamini-Hochberg method was applied for correction of multiple testing in the model, *q<0.05, **q<0.01, ***q<0.001, and ****q<0.0001. AREG, amphiregulin; CKAP4, cytoskeleton-associated protein; CLEC, C-type lectin; GCG, glucagon; PROK, prokineticin.

References

    1. Catalano PM, Tyzbir ED, Roman NM, et al. . Longitudinal changes in insulin release and insulin resistance in nonobese pregnant women. Am J Obstet Gynecol 1991;165:1667–72. 10.1016/0002-9378(91)90012-G - DOI - PubMed
    1. Powe CE, Huston Presley LP, Locascio JJ, et al. . Augmented insulin secretory response in early pregnancy. Diabetologia 2019;62:1445–52. 10.1007/s00125-019-4881-6 - DOI - PMC - PubMed
    1. Van Assche FA, Aerts L, De Prins F. A morphological study of the endocrine pancreas in human pregnancy. Br J Obstet Gynaecol 1978;85:818–20. 10.1111/j.1471-0528.1978.tb15835.x - DOI - PubMed
    1. Butler AE, Cao-Minh L, Galasso R, et al. . Adaptive changes in pancreatic beta cell fractional area and beta cell turnover in human pregnancy. Diabetologia 2010;53:2167–76. 10.1007/s00125-010-1809-6 - DOI - PMC - PubMed
    1. Nadal A, Alonso-Magdalena P, Soriano S, et al. . The role of oestrogens in the adaptation of islets to insulin resistance. J Physiol 2009;587:5031–7. 10.1113/jphysiol.2009.177188 - DOI - PMC - PubMed

Publication types