. 2023 Feb 1;34(2):241-257.
doi: 10.1681/ASN.2022040491. Epub 2022 Nov 9.

The Role of Platelet-Derived Growth Factor in Focal Segmental Glomerulosclerosis

Affiliations

The Role of Platelet-Derived Growth Factor in Focal Segmental Glomerulosclerosis

Ting Jia et al. J Am Soc Nephrol. .

Abstract

Background: FSGS is the final common pathway to nephron loss in most forms of severe or progressive glomerular injury. Although podocyte injury initiates FSGS, parietal epithelial cells (PECs) are the main effectors. Because PDGF takes part in fibrotic processes, we hypothesized that the ligand PDGF-B and its receptor PDGFR- β participate in the origin and progression of FSGS.

Methods: We challenged Thy1.1 transgenic mice, which express Thy1.1 in the podocytes, with anti-Thy1.1 antibody to study the progression of FSGS. We investigated the role of PDGF in FSGS using challenged Thy1.1 mice, 5/6 nephrectomized mice, Col4 -/- (Alport) mice, patient kidney biopsies, and primary murine PECs, and challenged Thy1.1 mice treated with neutralizing anti-PDGF-B antibody therapy.

Results: The unchallenged Thy1.1 mice developed only mild spontaneous FSGS, whereas challenged mice developed progressive FSGS accompanied by a decline in kidney function. PEC activation, proliferation, and profibrotic phenotypic switch drove the FSGS. During disease, PDGF-B was upregulated in podocytes, whereas PDGFR- β was upregulated in PECs from both mice and patients with FSGS. Short- and long-term treatment with PDGF-B neutralizing antibody improved kidney function and reduced FSGS, PEC proliferation, and profibrotic activation. In vitro , stimulation of primary murine PECs with PDGF-B recapitulated in vivo findings with PEC activation and proliferation, which was inhibited by PDGF-B antibody or imatinib.

Conclusion: PDGF-B-PDGFR- β molecular crosstalk between podocytes and PECs drives glomerulosclerosis and the progression of FSGS.

Podcast: This article contains a podcast at.


Conflict of interest statement

P. Boor reports consultancy fees from Bristol Myers Squibb. J. Floege reports consultancy fees and honoraria from Amgen, AstraZeneca, Bayer, Boehringer Ingelheim, Calliditas, Chinook, Novo Nordisk, Novartis, Omeros, Travere, Vifor, and Visterra; reports advisory or leadership role with Calliditas, Omeros, and Travere; and is on the speakers bureau for Amgen, AstraZeneca, Novartis, and Vifor. All remaining authors have nothing to disclose.

Figures

None
Graphical abstract
Figure 1
Figure 1
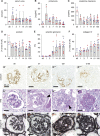
Decline of kidney function and glomerulosclerosis during Thy1.1 FSGS time course. Female and male mice were injected with anti-Thy1.1 antibody and euthanized on days 0 (n=4), 1 (n=6), 3 (n=6), 7 (n=6), 14 (n=6), 21 (n=6), and 100 (n=10). There was no urine for three male mice at day 1. Kidney function was decreased after one dose of anti-Thy1.1 antibody shown by increased serum urine (A), increased 24-hour proteinuria (B), and decreased creatinine clearance (C). Podocytes were damaged after injection of anti-Thy1.1 antibody and podocin expression in tuft was significantly decreased during FSGS (D). (D′–D′′′′) Representative pictures from immunohistochemistry staining for podocin. (E) Segmentally and globally sclerotic glomeruli were significantly increased. Representative pictures showing a normal glomerulus at day 0 (E′) and PEC proliferation on day 7 (E′′, arrow) which led to formation of segmental scars (E′′′, arrow) and global glomerulosclerosis (E′′′′). (F) Collagen IV deposition in the glomerular tuft was significantly upregulated during the disease. (F′–F′′′′) Representative pictures for collagen IV staining during the time course. Scale bars represent 20 µm. *P<0.05, **P<0.01, $P<0.001, #P<0.0001, versus day 0. Red dots indicate female mice; blue dots indicate male mice.
Figure 2
Figure 2
PECs were activated, migrated, and proliferated and exhibited a phenotypic change during Thy1.1 FSGS time course. During the time course CD44 expression per glomerulus was significantly increased (A). The immunohistochemistry staining showed no expression of CD44 protein in PECs in control mice, whereas PECs were activated and migrated to tuft from day 7 until later time points (A′–A′′′′, arrows). (B) Ki67-positive PECs significantly increased at day 3 and day 7. (B–B′′′′) There was almost no proliferation of PECs at day 0, whereas during the disease proliferation of PECs (arrows) occurred. (C and D) Glomeruli with α-SMA and PDGFR-β expression in Bowman’s space were significantly increased during FSGS. (C′–C′′′′ and D′–D′′′′) Immunohistochemistry pictures for α-SMA and PDGFR-β showing upregulated proteins in Bowman’s space (arrows). Scale bars represent 20 µm. *P<0.05, **P<0.01, #P<0.0001, versus day 0. Red dots indicate female mice, blue dots indicate male mice.
Figure 3
Figure 3
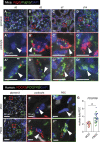
Upregulation of Pdgfb in podocytes and Pdgfrb in PECs in Thy1.1 mice and human FSGS. FISH pictures of glomeruli for Pdgfb (red) and Pdgfrb (green) for the time course (n=3 in each group) (A–D). Pdgfb in podocytes was upregulated after podocyte injury (A′–D′, arrows) and Pdgfrb was upregulated on PECs (A′′–D′′, arrows) during the disease. Biopsies from MCD patients (n=3) and secondary FSGS patients (n=4) were analyzed for expression of PDGFB (red) and PDGFRB (green) by FISH (E and F). In the slides from MCD patients very limited expression of PDGFB in podocytes (E and E′, arrow) and PDGFRB in PECs (E and E′′, arrow) was observed. In FSGS they were both upregulated in podocytes or in PECs, respectively (F–F′′, arrows). (G) Quantification of PDGFRB mRNA nuclear dots in PECs was significantly increased in FSGS patients compared with MCD patients, and dots of the same color represents the same patients. Scale bars represent 10 and 20 µm (mouse) or 10 and 50 µm (human), respectively. #P<0.0001, MCD versus FSGS.
Figure 4
Figure 4
Upregulation of Pdgfb in podocytes and Pdgfrb in PECs in 5/6Nx mice. Three male mice were used as sham control and five male mice underwent 5/6Nx. (A–A′′) The number of sclerotic glomeruli was significantly higher in the 5/6Nx group compared with the sham group. (B–B′′) The number of glomeruli with CD44-positive staining in PECs was significantly increased in 5/6Nx mice. (C–C′′) Expression of collagen IV in Bowman’s space was enhanced in the 5/6Nx group and the number of glomeruli with collagen IV deposition in Bowman’s space was significantly increased in comparison to the sham group. (D–D′′) The number of glomeruli with PDGFR-β in Bowman’s space was also increased in the 5/6Nx group. (E) Nuclear dots of Pdgfb mRNA (red) per podocyte was significantly increased in the 5/6Nx group in comparison with controls. (F) The mRNA expression of Pdgfrb (green) in PECs was also increased by trend in the 5/6Nx group. There was only low mRNA expression of Pdgfb (G and G′, arrow) in podocytes and Pdgfrb (G and G′′, arrow) in PECs in the control group. (H–H′′′) The mRNA expression of Pdgfb in podocytes (arrow) and Pdgfrb in PECs (arrow) was increased in 5/6Nx mice. Scale bars represent 10 or 20 µm. *P<0.05, **P<0.01, $P<0.001, sham group versus 5/6Nx group. Red dots indicate female mice. BM, Bowman’s.
Figure 5
Figure 5
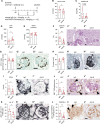
Effects of anti–PDGF-B antibody therapy in Thy1.1 mice on day 7. Female mice were injected with anti–PDGF-B antibody (“Anti-B”) or IgG control (“IgG”) after one dose of anti-Thy1.1 antibody (A). Serum urea was significantly reduced (B). (C) Proteinuria was slightly reduced but could not obtain significance (P=0.062). (D) Kidney function was improved revealed by creatinine clearance. (E) Systolic blood pressure did not show any difference between the two groups. (F–F′′) The number of sclerotic glomeruli was decreased in the anti–PDGF-B group. (G–G′′) The number of WT-1–positive cells did not differ between the two groups, whereas podocin expression in the tuft tended to be increased (H–H′′). PEC activation (I–I′′) and proliferation (J–J′′) were significantly reduced by the short time administration of anti–PDGF-B antibody. Collagen IV in Bowman’s space was decreased (K–K′′). (L–L′′) The number of glomeruli with PDGFR-β in Bowman’s space was also reduced after treating the mice with anti–PDGF-B antibody. Arrows point to the PECs or Bowman’s space. Scale bars represent 20 or 50 µm. *P<0.05, **P<0.01, anti-B versus IgG. Red dots indicate female mice. BM, Bowman’s.
Figure 6
Figure 6
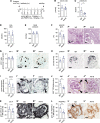
Effects of anti–PDGF-B antibody therapy in Thy1.1 mice on day 21. Male mice were injected with anti–PDGF-B antibody (“Anti-B”) or IgG control (“IgG”) until day 21 (A). No differences in serum urea were detected between the two groups (B). Proteinuria was reduced (C), whereas no differences in creatinine clearance (D) and blood pressure (E) were detected after 21 days’ of treatment with anti–PDGF-B antibody. Glomerular sclerosis was significantly reduced (F) as shown in the PAS staining (F′ and F′′). (G–G′′) The number of WT-1–positive cells in tuft did not differ between the two groups. (H–H′′) Quantification and representative images showed no differences in podocin expression. CD44 expression (I) or Ki67+ PECs per glomeruli (J) were significantly decreased, accompanied by the reduced number of glomeruli with collagen IV (K) and PDGFR-β (L) in Bowman’s space after 21 days of anti–PDGF-B antibody therapy. (I′–L′ and I′′–L′′) Representative pictures for staining of CD44, Ki67+PAS, collagen IV, and PDGFR-β, respectively. Arrows point to the PECs or Bowman’s space. Scale bars represent 20 or 50 µm. *P<0.05, ** P<0.01, $P<0.001, anti-B versus IgG. Blue dots indicate female mice. BM, Bowman’s.
Figure 7
Figure 7
PDGF-B induced PEC activation and proliferation in vitro. Primary mouse PECs were stimulated with PDGF-B for 6 or 24 hours. The expression of the PEC marker Cldn1 (A) was downregulated and the activation marker Cd44 (B) was upregulated. (C and D) The protein expression level of CD44 was increased after PDGF-B stimulation by Western blot. (E) Bromodeoxyuridine (BrdU) assay showed proliferation of PECs after PDGF-B stimulation that was completely suppressed either by anti–PDGF-B antibody (Anti-B) or imatinib. Unstim. (n = 6), PDGF-B (n = 6). BrdU experiment: Unstim. (n = 24), PDGF-B (n = 32), PDGF-B+Anti–PDGF-B antibody (n = 8), PDGF-B+Imatinib (n = 8). Unstim: unstimulated. *P<0.05, **P<0.01, $P<0.001, #P<0.0001.

References

    1. D’Agati V: The many masks of focal segmental glomerulosclerosis. Kidney Int 46: 1223–1241, 1994. 10.1038/ki.1994.388 - DOI - PubMed
    1. Rennke HG, Klein PS: Pathogenesis and significance of nonprimary focal and segmental glomerulosclerosis. Am J Kidney Dis 13: 443–456, 1989. 10.1016/s0272-6386(89)80001-0 - DOI - PubMed
    1. Siligato R, Cernaro V, Nardi C, De Gregorio F, Gembillo G, Costantino G, et al. : Emerging therapeutic strategies for minimal change disease and focal and segmental glomerulosclerosis. Expert Opin Investig Drugs 27: 839–879, 2018. 10.1080/13543784.2018.1540587 - DOI - PubMed
    1. Rosenberg AZ, Kopp JB: Focal segmental glomerulosclerosis. Clin J Am Soc Nephrol 12: 502–517, 2017. 10.2215/cjn.05960616 - DOI - PMC - PubMed
    1. Nagata M, Horita S, Shu Y, Shibata S, Hattori M, Ito K, et al. : Phenotypic characteristics and cyclin-dependent kinase inhibitors repression in hyperplastic epithelial pathology in idiopathic focal segmental glomerulosclerosis. Lab Invest 80: 869–880, 2000 - PubMed

Publication types

Substances