. 2022 Nov 9;13(1):6784.
doi: 10.1038/s41467-022-34359-6.

An allosteric modulator activates BK channels by perturbing coupling between Ca2+ binding and pore opening

Affiliations

An allosteric modulator activates BK channels by perturbing coupling between Ca2+ binding and pore opening

Guohui Zhang et al. Nat Commun. .

Abstract

BK type Ca2+-activated K+ channels activate in response to both voltage and Ca2+. The membrane-spanning voltage sensor domain (VSD) activation and Ca2+ binding to the cytosolic tail domain (CTD) open the pore across the membrane, but the mechanisms that couple VSD activation and Ca2+ binding to pore opening are not clear. Here we show that a compound, BC5, identified from in silico screening, interacts with the CTD-VSD interface and specifically modulates the Ca2+ dependent activation mechanism. BC5 activates the channel in the absence of Ca2+ binding but Ca2+ binding inhibits BC5 effects. Thus, BC5 perturbs a pathway that couples Ca2+ binding to pore opening to allosterically affect both, which is further supported by atomistic simulations and mutagenesis. The results suggest that the CTD-VSD interaction makes a major contribution to the mechanism of Ca2+ dependent activation and is an important site for allosteric agonists to modulate BK channel activation.


Conflict of interest statement

The authors declare no competing interests.

Figures
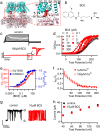
Fig. 1
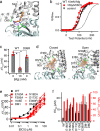
Fig. 1. BC5 effects on BK channels.
a hSlo1 Channel cryo-EM structure (PDB: 6v38) docked with BC5. The membrane spanning region (S0-S6) from one subunit and the N-terminus of the cytosolic tail domain (CTD) from a neighboring subunit are amplified in the inset. The CTD and VSD are colored pink and cyan, respectively. The BC5 is colored in red and represented as molecular surface. b BC5 chemical structure. c Current traces of BK channels (control, black) and with BC5 (100 µM, red) at various testing voltages from −30 to 250 mV with 20 mV increment. The potential before and after testing pulses was −80 mV. Inset: tail currents after the testing pulses. d GV relationship for WT BK channels at various BC5 concentration. Solid lines are fits to the Boltzmann relation. All data were collected from independent patches, n = 3–12. For detailed n for each data point, please see the “Reproducibility” section in “Methods.” e The shifts of GV relationships (red, V1/2: voltage where the GV relation is half maximum) and outward macroscopic current inhibition (blue, IC: control current, IBC5: current in BC5) depend on BC5 concentration, with EC50 of 2.5 ± 0.3 µM and IC50 of 1.1  ±  0.1 µM respectively. n = 3–12, exact n for each data point is shown in the “Reproducibility” section in “Methods.” f Inhibition of the outward macroscopic current by 100 µM BC5 versus voltage in the presence of either 1 µM (filled, n = 3) or 100 µM (hollow, n = 4) free Ca2+. g Representative single-channel current recordings at 100 mV and in 100 µM free Ca2+ as control (left and black) and with 10 µM BC5 (right and red) from an inside out patch in symmetrical 160 mM KCl. O: open; C: closed. h Voltage dependence of single-channel current amplitudes (i-V), n = 3. The data points represent the mean ± SEM for the whole paper.
Fig. 2
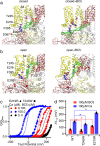
Fig. 2. BC5 interactions with the targeted site at the CTD-VSD interface.
a The cryo-EM structure of hSlo1 (PDB: 6v38) with BC5 docked to its targeted site. A similar region as in Fig. 1a is shown. The VSD and CTD are colored silver and cyan, respectively. Mg2+-binding residues (D99, E374, E399) are represented as green sticks. The Mg2+ position is highlighted using the purple circle, which is hatched to indicate that Mg2+ and BC5 do not bind at the same time. b GV relationship of BK channels and Boltzmann fits (solid lines) in 10 mM Mg2+. n = 3 for control and n = 4 for 100 µM BC5. For comparison, the dashed lines represent the GV relationships of the control (black) and 100 µM BC5 (red) in the absence of Mg2+, taken from Fig. 1d. c GV shifts caused by 100 µM BC5. For WT the GV shifts in 0 (n = 3) and 10 mM (n = 3) Mg2+ are plotted, and for the D99R (n = 4) mutant, GV was measured in 0 Mg2+. *: p =0.0002 and 0.0475 respectively, unpaired Student’s t-test. Data points are shown in solid circles. d Dynamic interactions of BC5 in the binding pocket of metal-free (left) and Ca2+-bound (right) BK channels. Snapshots of BC5 (thin sticks) were extracted from the atomistic simulation trajectories every 10 ns and superimposed onto the last frame of sim 1 and 7 (Supplementary Table 1). As a reference, representative BC5 binding poses (closed: at 180 ns from sim 7; open: at 102 ns from sim 1) are also shown in thick bonds. e GV shifts of mutant BK channels in response to BC5. n = 3–12, exact n for each data point is shown in the “Reproducibility” section in “Methods.” The WT curve is taken from Fig. 1e. f Maximal G-V shift (V1/2max) and EC50 of BC5 for mutations and the WT. DM1: double mutation E180A/N182A; DM2: I105E/E399R. The data were obtained from fittings of the dose response in Fig. 2e using Hill equation. The standard errors of EC50 and V1/2max were estimated directly from the SEMs of the input data and validated by numerical simulations.
Fig. 3
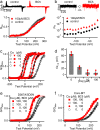
Fig. 3. BC5 perturbs Ca2+-dependent activation.
a Top, gating currents in control and 100 µM BC5. Voltage pulses were from −80 to 300 mV with 20 mV increments. Bottom, Normalized gating charge-voltage (QV) relation of on-gating currents. The smooth lines are fits to the Boltzmann function, n = 14 for control, and n = 7 for BC5. b Top, current traces of a patch containing hundreds of BK channels at −140 mV in control and 100 µM BC5. Only brief unitary channel openings were seen at the negative voltage. O: open; C: closed. Bottom, Open probability (Po) at negative voltages, n = 9 for control, and n = 3 for BC5. c GV relations in various [Ca2+]i (black hollow symbols) and in addition of 100 µM BC5 (red filled symbols). Black solid lines are Boltzmann fits without BC5 while red solid lines are Boltzmann fits with BC5. n = 3 for all conditions. d GV shifts in response to 100 µM BC5 at different [Ca2+]i. Data points are shown in solid circles, all of n = 3. e BC5 effects on the D367A5D5N mutant channel in 0 and 100 µM [Ca2+]i. n = 4 for 0 [Ca2+]i control; n = 5 for 0 [Ca2+]i with 100 µM BC5; n = 4 for 100 µM [Ca2+]i control and n = 3 for 100 µM [Ca2+]i with 100 µM BC5. D367A and 5D5N (D897-901N) ablated the two Ca2+-binding sites in each Slo1 subunit, respectively. GV relations were fit with the Boltzmann function (solid lines). f BC5 effects on the Core-MT BK channel in 0 and 100 µM [Ca2+]i. n = 14 for 0 [Ca2+]i control; n = 9 for 0 [Ca2+]i with 100 µM BC5; n = 3 for 100 µM [Ca2+]i control and n = 6 for 100 µM [Ca2+]i with 100 µM BC5. GV relations were fit with the Boltzmann function (solid lines).
Fig. 4
Fig. 4. BC5 interactions with the allosteric pathway for coupling Ca2+ binding to pore opening.
a, b Optimal and suboptimal pathways coupling Ca2+-binding site D367 and pore lining residue F315. A similar region as in Fig. 1a is shown. The two neighboring subunits forming the VSD-CTD contacts are colored in pink and yellow, respectively. The pathways are represented in green sticks. c GV relationship and Boltzmann fits (solid lines) of the mutant channels E219R (results are shown with triangles) and T245W (results are shown with circles). V1/2 and slope factor (mV): for E219R, 263.7 ± 8.7 and 30.4 ± 6.8 at 0 [Ca2+]i and 0 BC5 (black triangles, n = 5); 147.4 ± 4.7 and 23.6 ± 4.1 at 0 [Ca2+]i and 100 µM BC5 (red triangles, n = 3); and -51.5 ± 4.2 mV and 24.7 ± 3.5 at 100 µM [Ca2+]i and 0 BC5 (blue triangles, n = 6); for T245W, 260.9 ± 6.8 and 21.1 ± 5.3 at 0 [Ca2+]i and 0 BC5 (black circle, n = 6); 213.8 ± 2.9 and 22.1 ± 2.8 W at 0 [Ca2+]i and 100 µM BC5 (red circle, n = 7); and 106.0 ± 3.3 and 21.2 ± 3.1 at 100 µM [Ca2+]i and 0 BC5 (blue circle, n = 3). Dashed lines are taken from Fig. 3c for WT at 0 [Ca2+]i and 0 BC5 (black); at 0 [Ca2+]i and 100 µM BC5 (red); and at 100 µM [Ca2+]i and 0 BC5 (blue). d GV shift caused by 100 µM [Ca2+]i (blue, n = 6 for WT, n = 3 for T245W and n = 6 for E219R) and 100 µM BC5 (red, n = 3 for WT, n = 4 for T245W and n = 3 for E219R). Individual data points are shown in solid circles. Both mutations are significantly different in GV shift caused by 100 µM [Ca2+]i and 100 µM BC5, respectively, compared to WT with P<0.05, one-way Tukey–Kramer ANOVA test was used.

References

    1. Adams PR, Constanti A, Brown DA, Clark RB. Intracellular Ca2+ activates a fast voltage-sensitive K+ current in vertebrate sympathetic neurones. Nature. 1982;296:746–749. - PubMed
    1. Lancaster B, Nicoll RA. Properties of two calcium-activated hyperpolarizations in rat hippocampal neurones. J. Physiol. 1987;389:187–203. - PMC - PubMed
    1. Robitaille R, Garcia ML, Kaczorowski GJ, Charlton MP. Functional colocalization of calcium and calcium-gated potassium channels in control of transmitter release. Neuron. 1993;11:645–655. - PubMed
    1. Davies AG, et al. A central role of the BK potassium channel in behavioral responses to ethanol in C. elegans. Cell. 2003;115:655–666. - PubMed
    1. Brayden JE, Nelson MT. Regulation of arterial tone by activation of calcium-dependent potassium channels. Science. 1992;256:532–535. - PubMed

Publication types

MeSH terms

Substances