. 2022 Nov 9;13(1):6779.
doi: 10.1038/s41467-022-34365-8.

Capture at the ER-mitochondrial contacts licenses IP3 receptors to stimulate local Ca2+ transfer and oxidative metabolism

Affiliations

Capture at the ER-mitochondrial contacts licenses IP3 receptors to stimulate local Ca2+ transfer and oxidative metabolism

Máté Katona et al. Nat Commun. .

Abstract

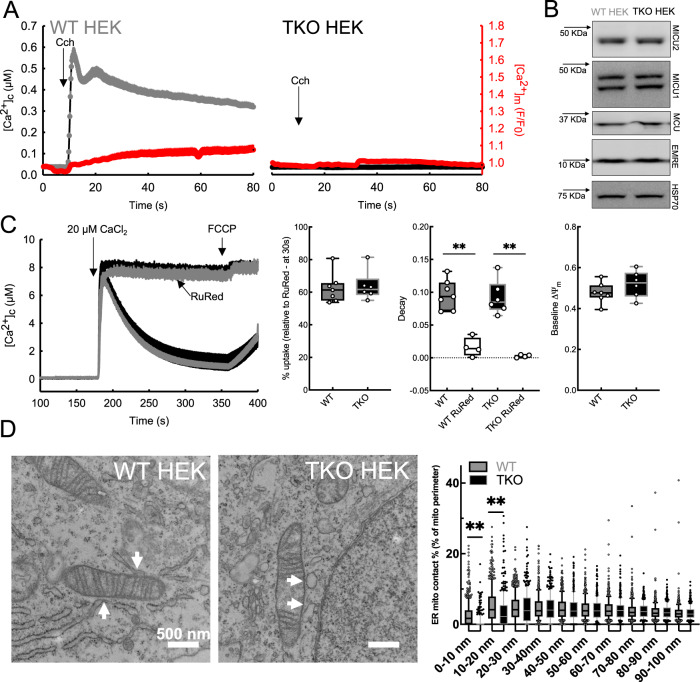
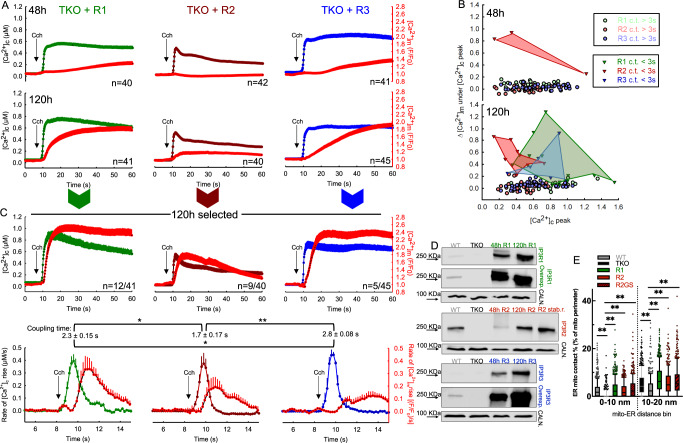
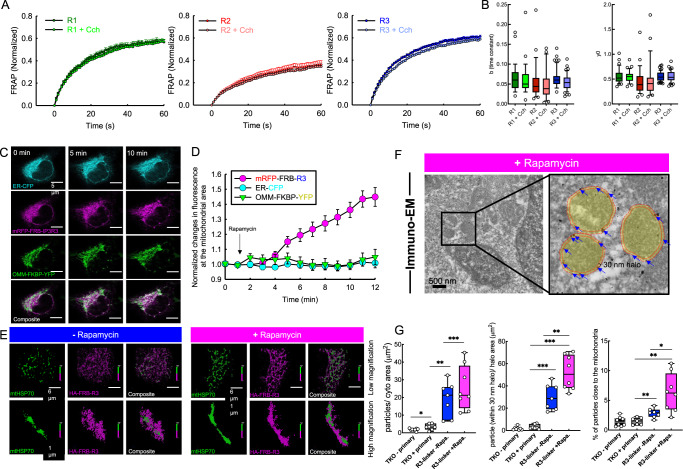
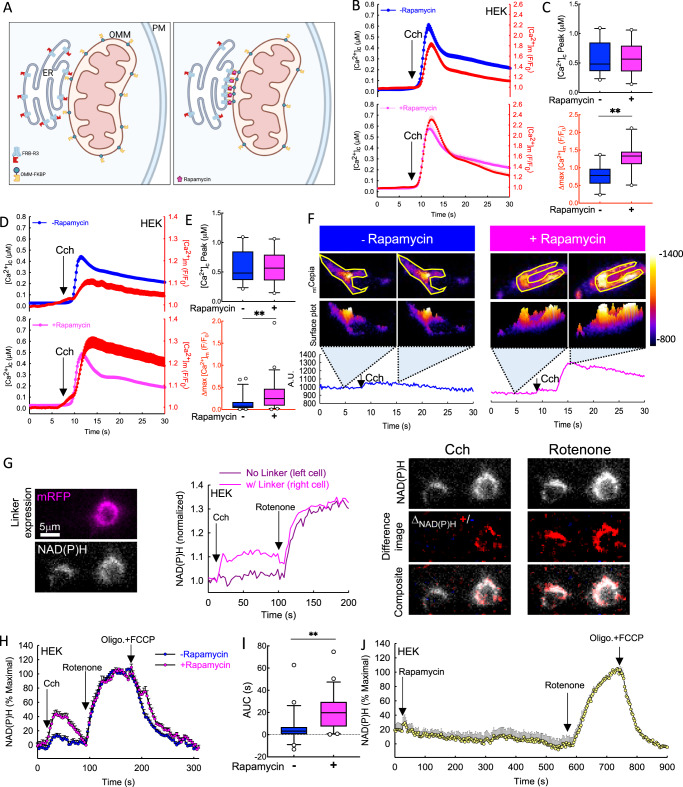
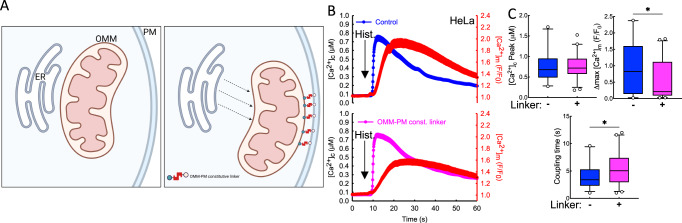
Endoplasmic reticulum-mitochondria contacts (ERMCs) are restructured in response to changes in cell state. While this restructuring has been implicated as a cause or consequence of pathology in numerous systems, the underlying molecular dynamics are poorly understood. Here, we show means to visualize the capture of motile IP3 receptors (IP3Rs) at ERMCs and document the immediate consequences for calcium signaling and metabolism. IP3Rs are of particular interest because their presence provides a scaffold for ERMCs that mediate local calcium signaling, and their function outside of ERMCs depends on their motility. Unexpectedly, in a cell model with little ERMC Ca2+ coupling, IP3Rs captured at mitochondria promptly mediate Ca2+ transfer, stimulating mitochondrial oxidative metabolism. The Ca2+ transfer does not require linkage with a pore-forming protein in the outer mitochondrial membrane. Thus, motile IP3Rs can traffic in and out of ERMCs, and, when 'parked', mediate calcium signal propagation to the mitochondria, creating a dynamic arrangement that supports local communication.


Conflict of interest statement

The authors declare no competing interests.

Figures

Fig. 1
Fig. 1. HEK cells have weak ER-mitochondrial Ca2+ transfer, but tight and IP3R-dependent ERMCs.
A Average [Ca2+]c response of WT (left, gray; n = 25) and TKO (right, black; n = 15) HEK cells to Carbachol (Cch) and the corresponding changes in the [Ca2+]m (red traces). B Immunoblots showing the protein levels of MCU, MICU1, MICU2, and EMRE in WT and TKO HEK lysates. C Mean mitochondrial Ca2+ clearance by permeabilized WT and TKO cells after the addition of 20 μM CaCl2 bolus in the presence of thapsigargin (2 μM) and CGP (20 μM) with or without RuRed treatment. FCCP was added at the end of every run to release the accumulated Ca2+ from the mitochondria. Box plots show the RuRed sensitive Ca2+ uptake, the rate of Ca2+ clearance after the Ca2+ pulse, and the baseline mitochondrial membrane potential. (WT n = 7, TKO n = 6, WT + RuRed, TKO + RuRed n = 4, **p ≦ 0.001, One-way ANOVA, Holm–Sidak method, box plots indicate median, 25th and 75th percentile (box), and 5th and 95th percentile (whiskers) and all datapoints). D Representative TEM images of WT (left) and TKO HEK (right) cells, with white arrows marking ERMCs. Box plots showing the percentage of mitochondrial perimeter within 0–100 nm distance to the ER using 10 nm bins in WT (gray) and TKO HEK (black). (WT n = 455, TKO n = 377 mitochondria from three independent fixation for each; **<0.001 Unpaired t-test, Two-tailed p values, box plots indicate median, 25th and 75th percentile (box), and 10th and 90th percentile (whiskers) as well as outliers (dots)). Source data are provided for each panel as a Source Data file.
Fig. 2
Fig. 2. IP3R overexpression in TKO cells enhanced ER-mitochondrial Ca2+ signaling and restored close ERMCs.
A Mean time courses of the Cch-induced [Ca2+]c responses in R1 (green), R2 (maroon), and R3 (blue) acute 48 h (upper panel) and 120 h (lower panel) rescue in TKO HEK cells. Corresponding changes in the [Ca2+]m are shown as red traces on each graph. B [Ca2+]m at the time of [Ca2+]c peak plotted as a function of the [Ca2+]c peak in 48 h (upper panel) and 120 h (lower panel) rescue. The shaded area highlights the cells showing tight ERMC Ca2+ coupling. C Average [Ca2+]c responses of a selected subpopulation of cells with less than 3 s cyto-mito coupling time after 120 h of expression of IP3R1 (green), R2 (maroon) and R3 (blue) and the corresponding changes in [Ca2+]m (red) (upper panel). Mean traces of the cytosolic and corresponding mitochondrial rates of Ca2+ rise in the selected 120 h acute rescue TKO cells, and the calculated average coupling time for each condition (±SEM, One-way ANOVA, normality test (Shapiro–Wilk), all pairwise multiple comparison procedures (Holm–Sidak method)). D Immunoblot showing the IP3R expression in WT HEK, TKO HEK, and IP3R acute rescue TKO cells for 48 and 120 h and TKO HEK cells stably rescued with R2. E Box plots showing the percentage of close, 0–10 and 10–20 nm contacts in WT (gray; n = 455 mitochondria/3 independent fixation), TKO (black; n = 377/3) and TKO HEK stably expressing R1 (green; n = 464/3), R2 (maroon; n = 383/3) and pore mutant R2GS3 (shaded maroon; n = 411/3) (**p < 0.001; Unpaired t-test; Two-tailed p value, box plots indicate median, 25th and 75th percentile (box), and 10th and 90th percentile (whiskers) as well as outliers (dots)). Source data are provided for each panel as a Source Data file.
Fig. 3
Fig. 3. Lateral mobility of IP3Rs allows their trapping at ERMCs.
A Average time courses showing IP3R-mRFP fluorescence recovery after photobleaching normalized to the pre-bleach intensity in unstimulated R1 (green), R2 (maroon), and R3 (blue) and Cch stimulated R1 (light green), R2 (light red) and R3 (light blue) acute TKO rescue cells (datapoints represent averages with ±SEM, (R1 n = 32, R1 + Cch n = 37, R2 n = 37, R2 + Cch n = 23, R3 n = 55, R3 + Cch n = 43 from three experiments). B Calculated time constant and recovery (y0) for each IP3R isoform with and without agonist stimulation (R1 n = 32, R1 + Cch n = 37, R2 n = 25, R2 + Cch n = 23, R3 n = 55, R3 + Cch n = 43 from three experiments; Unpaired t-test; Two-tailed p value; b: R1 vs R1 + Cch p = 0.4819, R2 vs R2 + Cch p = 0.4494, R3 vs R3 + Cch p = 0.0585; y0: R1 vs R1 + Cch p = 0.7404, R2 vs R2 + Cch p = 0.7596, R3 vs R3 + Cch p = 0.9114, Box plots indicate median, 25th and 75th percentile (box), and 5th and 95th percentile (whiskers) and outliers (single points). C Representative images showing the R3-mRFP (magenta), ER-CFP (cyan), and OMM-YFP (YFP) signals before and after (5 and 10 min) the addition of rapamycin. D R3-mRFP-FRB (magenta circles) and ER-CFP (cyan circles) co-localization over time with FKBP-YFP-OMM (green triangles), presented by changes in mRFP and CFP fluorescence under the YFP mask over time. (n = 10 cells from three experiments; datapoints represent averages with ±SEM). E STORM super-resolution images showing the R3-OMM positioning without (before) and with (after) rapamycin treatment. F Representative Immuno-EM image of a rapamycin-treated, R3-linker-expressing cell and a magnified field with highlighted mitochondria (yellow). The 30 nm halo area is between the solid and dashed red lines. Individual gold particles within the halo area are marked with blue arrows. G Quantification of the ImmunoGold labeling in non-transfected no primary (black; n = 8), non-transfected plus primary (dark gray; n = 7), IP3R3-linker without rapamycin (blue; n = 7) and R3-linker with rapamycin treatment (magenta; n = 8) (Images were processed from from three independent fixation, Statistical probe: Unpaired t-test; Two-tailed p values, particles/cyto area: TKO - primary vs TKO + primary p = 0.0396, R3-linker -Rapa. vs +Rapa. p = 0.369, TKO + primary vs R3-linker -Rapa p = 0.0012, TKO + primary vs R3-linker +Rapa p = 0.0005; particles within 30 nm halo/halo area: TKO - primary vs TKO + primary p = 0.1384, R3-linker -Rapa. vs +Rapa. p = 0.0091, TKO + primary vs R3-linker -Rapa <0.0001, TKO + primary vs R3-linker +Rapa <0.0001; % of particles close to the mitochondria: TKO - primary vs TKO + primary p = 0.9062, R3-linker -Rapa. vs +Rapa. p = 0.0166, TKO + primary vs R3-linker -Rapa p = 0.0031, TKO + primary vs R3-linker +Rapa p = 0.0019* p < 0.05, ** p < 0.01, ***<0.0001 box plots indicate median, 25th and 75th percentile (box), and 10th and 90th percentile (whiskers) and all datapoints)). Source data are provided for panels A, B, D, G as a Source Data file.
Fig. 4
Fig. 4. Effective ER-mitochondrial Ca2+ communication is dependent on IP3R3 localization to the ERMCs.
A Scheme depicting R3-FRB and FKBP-OMM linkage by rapamycin. (Created in BioRender). B Average time courses showing the carbachol-induced changes in the [Ca2+]c and the corresponding changes in [Ca2+]IMS (red traces), without (blue) and with (pink) rapamycin treatment in R3-FRB and FKBP-OMM expressing TKO HEK cells in 0 mM Ca2+ ECM. C Box plots showing the maximal change in [Ca2+]c (upper) and [Ca2+]IMS (lower) for both conditions (−Rapa n = 22, +Rapa n = 18), Unpaired t-test; Two-tailed p value; [Ca2+]c peak p = 0.9818, Δmax[Ca2+]m **p < 0.001). D Mean [Ca2+]c and corresponding [Ca2+]m (red traces) responses to agonist stimulation under the same conditions as described in (E). Maximum [Ca2+]c (upper) and [Ca2+]m (lower) responses to agonist (**p < 0.001, Kruskal–Wallis One-way ANOVA on Ranks, all pairwise multiple comparison procedures (Dunn’s Method); −Rapa n = 47, +Rapa n = 52). F Pseudo-colored representative images showing changes in mtCepia intensity without (blue) and with (magenta) rapamycin treatment before and after agonist stimulation in R3-linker-expressing TKO HEK cells. Representative traces were obtained from the ROIs (yellow) shown in the upper images. G Representative mRFP and NAD(P)H images of a non-transfected and a linker-expressing cell (left). Traces from the same cells showing Cch and rotenone-induced changes in NAD(P)H fluorescence (middle) and different images showing the localization of NAD(P)H changes (right). H Agonist induced changes in the NAD(P)H autofluorescence with and without R3 linkage to the OMM (−Rapa n = 49, +Rapa n = 46). I Calculated the AUC of the Cch-induced NAD(P)H response. J Average traces showing the effect of 100 nM rapamycin treatment on the NAD(P)H level (n = 27). (*p < 0.05, **p < 0.001, Kruskal–Wallis One-way ANOVA on ranks, all pairwise multiple comparison procedures (Dunn’s Method)). All box plots indicate median, 25th and 75th percentile (box) and 5th and 95th percentile (whiskers), and outliers (single points). Source data are provided for panels BE, GJ as a Source Data file.
Fig. 5
Fig. 5. ER-mitochondrial Ca2+ communication is disrupted by relocating mitochondria to the plasma membrane.
A Scheme depicting the disruption of ERMCs by the expression of PM-OMM constitutive linkers in WT HeLa cells. (Created in BioRender) B Average traces showing the effect of PM-OMM constitutive linker expression on ER-mitochondrial Ca2+ transfer after histamine stimulation compared to control cells expressing only OMM-mRFP (PM-OMM n = 44, OMM only n = 36). C Comparison of the peak [Ca2+]c, [Ca2+]m and coupling time of control and PM-OMM constitutive linker-expressing cells (*p < 0.05, Unpaired t-test; Two-tailed p value; [Ca2+]c peak p = 0.8901, Δmax[Ca2+]m p = 0.0294, Coupling time p = 0.0314). All box plots indicate median, 25th and 75th percentile (box), 5th and 95th percentile (whiskers), and outliers (single points). Source data are provided for panels B, C as a Source Data file.

References

    1. Gordaliza-Alaguero I, Canto C, Zorzano A. Metabolic implications of organelle-mitochondria communication. EMBO Rep. 2019;20:e47928. doi: 10.15252/embr.201947928. - DOI - PMC - PubMed
    1. Sassano ML, van Vliet AR, Agostinis P. Mitochondria-associated membranes as networking platforms and regulators of cancer cell fate. Front. Oncol. 2017;7:174. doi: 10.3389/fonc.2017.00174. - DOI - PMC - PubMed
    1. Schon EA, Przedborski S. Mitochondria: the next (neurode)generation. Neuron. 2011;70:1033–1053. doi: 10.1016/j.neuron.2011.06.003. - DOI - PMC - PubMed
    1. Area-Gomez E, et al. A key role for MAM in mediating mitochondrial dysfunction in Alzheimer disease. Cell Death Dis. 2018;9:335. doi: 10.1038/s41419-017-0215-0. - DOI - PMC - PubMed
    1. Manfredi G, Kawamata H. Mitochondria and endoplasmic reticulum crosstalk in amyotrophic lateral sclerosis. Neurobiol. Dis. 2016;90:35–42. doi: 10.1016/j.nbd.2015.08.004. - DOI - PMC - PubMed

Publication types

MeSH terms

Substances