. 2022 Nov 9;13(1):6782.
doi: 10.1038/s41467-022-34079-x.

Reversible Myc hypomorphism identifies a key Myc-dependency in early cancer evolution

Affiliations

Reversible Myc hypomorphism identifies a key Myc-dependency in early cancer evolution

Nicole M Sodir et al. Nat Commun. .

Abstract

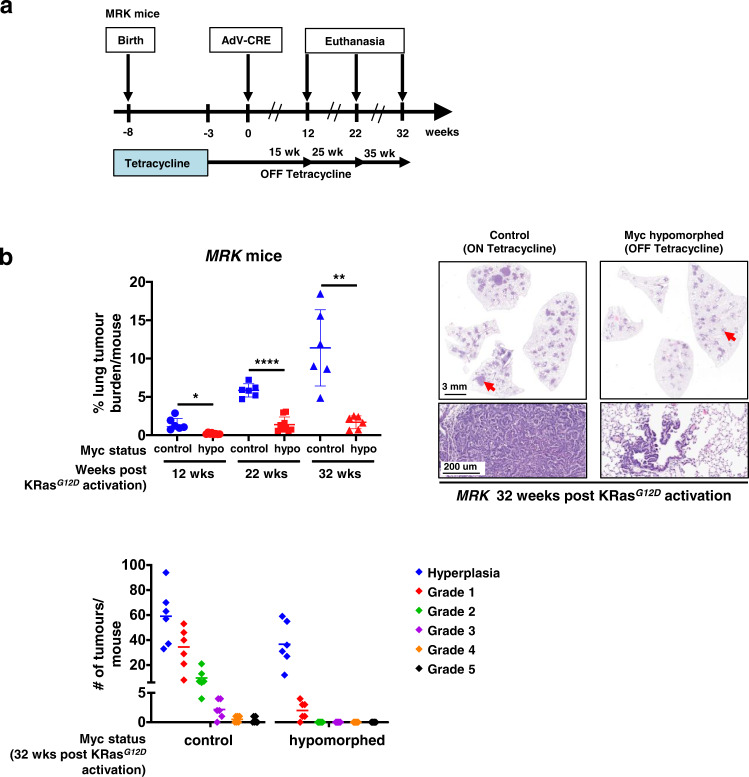
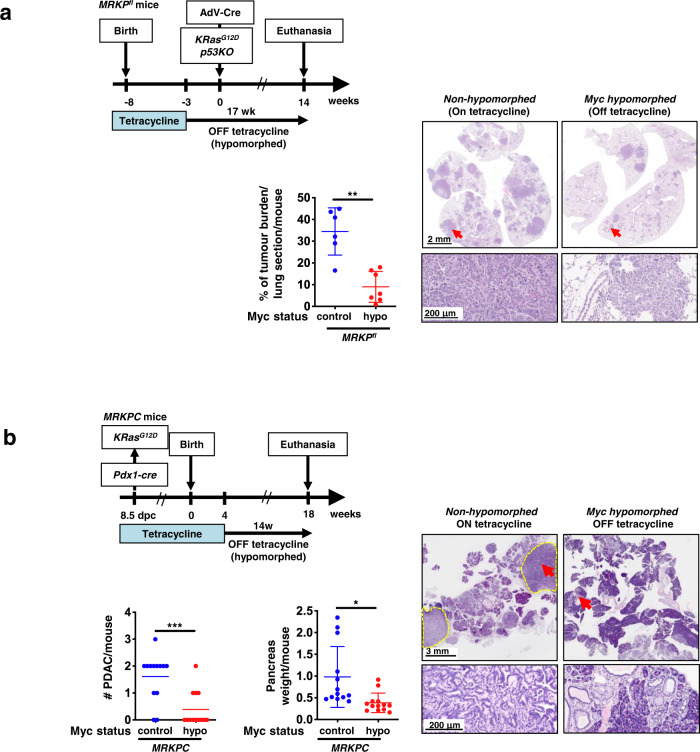
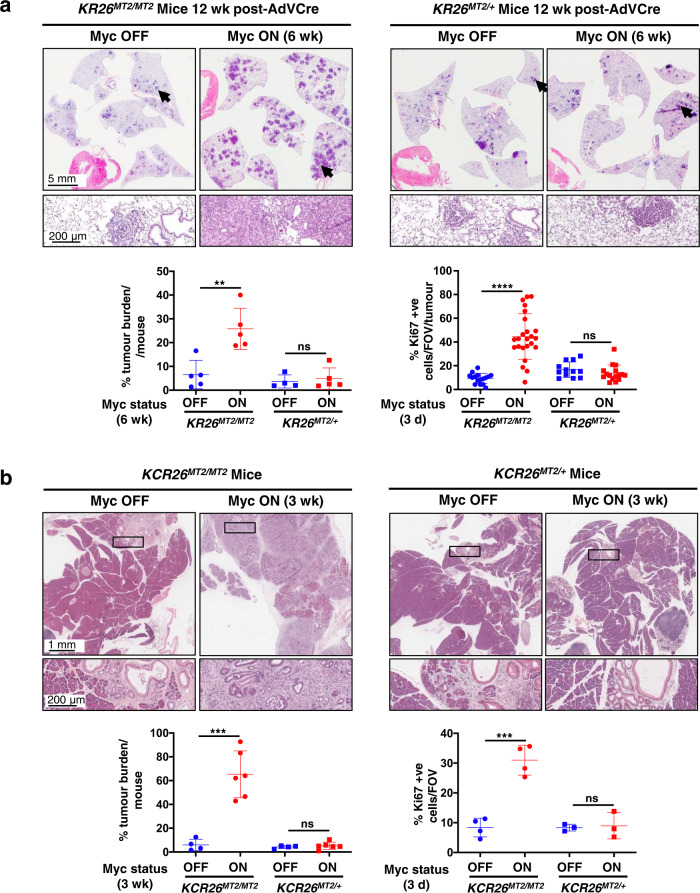
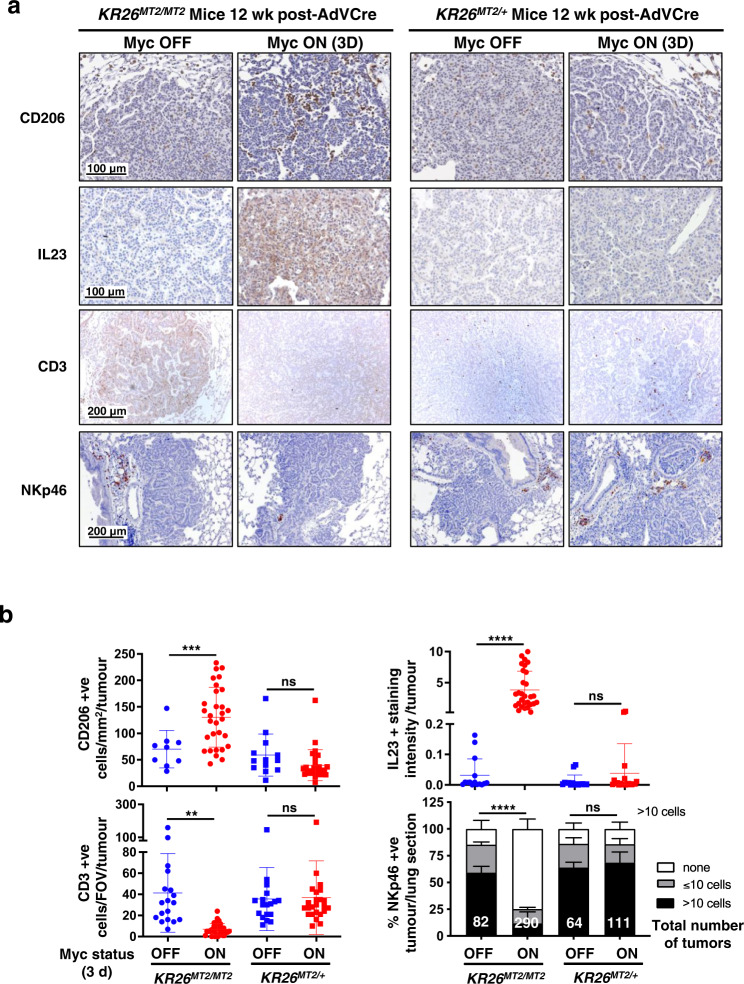
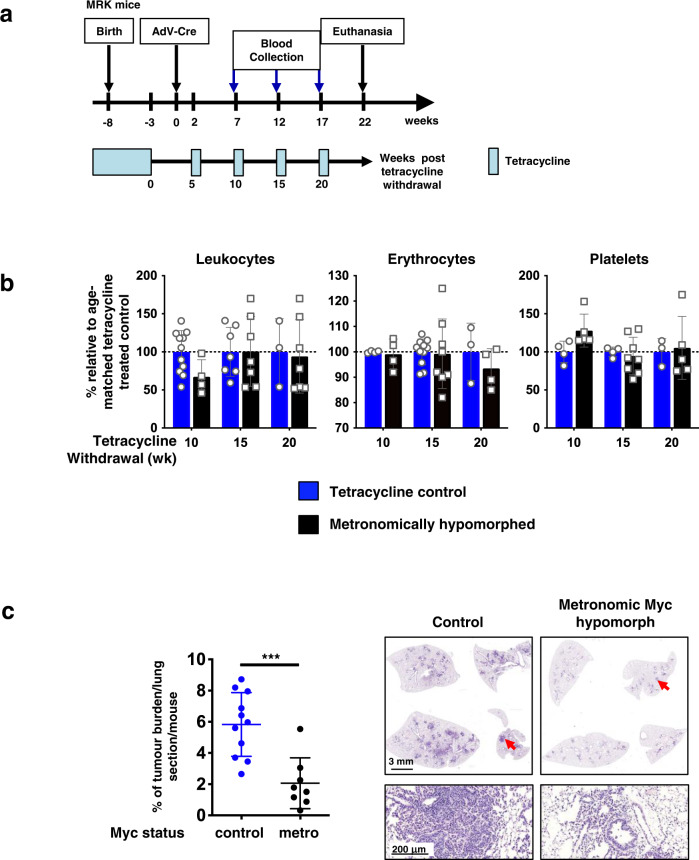
Germ-line hypomorphism of the pleiotropic transcription factor Myc in mice, either through Myc gene haploinsufficiency or deletion of Myc enhancers, delays onset of various cancers while mice remain viable and exhibit only relatively mild pathologies. Using a genetically engineered mouse model in which Myc expression may be systemically and reversibly hypomorphed at will, we asked whether this resistance to tumour progression is also emplaced when Myc hypomorphism is acutely imposed in adult mice. Indeed, adult Myc hypomorphism profoundly blocked KRasG12D-driven lung and pancreatic cancers, arresting their evolution at the early transition from indolent pre-tumour to invasive cancer. We show that such arrest is due to the incapacity of hypomorphic levels of Myc to drive release of signals that instruct the microenvironmental remodelling necessary to support invasive cancer. The cancer protection afforded by long-term adult imposition of Myc hypomorphism is accompanied by only mild collateral side effects, principally in haematopoiesis, but even these are circumvented if Myc hypomorphism is imposed metronomically whereas potent cancer protection is retained.


Conflict of interest statement

G.I.E. is a member of AstraZeneca’s IMED oncology external science advisory panel. The remaining authors declare no competing interests.

Figures

Fig. 1
Fig. 1. Imposition of Myc hypomorphism in adult mice blocks progression of KRasG12D-driven lung hyperplasia to adenocarcinoma.
a Schematic of study. Endogenous Myc was maintained at normal levels in MRK (MycTRE/TRE-actin-tTSKid/–;LSL-KRasG12D/+) mice through development, neonatal growth and into adulthood (5 weeks old) by continuous administration of tetracycline. Endogenous Myc was then hypomorphed by withdrawal of tetracycline and three weeks later Adv-Cre administered by inhalation to trigger sporadic expression of KRasG12D in lung epithelium. Mice were then euthanized 12, 22, or 32 weeks later. Control mice were treated identically save that tetracycline was maintained throughout. b Top left: percentage of tumour burden relative to total lung in non-hypomorphed (blue) versus hypomorphed (red) MRK mice at 12, 22, or 32 weeks post Adv-Cre activation of KRasG12D. Results depict mean ± SD in each treatment group. The unpaired t-test with Welch’s correction was used to analyse tumour burden. *p < 0.05, **p < 0.01, ****p < 0.0001. SD = standard deviation. For 12 weeks: n = 6 for non-hypomorphed control and n = 8 for hypomorphed mice with p =  0.0115; for 22 weeks: n = 6 for non-hypomorphed control and n = 9 for hypomorphed mice with p < 0.0001; for 32 weeks: n = 6 for both non-hypomorphed control and hypomorphed mice with p = 0.0045. Top right: Representative H&E-stained sections of lungs from MRK mice at 32 weeks post Adv-Cre activation of KRasG12D either non-hypomorphed (maintained on tetracycline) or hypomorphed (off tetracycline). Arrows mark regions shown at higher magnification below. Bottom left: Grading of tumours (after) in lungs from MRK mice at 32 weeks post Adv-Cre activation of KRasG12D, either non-hypomorphed (control, maintained on tetracycline) or hypomorphed (off tetracycline). Results depict quantitation of total numbers of tumours of each grade, with the means indicated. Source data are provided as a Source Data file.
Fig. 2
Fig. 2. Myc hypomorphism blocks lung and pancreatic tumour progression post KRasG12D activation but before the transition from indolent pre-tumour to invasive neoplasia.
a Left: schematic of study. MRKPfl (MycTRE/TRE;β-actin-tTSKid/–;LSL-KRasG12D/+;p53flox/flox) mice were maintained on tetracycline (endogenous Myc at wt levels) throughout embryonic and post-natal development until 5 weeks of age. Tetracycline was then withdrawn to hypomorph Myc and 3 weeks later KRasG12D activated and p53 concurrently inactivated sporadically in lung epithelium by Adv-Cre inhalation. Mice were euthanized 14 weeks post Adv-Cre inhalation and lung tissues harvested. Control animals were treated identically save that they were maintained throughout on tetracycline to sustain wt endogenous Myc levels. Centre: quantitation of overall tumour load in non-Myc hypomorphed (blue) versus hypomorphed (red) MRKPfl mice 14 weeks post Adv-Cre inhalation. Results depict mean ± SD in each treatment group. The unpaired t-test with Welch’s correction and two-tailed analysis was used to analyse tumour load. **p < 0.01. n = 6 for non-Myc hypomorphed and n = 7 for hypomorphed mice with p =  0.0010. Right: representative H&E staining of lung tissue harvested from non-hypomorphed versus hypomorphed MRKPfl mice 14 weeks post Adv-Cre inhalation. Arrows mark regions shown at higher magnification below. b Upper left: Schematic of study. In MRKPC (MycTRE/TRE;β-actin-tTSKid/–;LSL-KRasG12D/+;LSL-p53R172H/+;Pdx-1-Cre) mice expression of Cre recombinase is driven from the pdx/IPF1 promoter, triggering co-expression of KRasG12D and p53R172H in pancreatic progenitor cells from around 8.5 dpc. wt levels of endogenous Myc were maintained throughout development and into adulthood by continuous administration of tetracycline. At 4 weeks of age, tetracycline was withdrawn from mice to hypomorph endogenous Myc and animals euthanized 14 weeks later (total 18 weeks old). Tetracycline administration was maintained throughout in the control, non-hypomorphed cohort. Bottom left: quantitation of PDAC tumours per mouse in non-hypomorphed (blue) versus hypomorphed (red) MRKPC mice and overall pancreas weight (a surrogate for tumour load) in the same animals. The unpaired t-test with Welch’s correction and two-tailed analysis was used to analyse the data. Mean ± SD are shown. *p < 0.05, ***p < 0.001. FOV = field of view. SD = standard deviation. For quantitation of PDAC tumours and overall pancreas weight, n = 13 for both non-Myc hypomorphed control and hypomorphed mice with p =  0.0005 and p =  0.0110, respectively. Right: representative macroscopic, low- and high-power images of non-hypomorphed versus hypomorphed pancreata at 18 weeks, showing multiple PDAC tumours in the former but none in the latter. Dotted yellow lines represent the margins of a representative PDAC tumour. Arrows mark regions shown at higher magnification below. Source data are provided as a Source Data file.
Fig. 3
Fig. 3. Deregulated Myc must be expressed above a tight threshold level to drive transition from indolent pre-tumour to lung and pancreas adenocarcinoma in vivo.
a Co-expression of KRasG12D and MycERT2 was sporadically triggered in lung epithelium of either KR26MT2/MT2 (LSL-KRasG12D/+;R26MT2/MT2 – 2 copies of Rosa26-MycERT2) or KR26MT2/+ (LSL-KRasG12D/+;R26MT2/+ 1 copy of Rosa26-MycERT2) adult mice by Adenovirus-Cre inhalation. 6 weeks later (i.e. after 6 weeks of KRasG12D-only activity) MycERT2 was also activated for a further 6 weeks (Myc ON). MycERT2 was not activated in control mice (Myc OFF). Representative H&E-stained sections of lungs from KR26MT2/MT2 versus KR26MT2/+ mice are shown without (left) and with (right) Myc activation. H&E panel inserts below show arrowed regions at higher magnification. Lower panel left: quantitation of percentage tumour burden relative to the total lung in KR26MT2/MT2 and KR26MT2/+ mice, either without or with Myc for 6 weeks. Results depict mean ± SD. Data were analysed using unpaired t-test with Welch’s correction and two-tailed analysis. For KR26MT2/MT2 mice, n = 5 for both Myc OFF and Myc ON groups with p =  0.0045; for KR26MT2/+ mice, n = 4 for Myc OFF and n = 5 for Myc ON groups with p =  0.6346. Lower panel right: quantitation of proliferation (immunohistochemical staining for Ki67) of independent tumours in sections of lungs harvested from KR26MT2/MT2 and KR26MT2/+ mice 12 weeks after activation of KRasG12D either without or with activation of MycERT2 for 3 days. Results depict mean ± SD. For KR26MT2/MT2 mice, n = 16 independent tumours (4 mice) for Myc OFF and n = 24 independent tumours (6 mice) for Myc ON groups with p < 0.0001; for KR26MT2/+ mice, n = 12 independent tumours (3 mice) for Myc OFF and n = 16 independent tumours (4 mice) for Myc ON groups with p =  0.2553. b. Representative H&E-stained sections of pancreata from 15 week-old KCR26MT2/MT2 (LSL-KRasG12D/+;pdx1-Cre;R26MT2/MT2) and KCR26MT2/+ (LSL-KRasG12D/+;pdx1-Cre;R26MT2/+) mice either without or with Myc activation for 3 weeks. H&E panel inserts below show boxed regions at higher magnification. Lower panel left: quantitation of percentage tumour burden relative to the total pancreas from KCR26MT2/MT2 and KCR26MT2/+ mice, either without or with Myc activation for 3 weeks. Results depict mean ± SD. Data were analysed using unpaired t-test with Welch’s correction and two-tailed analysis. For KR26MT2/MT2 mice, n = 4 for Myc OFF and n = 6 for Myc ON groups with p =  0.0004; for KR26MT2/+ mice, n = 4 for Myc OFF and n = 6 for Myc ON groups with p =  0.4809. Lower panel right: quantitation of proliferation (Ki67) in sections of pancreata harvested from 12 week-old KCR26MT2/MT2 and KCR26MT2/+ mice, either without or with activation of MycERT2 for 3 days. Results depict mean ± SD; each data point represents the average quantification of % ki67 staining of lesions from four different regions of the pancreas. Data were analysed using unpaired t-test with Welch’s correction and two-tailed analysis. For KR26MT2/MT2 mice, n = 4 for both Myc OFF and Myc ON groups with p =  0.0006; for KR26MT2/+ mice, n = 3 for both Myc OFF and Myc ON groups with p =  0.8248. **p < 0.01, ***p < 0.001, ****p < 0.0001, ns= non-significant. SD = standard deviation. Part of Fig. 3 (some data relating to KR26MT2/MT2 and KCR26MT2/MT2 mice) is included for reference and is from previous publications,. Source data are provided as a Source Data file.
Fig. 4
Fig. 4. A minimum threshold level of Myc is required to engage instructive stromal signals that drive transition from indolent pre-tumour to invasive neoplasia.
a Representative IHC analysis of in sections of lungs harvested from KR26MT2/MT2 and KR26MT2/+ mice 12 weeks after activation of KRasG12D, either without or with activation of MycERT2 for 3 days. IHC staining is shown for CD206+ macrophages (top row), IL23 (second row), CD3+ T cells (third row), and NKp46+ NK cells (bottom row) in sections of lungs harvested from KR26MT2/MT2 and KR26MT2/+ mice 12 weeks after activation of KrasG12D, either without or with activation of MycERT2 for 3 days. b Quantification of CD206, IL23, CD3 and NKp46 immunohistochemical staining (IHC) in sections of lungs described in A. Results depict mean ± SD of independent tumours from 3-6 mice per treatment group. IL23 + staining intensity was normalised to the number of nuclei per FOV (Field of view) as described in ref. . For NKp46 staining, tumours connected to clearly distinguishable vascular and airway regions were considered; the number of tumour-associated NKp46+ cells per tumour per lung section were counted. Data were analysed using unpaired t-test with Welch’s correction and two-tailed analysis (CD206, IL23, CD3) or two-way ANOVA (NKp46). For CD206 staining, n = 9 independent tumours (3 mice) for Myc OFF and n = 30 independent tumours (6 mice) for Myc ON KR26MT2/MT2 groups with p =  0.0009; n = 13 independent tumours (3 mice) for Myc OFF and n = 27 independent tumours (4 mice) for Myc ON KR26MT2/+ groups with p =  0.1427. For IL23 staining, n = 15 independent tumours (3 mice) for Myc OFF and n = 29 independent tumours (6 mice) for Myc ON KR26MT2/MT2 groups with p < 0.0001; n = 15 independent tumours (3 mice) for Myc OFF and n = 20 independent tumours (4 mice) for Myc ON KR26MT2/+ groups with p =  0.2339. For CD3 staining, n = 18 independent tumours (3 mice) for Myc OFF and n = 32 independent tumours (6 mice) for Myc ON KR26MT2/MT2 groups with p = 0.0011; n = 18 independent tumours (3 mice) for Myc OFF and n = 24 independent tumours (4 mice) for Myc ON KR26MT2/+ groups with p =  0.8982. For NKp46 staining, n = 82 independent tumours (3 mice) for Myc OFF and n = 290 independent tumours (6 mice) for Myc ON KR26MT2/MT2 groups with adjusted p < 0.0001 for > 10 cells; n = 64 independent tumours (3 mice) for Myc OFF and n = 111 independent tumours (4 mice) for Myc ON KR26MT2/+ groups with adjusted p =  0.8311 for >10 cells. **p < 0.01, ***p < 0.001, ****p < 0.0001, ns non-significant, SD standard deviation. Source data are provided as a Source Data file.
Fig. 5
Fig. 5. Metronomic imposition of Myc hypomorphism protects against KRasG12D-driven lung tumourigenesis without triggering associated haematological pathologies.
a Schematic of metronomic prevention study. Endogenous Myc was maintained in MRK mice at normal physiological wt levels throughout development and into adult life by continuous administration of tetracycline. At 5 weeks of age tetracycline was withdrawn to hypomorph endogenous Myc and 3 weeks later KRasG12D sporadically activated in lung epithelium by Adv-Cre inhalation. Two weeks later, mice were put on a metronomic regimen of 1 week’s relaxation from hypomorphism followed by 4 weeks’ re-imposition of Myc hypomorphism, and this was then repeated for a total of 4 cycles. Peripheral blood was withdrawn for analysis just prior to each 1 week’s relaxation period. Normal levels of endogenous Myc were maintained in control mice by continuous administration of tetracycline throughout. Mice were euthanized 22 weeks post Adv-Cre activation of KRasG12D and tissues harvested. b Metronomic imposition of Myc hypomorphism spares mice from haematological pathology. Blood counts of total leukocytes, erythrocytes and platelets taken at various times of the metronomic regimen described (10, 15 and 20 weeks) showing substantial amelioration of the pathological changes caused by sustained Myc hypomorphism. Control mice were maintained on tetracycline throughout. Results represent mean ± SD in each treatment group. Multiple Unpaired t test with Welch correction, single pooled variance, Holm-Šídák method, shows non-significant difference between groups. For leukocytes, at 10 weeks n = 11 and n = 4 for non-Myc hypomorphed and metronomically Myc hypomorphed mice, respectively, with adjusted p = 0.368391; at 15 weeks n = 7 for both groups with adjusted p = 0.974878; at 20 weeks n = 3 and n = 7, respectively, with adjusted p = 0.966531. For erythrocytes, at 10 weeks n = 4 for both non-Myc hypomorphed and metronomically Myc hypomorphed mice with adjusted p = 0.978717; at 15 weeks n = 11 and n = 8, respectively, with adjusted p = 0.978717; at 20 weeks n = 3 and n = 4, respectively, with adjusted p = 0.707513. For Platelets, at 10 weeks n = 4 and n = 5 for non-Myc hypomorphed and metronomically Myc hypomorphed mice, respectively, with adjusted p =  0.286349; at 15 weeks n = 3 and p = 9, respectively, with adjusted p = 0.928754; at 20 weeks n = 3 and n = 5, respectively with adjusted p = 0.928754. c Left: percentage lung tumour burden relative to total lung in control (normal Myc level – blue) versus metronomically Myc hypomorphed MRK mice (black) 22 weeks post Adv-Cre activation of KRasG12D. Results depict mean ± SD in each treatment group. The unpaired t-test Welch’s correction and two-tailed analysis was used to analyse tumour burden. ***p < 0.001. SD = standard deviation. n = 11 for non-Myc hypomorphed and n = 8 for metronomically Myc hypomorphed mice with p = 0.0004. Right: Representative H&E-stained sections of lungs from control (normal Myc level) versus metronomically Myc hypomorphed MRK mice 22 weeks post Adv-Cre activation of KRasG12D. Arrows mark regions shown at higher magnification below. Source data are provided as a Source Data file.

References

    1. Dhanasekaran R, et al. The MYC oncogene — the grand orchestrator of cancer growth and immune evasion. Nat. Rev. Clin. Oncol. 2022;19:23–36. - PMC - PubMed
    1. Sodir, N. M. & Evan, G. I. Finding cancer’s weakest link. Oncotarget2, 1307–13 (2011). - PMC - PubMed
    1. Sodir NM, et al. Endogenous Myc maintains the tumor microenvironment. Genes Dev. 2011;25:907–916. - PMC - PubMed
    1. Soucek L, et al. Modelling Myc inhibition as a cancer therapy. Nature. 2008;455:679–683. - PMC - PubMed
    1. Whitfield JR, Beaulieu ME, Soucek L. Strategies to inhibit Myc and their clinical applicability. Front. Cell Dev. Biol. 2017;5:10. - PMC - PubMed

Publication types

MeSH terms

Substances