. 2022 Nov 9;12(1):19151.
doi: 10.1038/s41598-022-21955-1.

Achieving of high-diet-fiber barley via managing fructan hydrolysis

Affiliations

Achieving of high-diet-fiber barley via managing fructan hydrolysis

Mingliang Fei et al. Sci Rep. .

Abstract

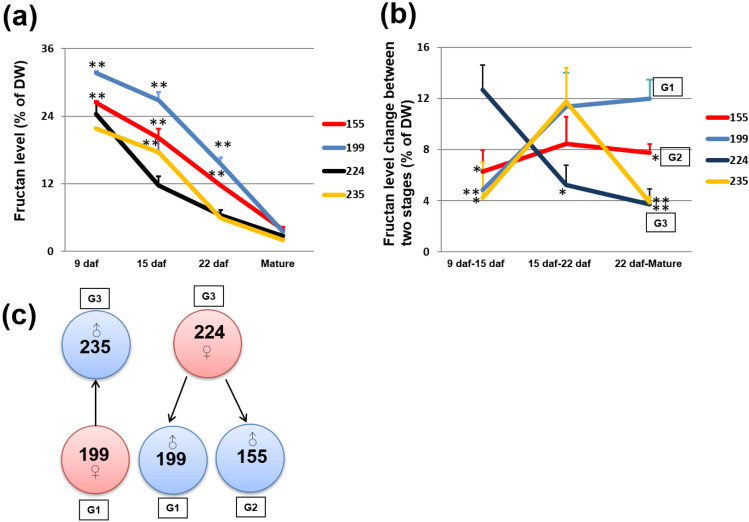
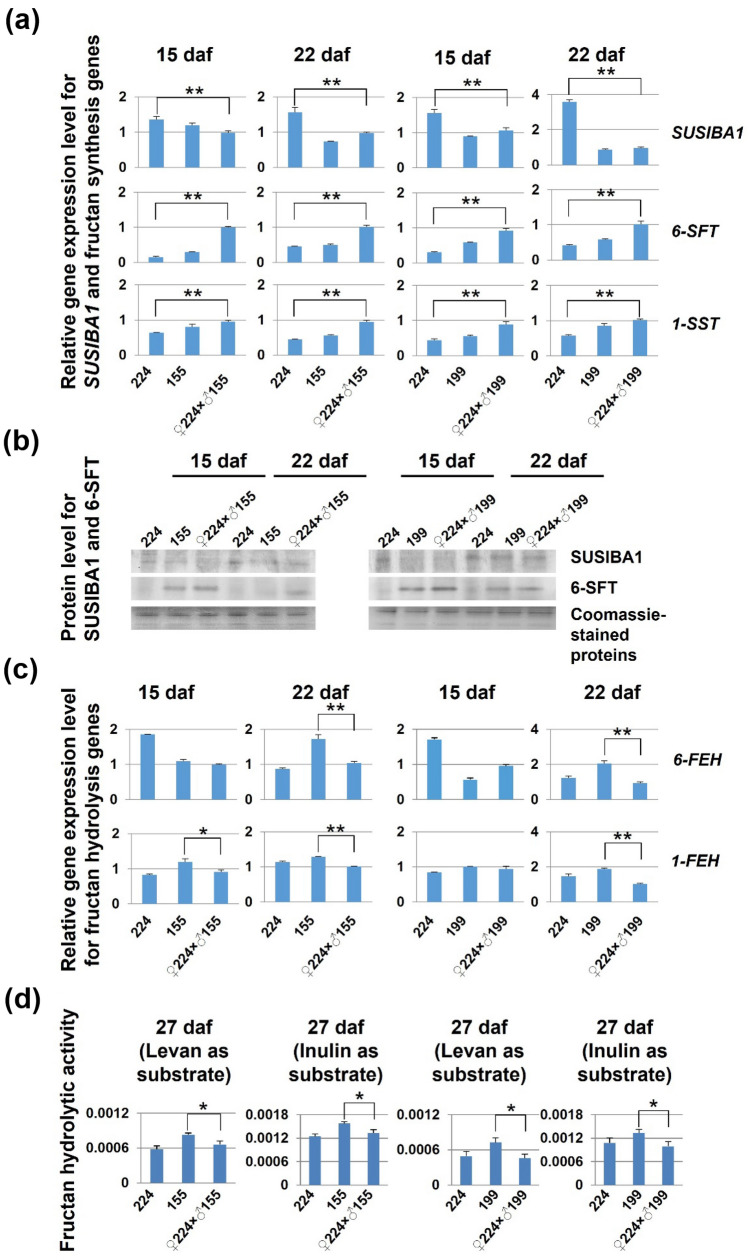
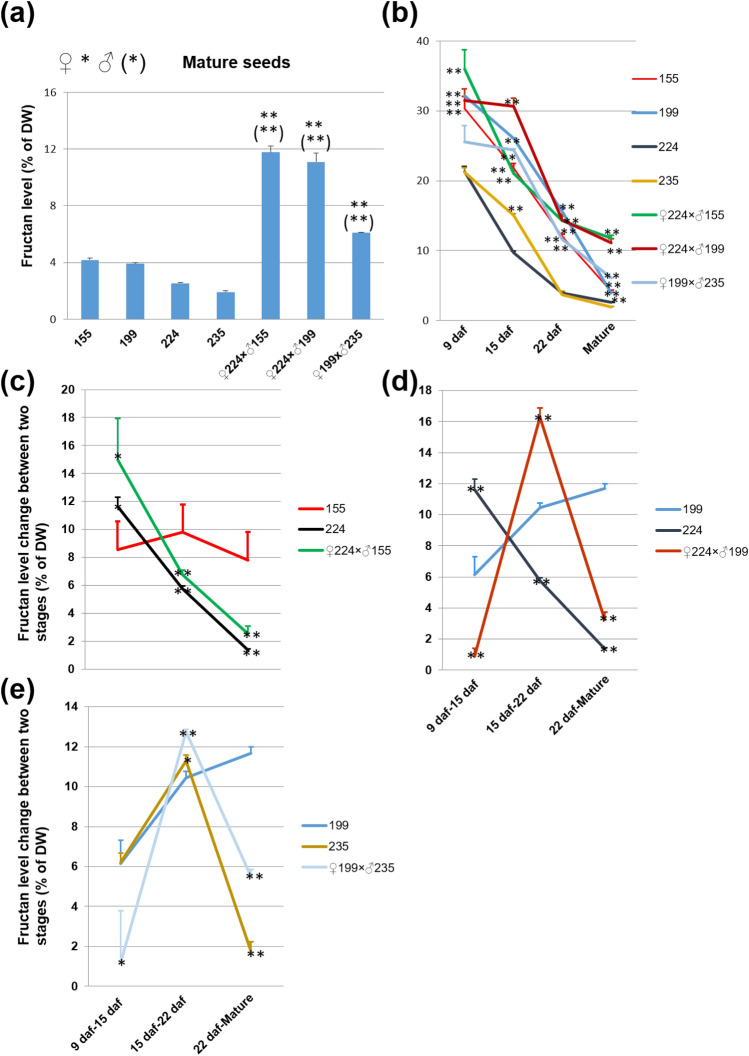
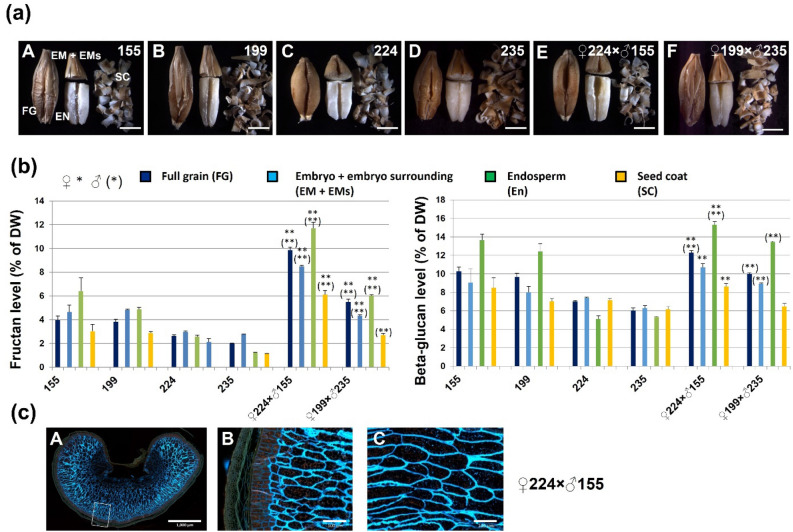
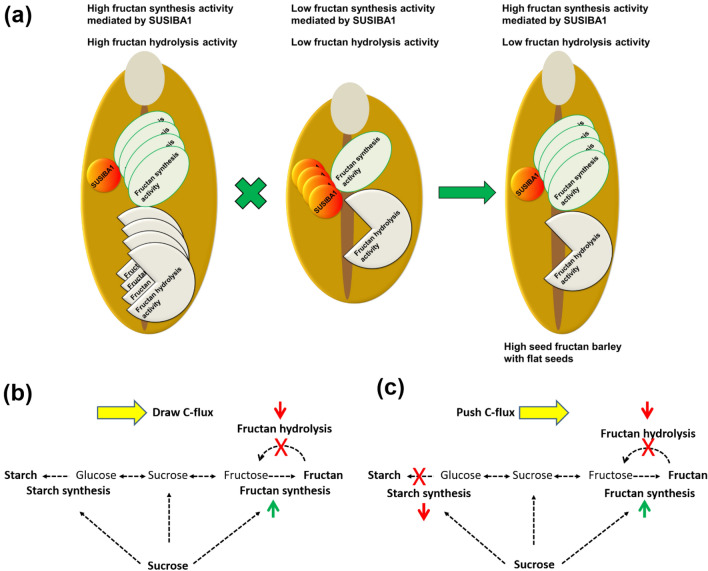
High fructan content in the grain of cereals is an important trait in agriculture such as environmental resilience and dietary fiber food production. To understand the mechanism in determining final grain fructan content and achieve high fructan cereal, a cross breeding strategy based on fructan synthesis and hydrolysis activities was set up and have achieved barley lines with 11.8% storage fructan in the harvested grain. Our study discovered that high activity of fructan hydrolysis at later grain developmental stage leads to the low fructan content in mature seeds, simultaneously increasing fructan synthesis at early stage and decreasing fructan hydrolysis at later stage through crossing breeding is an efficient way to elevate grain diet-fiber content. A good correlation between fructan and beta glucans was also discovered with obvious interest. Field trials showed that the achieved high fructan barley produced over seven folds higher fructan content than control barley and pull carbon-flux to fructan through decreasing fructan hydrolysis without disruption starch synthesis will probably not bring yield deficiency.


Conflict of interest statement

The authors declare no competing interests.

Figures

Figure 1
Figure 1
Design of the crossing strategy. (a) Fructan percentage per unit dry weight (DW) during grain development at 9, 15, 22 days after flowering (daf) and at grain maturity for 4 among the 12 barley lines (see Supplementary Table S1 and Supplementary Fig. S1). (b) Percentage change in fructan level between two development stages. Groups 1 (G1), 2 (G2) and 3 (G 3) are indicated by boxes. (c) Details of the crossing strategy. Pink color indicates maternal and blue color indicates paternal, arrows indicate two crossed varieties. Student’s t-test was used (Error bars show SD). *P < 0.05 and **P < 0.01 are shown for significant differences between the sample level and the lowest sample level at different stages in (a). *P < 0.05 and **P < 0.01 in (b) are shown for significant differences between the fructan reduction level of two stages and the highest reduction level. Three biological replicates or grains from three independent plants (n = 3) were used for analyses.
Figure 2
Figure 2
Fructan content assay in crossing lines of G1/G2 shape-inherited seed and G3 shape-inherited seed. (a) Images of the two types of F3 grains, G1/G2 shape-inherited (G1/G2) and G3 shape-inherited (G3) grains. (b) Percentage per unit dry weight of fructan in different kinds of grains. Student’s t-test was used (Error bars show SD). *P < 0.05 and **P < 0.01 or (*) P < 0.05 and (**) P < 0.01 in (b) are shown for significant differences between the progenies and the maternal or paternal line, respectively. Three biological replicates or grains from three independent plants (n = 3) were used for fructan analyses. Bars = 3 mm.
Figure 3
Figure 3
Gene and protein expression during grain development in F3 progenies after crossing. (a) Results of quantitative real-time PCR (qPCR) analysis of relative gene expression levels of a fructan negative transcription factor gene, SUSIBA1, and two fructan synthesis genes, 6-SFT and 1-SST at 15 and 22 days after flowering (daf). (b) Western blot analysis of proteins SUSIBA1 and 6-SFT in the corresponding samples in (a), and uncropped images are placed in Supplementary Fig. S2. (c) Results of qPCR analysis of relative gene expression levels for two representatives of fructan hydrolysis genes, 6-FEH and 1-FEH, at 15 and 22 daf. (d) Assayed enzyme activity of 6-FEH (levan as substrate) and 1-FEH (inulin as substrate) at 27 daf. Enzyme activity expressed as mg of fructose formation per min at 25 °C. Student’s t-test was used (Error bars show SD). *P < 0.05 and **P < 0.01 are shown for significant differences between the progenies and the parent of interest. Three biological replicates or grains from three independent plants (n = 3) were used for qPCR analysis and two biological replicates for Western blot analysis.
Figure 4
Figure 4
Fructan percentage per unit dry weight (DW) in the high grain fructan barley. (a) Fructan level in mature grains of different barley lines, F3 progenies of G3 (224) × G2 (155), G3 (224) × G1 (199) and G1 (199) × G3 (235), and the parents 155, 199, 224, and 235. (b) Fructan level during grain development in the same barley lines. (ce) Fructan level percentage change between two development stages of individual barley lines. Student’s t-test was used (Error bars show SD). **P < 0.01 is shown for significant differences between the progenies and the parents in (a). **P < 0.01 is shown for significant differences between the sample level and the lowest sample level at different stages in (b). *P < 0.05 and **P < 0.01 are shown for significant differences between the progenies/G3 (224 or 235) and G1/G2(199/155) in (ce). Three biological replicates or grains from three independent plants (n = 3) were used for analyses.
Figure 5
Figure 5
Fructan and beta-glucan levels and microstructure of different tissues in high fructan grain. (a) Images of the front side (A–F) of a full grain (FG, dehusked), embryo (EM), embryo-surrounding tissue (EM + Ems), endosperm (EN), and seed coat (SC). Tissues of barley lines 155, 199, 224, 235, 224 × 155 and 199 × 235 were hand-dissected using a razor blade. (b) Percentage of fructan and beta-glucan per unit dry weight (DW) in the different tissue fractions of the barley lines. A good correlation between fructan and beta-glucan content was found in full grain and all three tissues (Pearson correlation coefficient (r) = 0.9121). (c) Microscopic images of the microstructure in high-fructan grain line 224 × 155. Photographs of cross-sections of full grains (A). Close-ups of the corresponding boxed region (B, C) in the images (A), respectively. Student’s t-test was used (Error bars show SD). *P < 0.05 and **P < 0.01 or (*) P < 0.05 and (**) P < 0.01 in (b) are shown for significant differences between the progenies and the maternal or paternal line, respectively. Three biological replicates or grains from three independent plants (n = 3) were used for analyses. Bars = 3 mm (A–F of a), 1000 µm (A of c), 200 µm (B of c), and 100 µm (C of c).
Figure 6
Figure 6
A large field trial to assess fructan levels and yield. (a) Photo of a large field trial. (b) Fructan content in the field trial samples. (c) Yield of two elite varieties, Aino (6 row) and Anneli (2 row), and F5 crosslines of high grain fructan barley. Student’s t-test was used (Error bars show SD). *P < 0.05 and **P < 0.01 are shown for significant differences between high-fructan barley and elite varieties. Plot of 15 m2 for each line and two plots were performed following the agricultural company´s test system. Three biological replicates or grains from three independent plants (n = 3) were used for fructan analyses.
Figure 7
Figure 7
Model depicting the crossing strategy in this study to obtain high grain fructan barley and mechanism in determining grain fructan content at harvesting. (a) The red disc represents negative transcription factor SUSIBA1 for fructan synthesis. Fructan synthesis activity as indicated represents at least activity of 6-SFT and 1-SST. Fructan hydrolysis activity consists at least of 6-FEH and 1-FEH. Less SUSIBA1 leads to more fructan synthesis activity. High grain fructan barley usually has a flat grain phenotype. (b) Lower fructan hydrolysis activity (pull marker) together with the higher fructan synthesis activity (push maker) generates a force for carbon-flux to fructan accumulation without impacting starch synthesis. (c) Starch synthesis is disrupted by mutations, which generates a high concentration of small sugars pushing carbo-flux to fructan synthesis accompanied with lower fructan hydrolysis and higher fructan synthesis activity.

Similar articles

References

    1. Versluys M, Kirtel O, Toksoy-Öner E, Van-den-Ende W. The fructan syndrome: Evolutionary aspects and common themes among plants and microbes. Plant Cell Environ. 2018;41:16–38. doi: 10.1111/pce.13070. - DOI - PubMed
    1. Ritsema T, Smeekens S. Fructans: Beneficial for plants and humans. Curr. Opin. Plant Biol. 2003;6:223–230. doi: 10.1016/S1369-5266(03)00034-7. - DOI - PubMed
    1. Van-den-Ende W, De-Coninck B, Van-Laere A. Plant fructan exohydrolases: A role in signaling and defense? Trends Plant Sci. 2004;9:523–528. doi: 10.1016/j.tplants.2004.09.008. - DOI - PubMed
    1. Vijn I, Smeekens S. Fructan: More than a reserve carbohydrate? Plant Physiol. 1999;120:351–360. doi: 10.1104/pp.120.2.351. - DOI - PMC - PubMed
    1. Wagner W, Keller F, Wiemken A. Fructan metabolism in cereals: Induction in leaves and compartmentation in protoplasts and vacuoles. Z. Pflanzenphysiol. 1983;112:359–372. doi: 10.1016/S0044-328X(83)80053-1. - DOI

Publication types