. 2022 Nov 9;12(1):19155.
doi: 10.1038/s41598-022-23882-7.

Machine learning for morbid glomerular hypertrophy

Affiliations

Machine learning for morbid glomerular hypertrophy

Yusuke Ushio et al. Sci Rep. .

Abstract

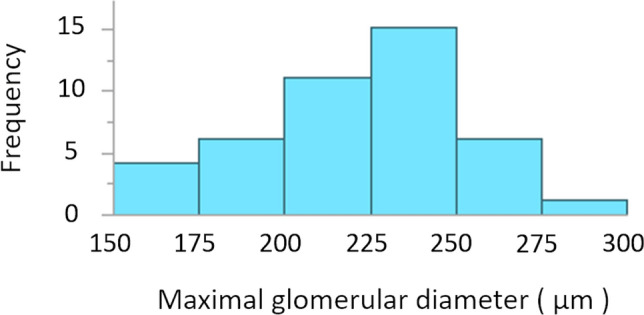
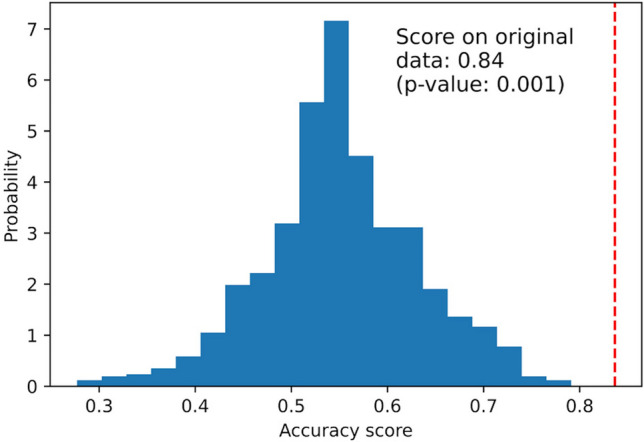
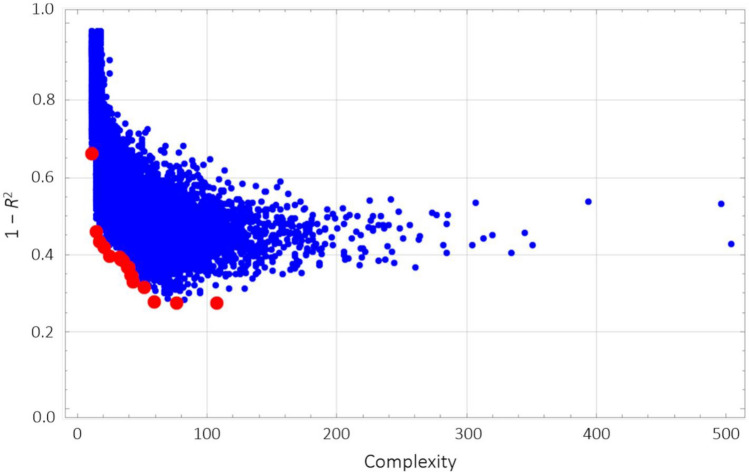
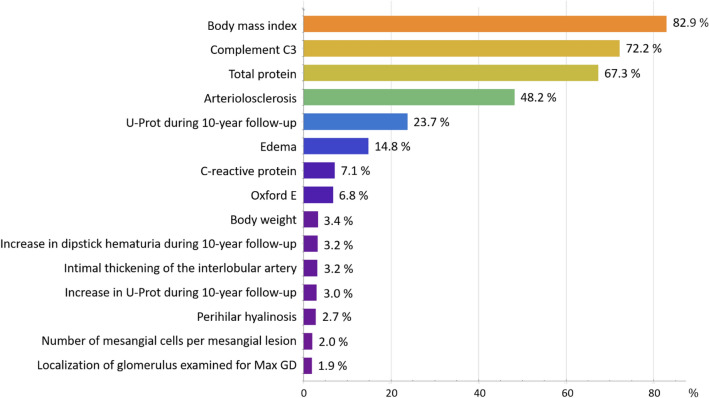
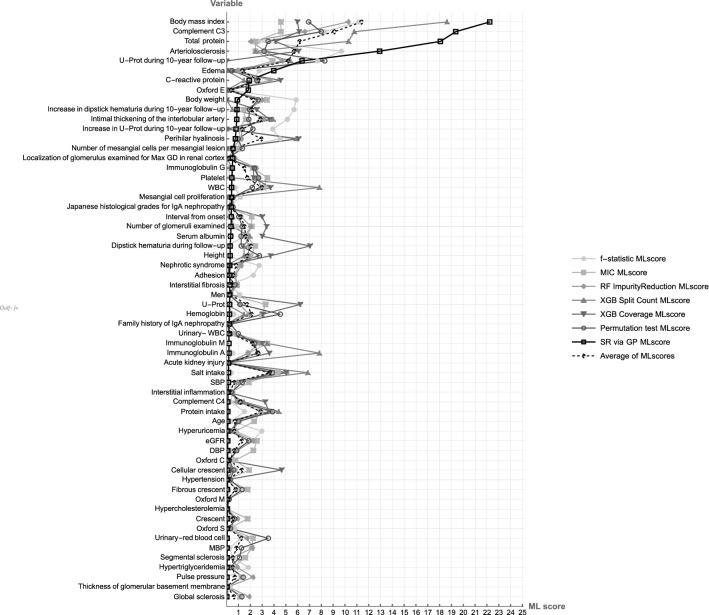
A practical research method integrating data-driven machine learning with conventional model-driven statistics is sought after in medicine. Although glomerular hypertrophy (or a large renal corpuscle) on renal biopsy has pathophysiological implications, it is often misdiagnosed as adaptive/compensatory hypertrophy. Using a generative machine learning method, we aimed to explore the factors associated with a maximal glomerular diameter of ≥ 242.3 μm. Using the frequency-of-usage variable ranking in generative models, we defined the machine learning scores with symbolic regression via genetic programming (SR via GP). We compared important variables selected by SR with those selected by a point-biserial correlation coefficient using multivariable logistic and linear regressions to validate discriminatory ability, goodness-of-fit, and collinearity. Body mass index, complement component C3, serum total protein, arteriolosclerosis, C-reactive protein, and the Oxford E1 score were ranked among the top 10 variables with high machine learning scores using SR via GP, while the estimated glomerular filtration rate was ranked 46 among the 60 variables. In multivariable analyses, the R2 value was higher (0.61 vs. 0.45), and the corrected Akaike Information Criterion value was lower (402.7 vs. 417.2) with variables selected with SR than those selected with point-biserial r. There were two variables with variance inflation factors higher than 5 in those using point-biserial r and none in SR. Data-driven machine learning models may be useful in identifying significant and insignificant correlated factors. Our method may be generalized to other medical research due to the procedural simplicity of using top-ranked variables selected by machine learning.


Conflict of interest statement

Toshio Mochizuki received honoraria for lectures from Otsuka Pharmaceutical Co. Toshio Mochizuki and Hiroshi Kataoka belong to an endowed department sponsored by Otsuka Pharmaceutical Co., Chugai Pharmaceutical Co., Kyowa Hakko Kirin Co., and JMS Co. All other authors have no conflicts of interest to declare.

Figures

Figure 1
Figure 1
Histogram of MaxGD. The distribution of MaxGD is illustrated as light blue histograms. Abbreviation: MaxGD, maximal glomerular diameter.
Figure 2
Figure 2
Permutation test results with the original dataset (permutation test scores for the classifier of MaxGD ≥ 242.3 μm). The distribution of accuracy score for the permuted data is illustrated as blue histograms. It represents the result of 5000 permutation tests for assessing classifier performance when selecting the 60 most discriminative variables. The red dotted line indicates the accuracy score value (0.84) obtained by the classifier in the original dataset (permutation P-value, 0.001). Abbreviation: GD, glomerular diameter.
Figure 3
Figure 3
Distribution of functions generated with symbolic regression via genetic programming. Generated functions are plotted on the function space, where the horizontal axis represents the complexity of a function and the vertical axis represents 1 − R2 or error. In total, 19,437 predictive functions are generated with symbolic regression via genetic programming. Each dot represents one function, and the red dots represent functions on the Pareto front that are candidates for optimized functions with ensemble learning.
Figure 4
Figure 4
Frequencies (GP): Frequently utilized predictive variables in selected models using SR via GP. The 15 most frequently utilized predictive variables in 1819 predictive functions, which are selected among 19,437 models generated in the leave-one-out cross-validation using symbolic regression via genetic programming, are listed in descending order. The horizontal axis represents the appearance frequencies [Frequencies (GP)]: the percentage at which each predictive variable is utilized in all 1,819 predictive functions. Abbreviations: GP, genetic programming; SR, symbolic regression; C3, component 3; U-Prot, urinary protein excretion; Oxford E1, the presence of endocapillary hypercellularity; MaxGD, maximal glomerular diameter.
Figure 5
Figure 5
ML scores using eight machine learning models. ML scores of 60 variables. Abbreviations: ML, machine learning; MIC, maximal information coefficient; RF ImpurityReduction, impurity reduction with random forest; XGB, eXtreme Gradient Boosting; SR via GP, symbolic regression via genetic programming; MaxGD, maximal glomerular diameter; eGFR, estimated glomerular filtration rate; WBC, white blood cell; U-Prot, Urinary protein excretion; SBP, systolic blood pressure; MBP, mean blood pressure; DBP, diastolic blood pressure; Complement C4, complement component 4; Complement C3, complement component 3.

References

    1. Beam AL, Kohane IS. Big data and machine learning in health care. JAMA. 2018;319:1317–1318. doi: 10.1001/jama.2017.18391. - DOI - PubMed
    1. Bzdok D, Altman N, Krzywinski M. Statistics versus machine learning. Nat. Methods. 2018;15:233–234. doi: 10.1038/nmeth.4642. - DOI - PMC - PubMed
    1. Rajula, H. S. R., Verlato, G., Manchia, M., Antonucci, N. & Fanos, V. Comparison of conventional statistical methods with machine learning in medicine: Diagnosis, drug development, and treatment. Medicina (Kaunas). 56 (2020). - PMC - PubMed
    1. Bzdok D. Classical statistics and statistical learning in imaging neuroscience. Front. Neurosci. 2017;11:543. doi: 10.3389/fnins.2017.00543. - DOI - PMC - PubMed
    1. Deo RC. Machine learning in medicine. Circulation. 2015;132:1920–1930. doi: 10.1161/CIRCULATIONAHA.115.001593. - DOI - PMC - PubMed