. 2022 Nov 9;12(1):19112.
doi: 10.1038/s41598-022-23601-2.

Anti-neoplastic sulfonamides alter the metabolic homeostasis and disrupt the suppressor activity of regulatory T cells

Affiliations

Anti-neoplastic sulfonamides alter the metabolic homeostasis and disrupt the suppressor activity of regulatory T cells

Roberto Gedaly et al. Sci Rep. .

Abstract

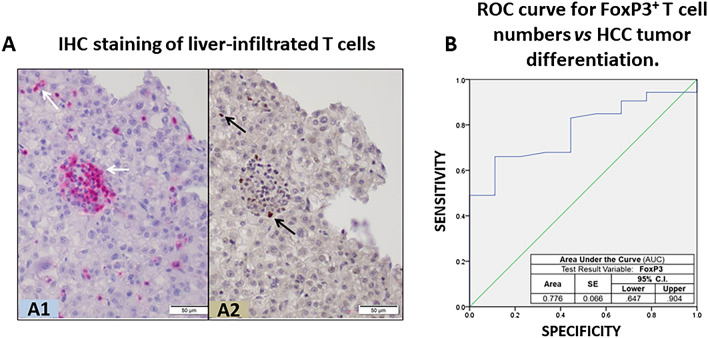
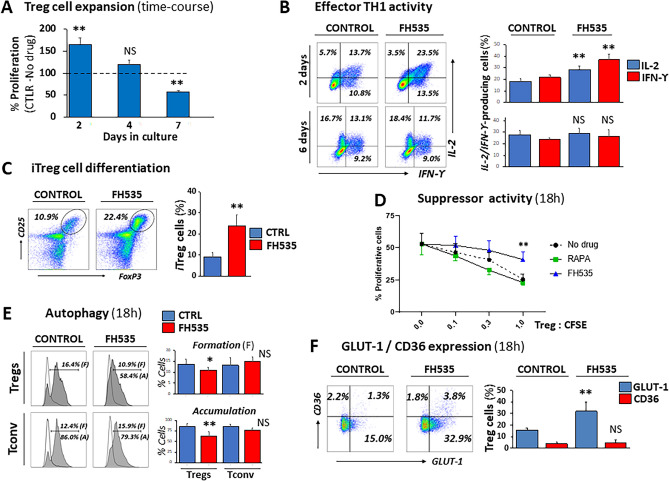
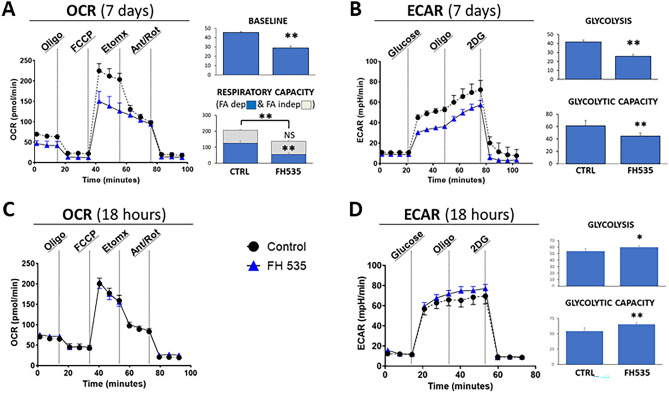
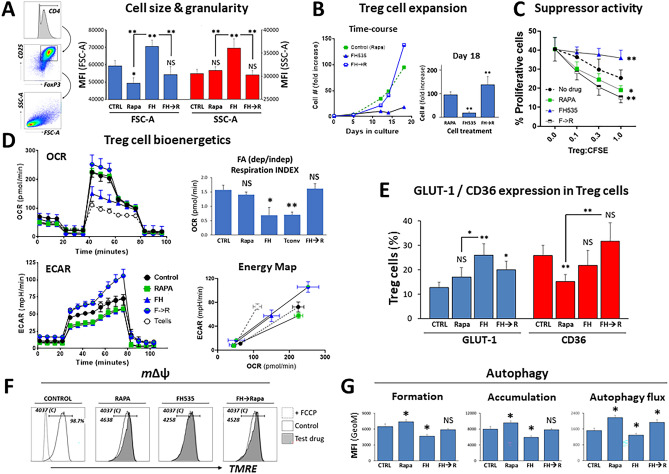
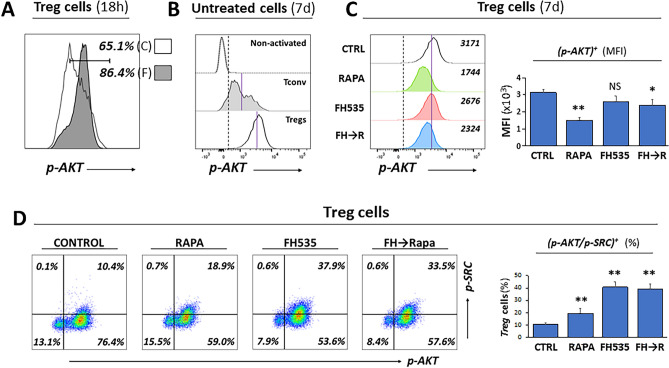
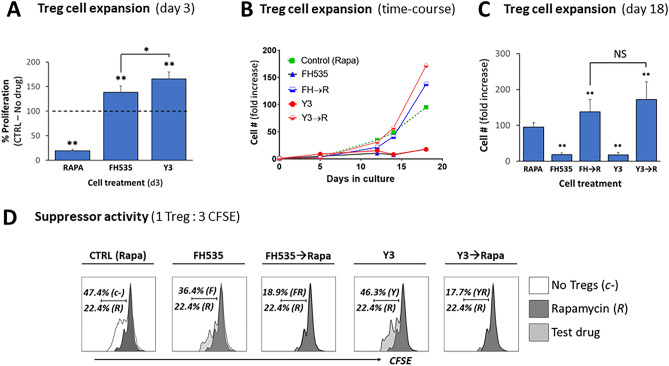
Regulatory T cells (Tregs) are essential to maintain self-tolerance and immune homeostasis but, as components of the tumor microenvironment (TME), are also a major barrier to effective cancer immunosurveillance and immunotherapy. FH535 and its derivative Y3 are two N-aryl-benzene-sulfonamides (NABs) that inhibit HCC cell proliferation and tumor progression. However, the impact of NABs on the immune cells in the TME is not yet known. Analyses of explanted livers from patients with hepatocellular carcinoma (HCC) showed that high levels of tumor-infiltrating Tregs were associated with poor tumor differentiation. These results lead us to investigate the immunomodulatory effects of NABs in regulatory and effector T cells. Exposure of primary human Tregs to NABs induced a rapid but temporary increase of cell expansion, a gradual disruption of suppressor activity, and concomitant bioenergetics and autophagic flux dysregulations. In contrast to Tregs, no gross effects were observed in effector T cells. Addition of Rapamycin prevented the functional decay of Tregs and restored their metabolic profile, suggesting that NAB effects require the integrity of the mTOR pathway. This study revealed the immunomodulatory properties of NABs with a preferential impact on Treg activity and provided novel insights into the anti-tumor potential of sulfonamides.


Conflict of interest statement

RG, DSW, CL and FM are holding patents IR-2321 and IR-2349 for NAB derivative Y3. Competing interest is not applicable for remaining authors.

Figures

Figure 1
Figure 1
Infiltration of T cells in HCC samples from transplanted liver patients. (A) Conventional IHC staining of liver-infiltrated T cells in a representative section of paraffin-embedded HCC-bearing liver reveals: (A1) presence of T cell-like CD3+ cells (purple dots showing clusters of CD3+ cells) in the liver sinusoids and parenchyma, and (A2) FoxP3+ cells (brown dots); scale bar 50 µm. (B) Receiver operating characteristic (ROC) curve comparing sensitivity and specificity for the risk index of poor HCC differentiation across a range of FoxP3+ infiltrate values.
Figure 2
Figure 2
Immunomodulatory properties of FH535 on Treg and Teff cell responses. (A) Time-course of in vitro expansion of Treg cells. Pooled data from four independent experiments are depicted as mean ± SD percentages of FH535-exposed cells with respect to control (untreated) cells (dotted line, 100% reference value). (B) Representative plots and pooled data (mean ± SD) from four independent experiments of effector TH1 responses in conventional CD4+ T cells after 2- and 6-days culture in TH1-polarization media (see “Methods” section) with or without addition of FH535. Plot windows include the corresponding percentages of intracellular IL2- and IFNg-producing cells. (C) Representative plots and pooled data (mean ± SD) of four experiments of in vitro induced Treg cells (FoxP3+/CD25+, iTregs) after seven day-culture of conventional CD4+ T cells in Treg-polarizing conditions in the absence (Control) or presence of FH535. (D) Loss of suppressor activity in peripheral Treg cells after 18 h-exposure to FH535. Results show the mean ± SD from three independent experiments. (E) Analysis of intracellular autophagic vacuoles in Treg (top) and Tconv (bottom) cells cultured for 18-h without (Control) and with FH535. Representative histograms and pooled data (mean ± SD) from three independent experiments of CytoID expression in cells cultured alone (empty histogram) illustrate the autophagic vesicle formation (F) overlaid with the corresponding samples co-cultured with Chloroquine (filled grey) to measure autophagic vesicle accumulation (A). Results are expressed as percentages of positive cells. (F) Representative dual dot-plot analysis and pooled data (mean ± SD) of four independent experiments corresponding to the expression of GLUT-1 and CD36 in peripheral Tregs in response to FH535. Corresponding results with conventional T cells (Tconv) are shown in Fig. S4. Percentages of positive cells for each condition are indicated in each panel. Statistical differences promoted by FH535 treatment are shown as *(p < 0.05) and **(p < 0.005) compared with control (no drug) as assessed by Student’s t test.
Figure 3
Figure 3
Bioenergetic deterioration of Treg cells after exposure to FH535. (A) Oxygen consumption rate (OCR) profiles of Treg cells after 7-day culture in the absence (Control) or presence of FH535. Bar panels show the corresponding measurements of Baseline and Respiratory Capacity, differentiated between FA-dependent (Etomoxir-sensitive, blue bars) and FA-independent (Etomoxir-resistant, grey bars) respiration. (B) Extracellular acidification rate (ECAR) profiles of Treg cells under the same conditions as in (A). AUC measurements of corresponding ECAR values of Glycolysis and Glycolytic capacity. (C,D) OCR and ECAR readings of Treg cells cultured in FH535 or vehicle control for 18 h (C) Exposure to FH535 did not induce any change on the OCR profile. (D) In contrast, exposure to FH535 enhanced glycolysis and glycolytic capacity of Treg cells. Results show the mean ± SD from six replicates. (*)p < 0.05 and (**)p < 0.005 significance were determined by Student’s t test.
Figure 4
Figure 4
Rescue of FH535-induced functional decay of Treg cells after sequential addition of Rapamycin (FH535 → Rapa) linked to metabolic cell restitution. Tconv or Treg cells were cultured without (Control) or with Rapa alone, FH535 alone, or FH535 alone for two days followed by the combination of Rapa and FH535 (FH → Rapa). (A) Left vertical panels illustrate gating strategy used for scatter dot plot (FSC forward scatter; SSC side scatter) analysis of Treg cells. Right column graph depicts pooled data of the relative size (FSC) and granularity (SSC) in Treg cells after 4-day culture in different drug regimens. Results are indicated as mean GeoMFI values ± SD from four independent experiments. (B) Representative long-term time-course Treg cell expansion showing the relative fold increase of cell numbers with respect to the original (day 0). Column graph of pooled data from four independent experiments showing fold-increase in cell numbers (mean ± SD) after 18-days in culture. (C) Suppressor activity of Treg cells exposed to drug treatments for seven days from three independent 4-day MLR assays. (D). Treg cell bioenergetics after 7-days culture with the different drug treatments. Untreated Tconv profile was included as an additional comparative condition. Top panels show the OCR profiles with the corresponding (FA-dependent/FA-independent) respiration indexes. Bottom-left panel shows the ECAR profiles. Bottom-right panel shows Cell Energy Phenotype Profiles as scatter plots of OCR (X-axis) and ECAR (Y-axis) depicting the metabolic ranges (from basal to maximum stress levels) reached by the cells under the different treatments. Results show the mean ± SD from six replicates. (E) Pooled data from four independent experiments show the expression of GLUT-1 and CD36 in Treg cells after 7 days in culture with the corresponding drug treatment. (F) mΔΨ in Treg cells after 4-days culture with the different drug treatments measured by TMRE (see “Methods” section). (G) Autophagic activity in Treg cells after 7-days exposure to the different treatments without (vesicle formation, left panel) or with CLQ (vesicle accumulation, central panel). Autophagic flux was determined by MFI differences of CytoID+ cells between cells treated with CLQ and the corresponding cells without CLQ (right panel). Results are shown as mean ± SD of four replicates. Statistical differences were tested with ANOVA/Dunnett’s and Student’s t tests and are shown by *(p < 0.05) and **(p < 0.005).
Figure 5
Figure 5
Overactivation of AKT/mTOR signaling by FH535 treatment in Treg cells is partially mitigated after the sequential addition of Rapamycin (FH535 → Rapa). (A) Representative histogram panel showing the short-term (18-h) enhancing effect of FH535 (F, filled profile) overlayered with untreated control (C, empty profile) Treg cells. Results are shown as percentages of p-AKT+ cells. (B) p-AKT expression profiles in non-activated (CD25), activated (CD25+) Tconv and Treg cells are shown as offset histogram panels defining common threshold values for p-AKT+ (dashed vertical line) and the specific GeoMFI (blue line). Worth noting the higher expression of p-AKT in Treg cells compared to Tconv. (C) Representative offset histogram data analysis and pooled graph of 4 individual experiments (mean ± SD of GeoMFI values) of p-AKT expression in Treg cells exposed to the different treatments during seven days. Threshold of positive p-AKT expression (dotted line) and GeoMFI value of control treatment (blue line) are shown as reference. (D) Representative dual dot-plot analysis corresponding to the expression of p-AKT and p-SRC kinase (activated form, phosphorylated at Y416) in Treg cells. The percentages of positive cells for each condition are indicated in corresponding panels. Column graph of pooled data analysis illustrates mean percentage ± SD of double positive p-AKT/p-SRC Treg cells from 4 individual experiments.
Figure 6
Figure 6
FH535 effects on Treg cells are replicated by the N-arylbenzene-sulfonamide derivative Y3. (A) Short-time effect of Y3 on Treg cell expansion. In vitro expansion of Treg cells exposed to vehicle control (no drug), Rapa, FH535 or Y3 for 3 days. Results are pooled data collected from four independent experiments and depicted as mean ± SD of percentage of experimental values with respect to control (no drug) cells (dotted line, 100% reference value). (B) Representative time-course experiment of in vitro expansion of Treg cells placed in culture in Treg cell media supplemented with the corresponding drug treatment. Results show the relative fold increase of cell numbers with respect to the original sample (day 0). Dotted line shows the response of the cells to the standard culture conditions with Rapa. (C) Comparative fold increase of Treg cell numbers generated from pooled results of four different donors are shown as mean ± SD. (D) The suppressor activity of Treg cells after 7 day-exposure to drug treatments was evaluated in 4-day MLR assays. Representative panels show the corresponding histograms of 1:3 ratio of Treg: CFSE-labeled T cells overlaid to standard treatment with Rapa (R, dark profile) or to the absence of Tregs (empty profile). Results show the percentages of proliferating responder cells for each condition. Individual experiments were confirmed at least three times. Data was analyzed by ANOVA with Dunnett’s test or Student’s t test for pairwise comparisons. Significance with respect to control is shown by *(ρ < 0.05) and **(ρ < 0.005); NS no significant differences.

References

    1. Shirabe K, et al. Tumor-infiltrating lymphocytes and hepatocellular carcinoma: Pathology and clinical management. Int. J. Clin. Oncol. 2010;15:552–558. doi: 10.1007/s10147-010-0131-0. - DOI - PubMed
    1. Augustin RC, Delgoffe GM, Najjar YG. Characteristics of the tumor microenvironment that influence immune cell functions: Hypoxia, oxidative stress, metabolic alterations. Cancers (Basel) 2020;12:12802. doi: 10.3390/cancers12123802. - DOI - PMC - PubMed
    1. Katz SC, et al. Regulatory t cell infiltration predicts outcome following resection of colorectal cancer liver metastases. Ann. Surg. Oncol. 2013;20:946–955. doi: 10.1245/s10434-012-2668-9. - DOI - PMC - PubMed
    1. Chaoul N, Mancarella S, Lupo L, Giannelli G, Dituri F. Impaired anti-tumor t cell response in hepatocellular carcinoma. Cancers (Basel) 2020;12:030627. doi: 10.3390/cancers12030627. - DOI - PMC - PubMed
    1. Fitzmaurice C, et al. Global, regional, and national cancer incidence, mortality, years of life lost, years lived with disability, and disability-adjusted life-years for 29 cancer groups, 1990 to 2016: A systematic analysis for the global burden of disease study. JAMA Oncol. 2018;4:1553–1568. doi: 10.1001/jamaoncol.2018.2706. - DOI - PMC - PubMed

Publication types