. 2023 Jan;37(1):164-177.
doi: 10.1038/s41375-022-01747-2. Epub 2022 Nov 9.

Inhibition of USP1 reverses the chemotherapy resistance through destabilization of MAX in the relapsed/refractory B-cell lymphoma

Affiliations

Inhibition of USP1 reverses the chemotherapy resistance through destabilization of MAX in the relapsed/refractory B-cell lymphoma

Xi-Ya Li et al. Leukemia. 2023 Jan.

Abstract

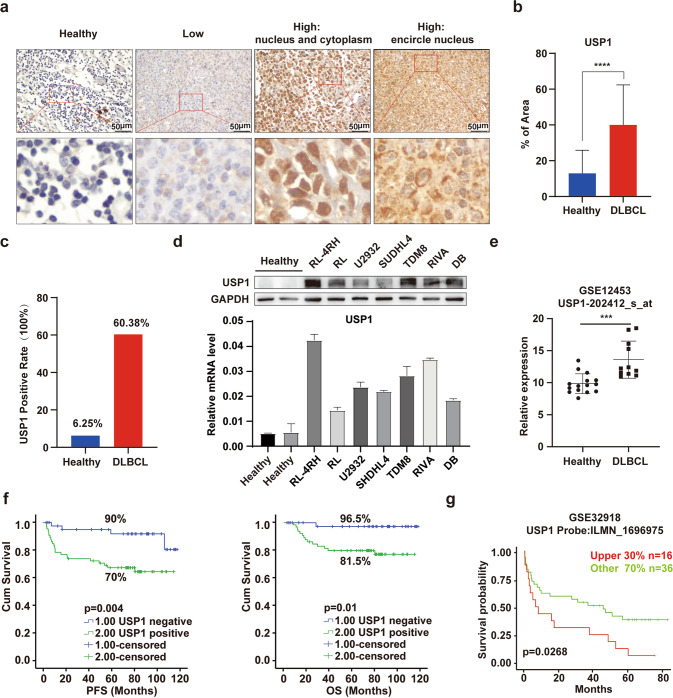
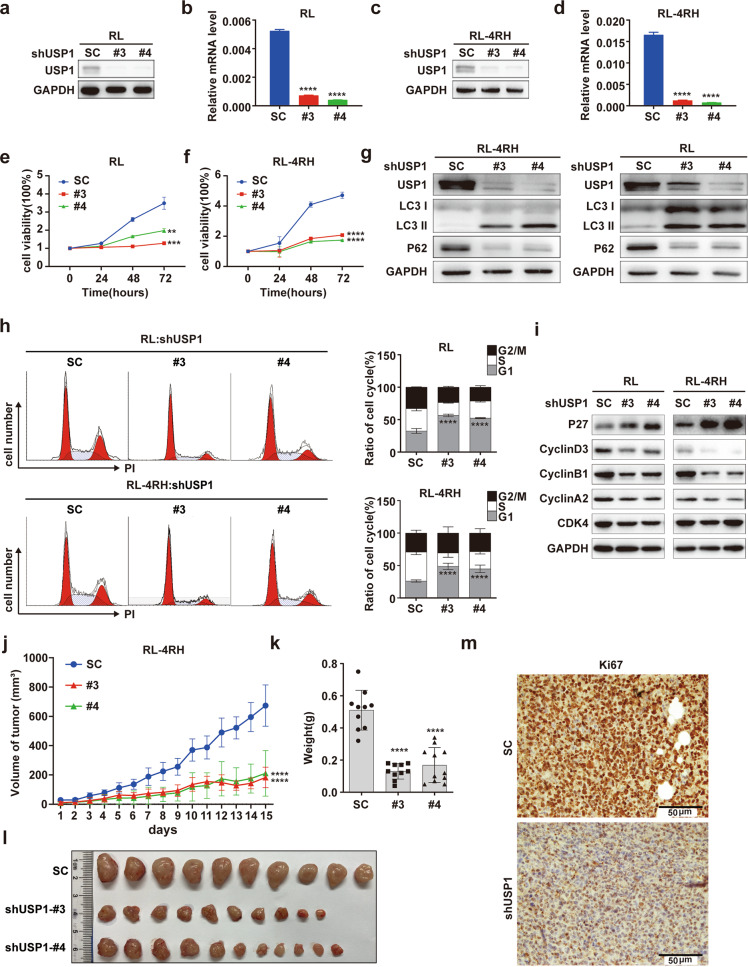
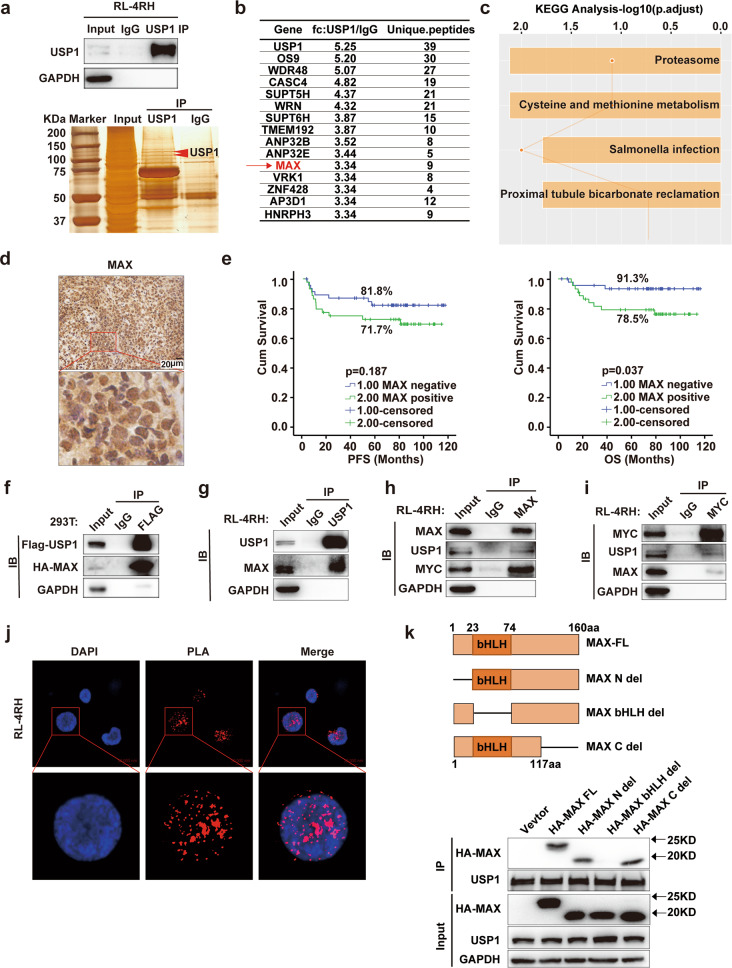
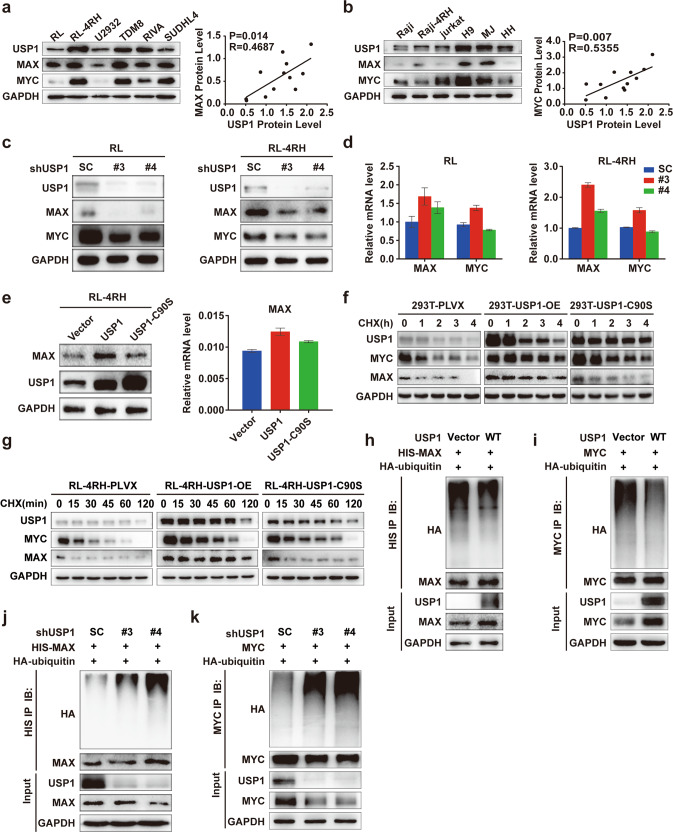
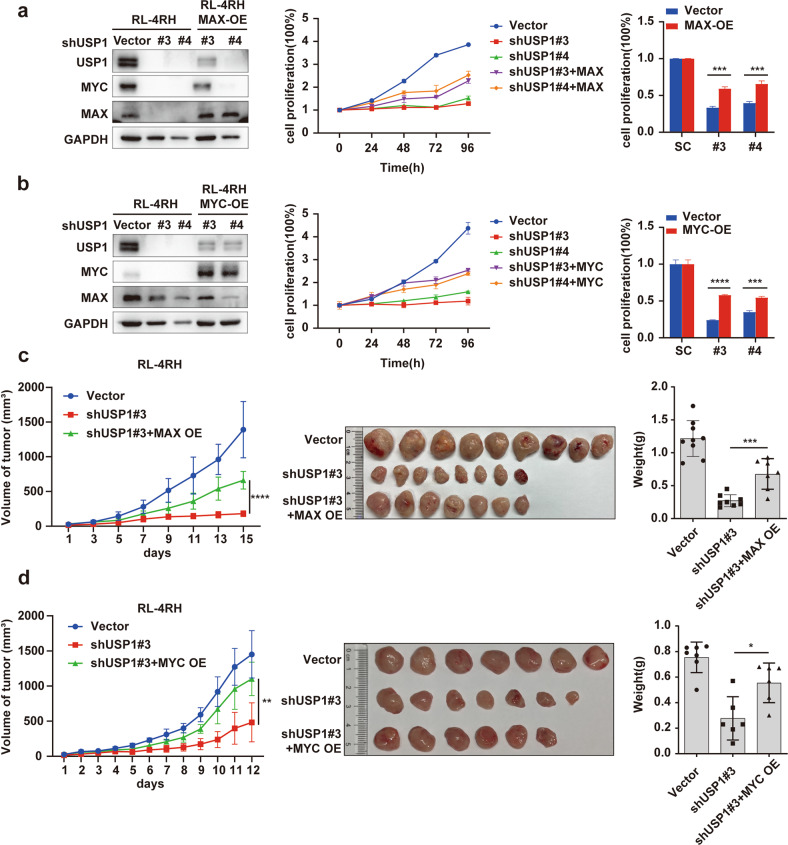
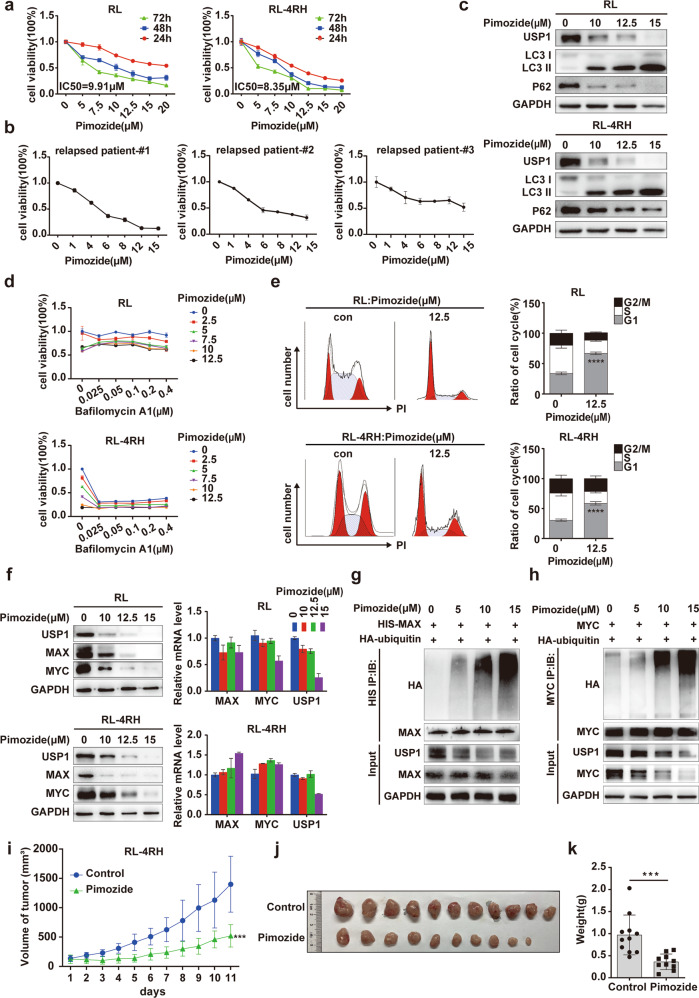
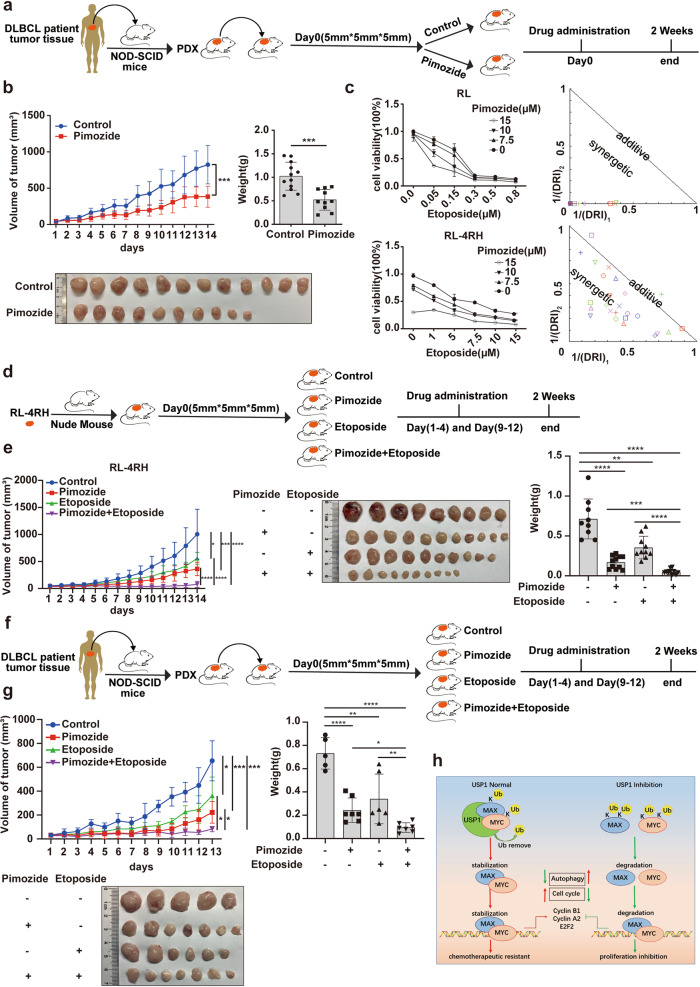
The patients with relapsed and refractory diffuse large B-cell lymphoma (DLBCL) have poor prognosis, and a novel and effective therapeutic strategy for these patients is urgently needed. Although ubiquitin-specific protease 1 (USP1) plays a key role in cancer, the carcinogenic effect of USP1 in B-cell lymphoma remains elusive. Here we found that USP1 is highly expressed in DLBCL patients, and high expression of USP1 predicts poor prognosis. Knocking down USP1 or a specific inhibitor of USP1, pimozide, induced cell growth inhibition, cell cycle arrest and autophagy in DLBCL cells. Targeting USP1 by shRNA or pimozide significantly reduced tumor burden of a mouse model established with engraftment of rituximab/chemotherapy resistant DLBCL cells. Pimozide significantly retarded the growth of lymphoma in a DLBCL patient-derived xenograft (PDX) model. USP1 directly interacted with MAX, a MYC binding protein, and maintained the stability of MAX through deubiquitination, which promoted the transcription of MYC target genes. Moreover, pimozide showed a synergetic effect with etoposide, a chemotherapy drug, in cell and mouse models of rituximab/chemotherapy resistant DLBCL. Our study highlights the critical role of USP1 in the rituximab/chemotherapy resistance of DLBCL through deubiquitylating MAX, and provides a novel therapeutic strategy for rituximab/chemotherapy resistant DLBCL.


Conflict of interest statement

The authors declare no competing interests.

Figures

Fig. 1
Fig. 1. USP1 is highly expressed in DLBCL and associated with poor prognosis.
a Immunohistochemical staining analysis for USP1 in primary DLBCL samples and healthy subject samples [Healthy: healthy subject samples, Low: low expression of USP1, High (nucleus and cytoplasm): high expression of USP1 in nucleus and cytoplasm, High (encircle nucleus): high expression of USP1 in the encircle nucleus]. Scale bar = 50 μm. b Quantitative results of immunohistochemical assays for USP1 in primary DLBCL samples. c The USP1-positive rates of DLBCL patients or healthy subjects were calculated (negative: lower than 55%, positive: greater than or equal to 55%). d Western blotting and quantitative real-time PCR analysis of USP1 expression in DLBCL cell lines and healthy human PBMCs. e The relative ratio of USP1 mRNA in DLBCL tissue samples versus that in normal B cells was shown. Data were obtained from the GEO database. f Conjoint analysis of USP1 expression and the prognosis of DLBCL patients. g The analysis of GSE32918 data by using LOGpc indicated that patients with higher USP1 expression had shorter OS than those with lower USP1 expression. Data are presented as mean ± SD, *p < 0.05, **p < 0.01, ***p < 0.005, ****p < 0.001.
Fig. 2
Fig. 2. Knockdown of USP1 inhibited the proliferation of rituximab/chemotherapy resistant DLBCL cells in vitro and in vivo.
ad Western blotting and quantitative real-time PCR analysis of USP1 expression in RL and RL-4RH cells with USP1 knockdown and the control cells. e, f The proliferation of RL and RL-4RH cells transduced with shRNA against USP1 (shUSP1) or the scrambled shRNA (shSC) was examined by using MTT assay. g Autophagy-related proteins were examined by using western blotting assay in RL and RL-4RH cells with USP1 knockdown. h Changes in the cell cycle were examined by using flow cytometry assays in RL and RL-4RH cells with USP1 knockdown. The representative pictures of flow cytometry analysis (left panel) and the statistical results of flow cytometry experiments (right panel) were shown. i Changes in cell cycle-related proteins were examined by using western blotting assay in RL and RL-4RH cells with USP1 knockdown. jl A DLBCL xenograft mouse model was established by using RL-4RH cells with or without USP1 knockdown. m The expression levels of Ki67 in xenograft tumors were determined by using IHC assay. Data are presented as mean ± SD from three independent experiments, *p < 0.05, **p < 0.01, ***p < 0.005, ****p < 0.001. Statistical analysis was performed with a paired t test.
Fig. 3
Fig. 3. USP1 interacted with MAX and MYC in rituximab/chemotherapy resistant DLBCL cells.
a The IP assay was performed by using an anti-USP1 antibody in RL-4RH cells, and the enriched proteins were examined by using western blotting and silver nitrate staining assays. b The list of the top 15 USP1-interacting proteins. c KEGG pathway analysis of USP1-interacting proteins. d Immunohistochemical staining analysis for MAX in primary DLBCL samples. e Conjoint analysis of MAX expression and the prognosis of DLBCL patients. f 293T cells were transfected with Flag-USP1 and HA-MAX. USP1 was immunoprecipitated with an anti-Flag antibody and HA-MAX was examined by using western blotting assay. The control immunoprecipitation was performed with IgG. g USP1 was immunoprecipitated with anti-USP1 antibody in RL-4RH cells and MAX was examined by using western blotting assay. The control immunoprecipitation was performed by using IgG. h, i MAX and MYC were immunoprecipitated in RL-4RH cells with anti-MAX or anti-MYC antibody, and USP1 was detected by using western blotting assay. j Proximity ligation assay (PLA) assay to detect the interaction of USP1 and MAX. k Co-immunoprecipitation and western blotting analysis showing the binding of HA-MAX and its variants with USP1 in 293T cells. Data are presented as mean ± SD, *p < 0.05, **p < 0.01, ***p < 0.005, ****p < 0.001.
Fig. 4
Fig. 4. USP1 maintained the stability of MAX through deubiquitination in rituximab/chemotherapy resistant DLBCL cells.
a, b The expression of USP1, MAX and MYC was examined by using western blotting assay in DLBCL, Burkitt and T cell lymphoma cell lines. c, d Western blotting and quantitative real-time PCR analysis of USP1, MAX and MYC expression were performed in RL and RL-4RH cells with USP1 knockdown. e Western blotting and quantitative real-time PCR analysis of MAX in RL-4RH cells overexpressing USP1, USP1-C90S, or the empty vector. f 293T cells, transduced with USP1, USP1-C90S or the empty vector, were treated with CHX for 1, 2, 3 or 4 h and the expression of USP1, MAX and MYC was examined by using western blotting assay. g RL-4RH cells, transduced with USP1, USP1-C90S or the empty vector, were treated with CHX for 15, 30, 45, 60 or 120 min and the expression of USP1, MAX and MYC was examined by using western blotting assay. h 293T cells overexpressing MAX were transfected with USP1, HA-ubiquitin or the empty vector. MAX was immunoprecipitated with anti-HIS antibody, and HA-ubiquitin was examined by using western blotting assay. i 293T cells overexpressing MYC were transfected with USP1, HA-ubiquitin or the empty vector. MYC was immunoprecipitated with anti-MYC antibody, and HA-ubiquitin was examined by using western blotting assay. j 293T cells overexpressing MAX were transfected with HA-ubiquitin, and transduced with shRNA (#3, #4) against USP1 or the control shRNA (SC) 24 h after transfection. MAX was immunoprecipitated with anti-HIS antibody, and HA-ubiquitin was examined by using western blotting assay. k 293T overexpressing MYC were transfected with HA-ubiquitin and then transduced with shRNA against USP1 or the control shRNA 24 h after transfection. MYC was immunoprecipitated with anti-MYC antibody, and HA-ubiquitin was examined by using western blotting assay.
Fig. 5
Fig. 5. Overexpression of MAX or MYC rescued the inhibition of cell proliferation induced by USP1 knockdown in cell and mouse models of rituximab/chemotherapy resistant DLBCL.
a, b RL-4RH cells overexpressing MAX or MYC were transduced with shRNA against USP1. The protein levels of USP1, MAX and MYC were measured by using western blotting assay (left panel), and the changes of cell proliferation were examined by using MTT assay (middle panel). The quantitative statistical results were shown 96 h after transduction (right panel). c The inhibition of cell proliferation induced by the USP1 knockdown was rescued by overexpression of MAX in the DLBCL xenotransplantation mouse model. d The inhibition of cell proliferation induced by USP1 knockdown was rescued by overexpression of MYC in the DLBCL xenotransplantation mouse model. Data are presented as mean ± SD from three independent experiments, *p < 0.05, **p < 0.01, ***p < 0.005, ****p < 0.001. Statistical analysis was performed with a paired t test.
Fig. 6
Fig. 6. The USP1 inhibitor pimozide inhibited the proliferation of rituximab/chemotherapy resistant DLBCL cells in vitro and in vivo.
a RL and RL-4RH cells were treated with pimozide at different concentrations for 24, 48 and 72 h, and the cell viability was measured by using MTT assay. b The primary lymphoma cells from a relapsed DLBCL patient were treated with pimozide at different concentrations for 24 h, and cell viability was measured by using MTT assay. c Autophagy-related proteins of RL and RL-4RH cells treated with pimozide were examined by using western blotting assay. d RL and RL-4RH cells were treated with the different combinations of pimozide and bafilomycin A1 for 72 hours and cell viability was examined by using MTT assay. e Changes of cell cycle in RL and RL-4RH cells treated with pimozide (12.5 μM) were examined by using flow cytometry assay. The representative picture of flow cytometry analysis (left panel), and the statistical results of flow cytometry experiments (right panel) were shown. f RL and RL-4RH cells were treated with pimozide (10 μM, 12.5 μM or 15 μM) for 48 hours, and the expression levels of USP1, MAX and MYC were examined by using western blotting (left panel) and quantitative real-time PCR (right panel) assays. g, h 293T cells overexpressing MAX or MYC were transfected with HA-ubiquitin and treated with pimozide at different concentrations for 24 h. MAX or MYC were immunoprecipitated with anti-HIS or anti-MYC antibody, and HA-ubiquitin was examined by using western blotting assay. ik Pimozide treatment was performed in a DLBCL xenograft mouse model established with RL-4RH cells. Data are presented as mean ± SD from three independent experiments, *p < 0.05, **p < 0.01, ***p < 0.005, ****p < 0.001. Statistical analysis was performed with a paired t test.
Fig. 7
Fig. 7. Pimozide treatment increased the sensitivity of rituximab/chemotherapy resistant DLBCL cells to etoposide.
a, b Pimozide treatment was performed in a DLBCL xenograft mouse model established by using the DLBCL patient tumor tissues. c RL and RL-4RH cells were treated with the combination of pimozide and etoposide for 72 h. The viability of RL and RL-4RH cells was measured by using MTT assay, and the combinative effects of pimozide and etoposide on RL and RL-4RH cells were analyzed by using combosyn software. d, e Treatment with pimozide (15 mg/kg), etoposide (10 mg/kg) or the combination of pimozide (15 mg/kg) and etoposide (10 mg/kg) was performed in the DLBCL xenograft mouse model established by using RL-4RH cells. f, g Treatment with pimozide (15 mg/kg), etoposide (10 mg/kg) or the combination of pimozide (15 mg/kg) and etoposide (10 mg/kg) was performed in the PDX mouse model. h Schematic diagram of functions and molecular mechanisms of USP1 in DLBCL. Data are presented as mean ± SD, *p < 0.05, **p < 0.01, ***p < 0.005, ****p < 0.001. Statistical analysis was performed with a paired t test.

References

    1. Armitage JO, Weisenburger DD. New approach to classifying non-Hodgkin’s lymphomas: clinical features of the major histologic subtypes. Non-Hodgkin’s Lymphoma Classification Project. J Clin Oncol. 1998;16:2780–95. - PubMed
    1. Jiang M, Bennani NN, Feldman AL. Lymphoma classification update: B-cell non-Hodgkin lymphomas. Expert Rev Hematol. 2017;10:405–15. - PubMed
    1. Coiffier B, Lepage E, Briere J, Herbrecht R, Tilly H, Bouabdallah R, et al. CHOP chemotherapy plus rituximab compared with CHOP alone in elderly patients with diffuse large-B-cell lymphoma. N Engl J Med. 2002;346:235–42. - PubMed
    1. Coiffier B, Thieblemont C, Van Den Neste E, Lepeu G, Plantier I, Castaigne S, et al. Long-term outcome of patients in the LNH-98.5 trial, the first randomized study comparing rituximab-CHOP to standard CHOP chemotherapy in DLBCL patients: a study by the Groupe d’Etudes des Lymphomes de l’Adulte. Blood. 2010;116:2040–5. - PMC - PubMed
    1. Pfreundschuh M, Kuhnt E, Trumper L, Osterborg A, Trneny M, Shepherd L, et al. CHOP-like chemotherapy with or without rituximab in young patients with good-prognosis diffuse large-B-cell lymphoma: 6-year results of an open-label randomised study of the MabThera International Trial (MInT) Group. Lancet Oncol. 2011;12:1013–22. - PubMed

Publication types

MeSH terms