. 2022 Nov;611(7936):594-602.
doi: 10.1038/s41586-022-05425-2. Epub 2022 Nov 9.

Spatial genomics maps the structure, nature and evolution of cancer clones

Affiliations

Spatial genomics maps the structure, nature and evolution of cancer clones

Artem Lomakin et al. Nature. 2022 Nov.

Abstract

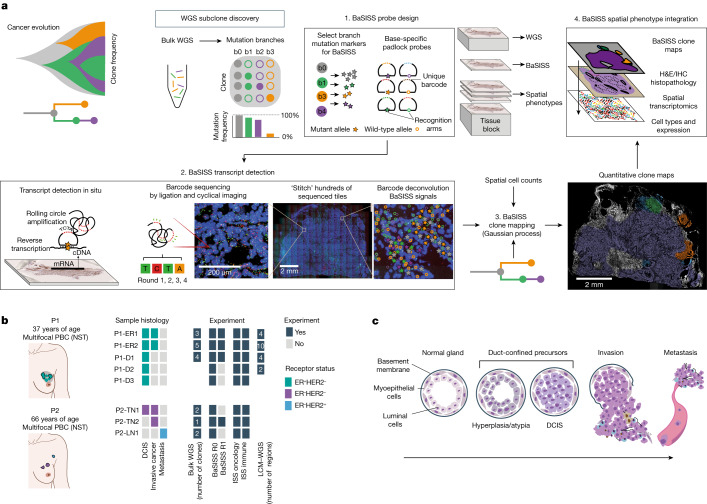
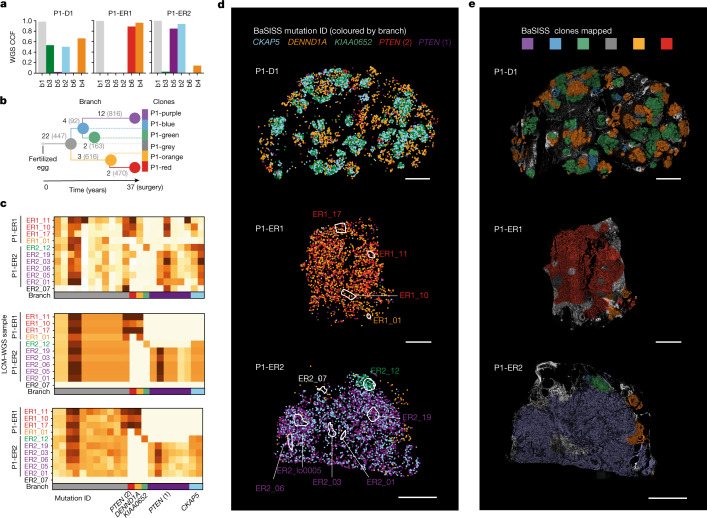
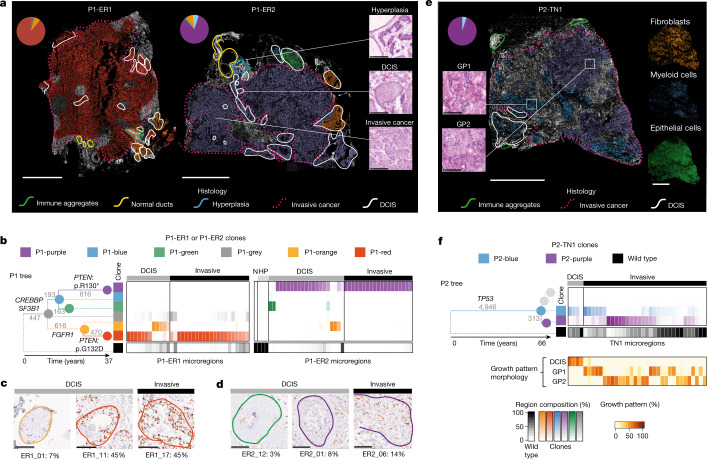
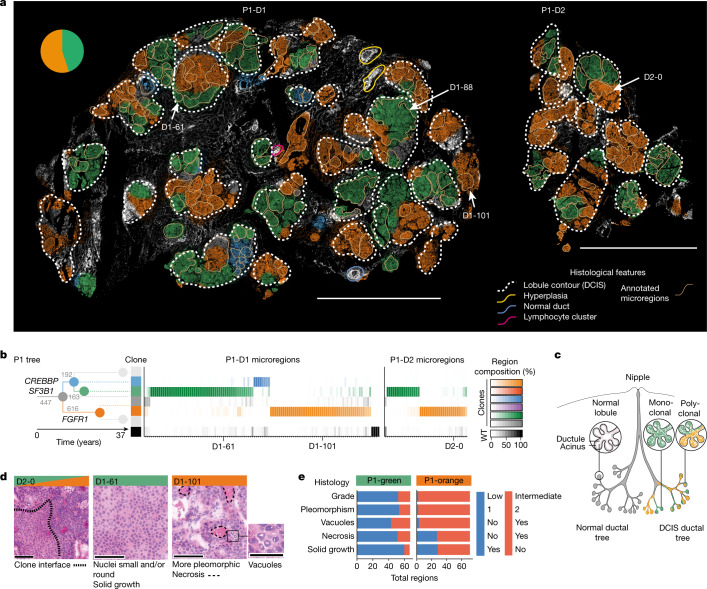
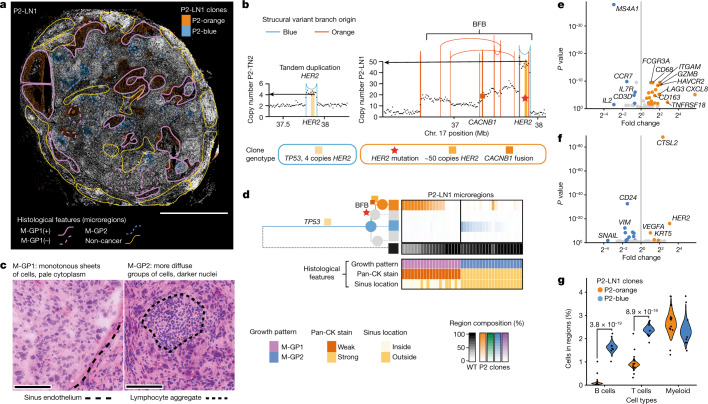
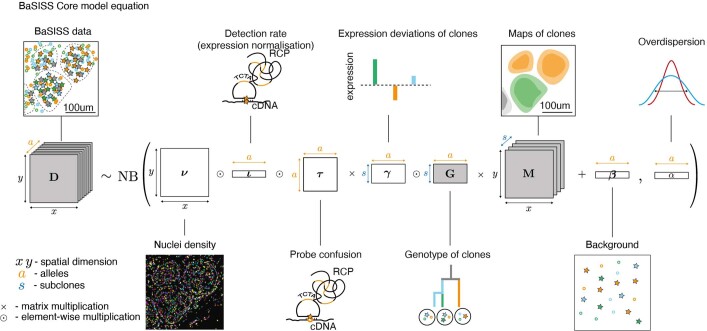
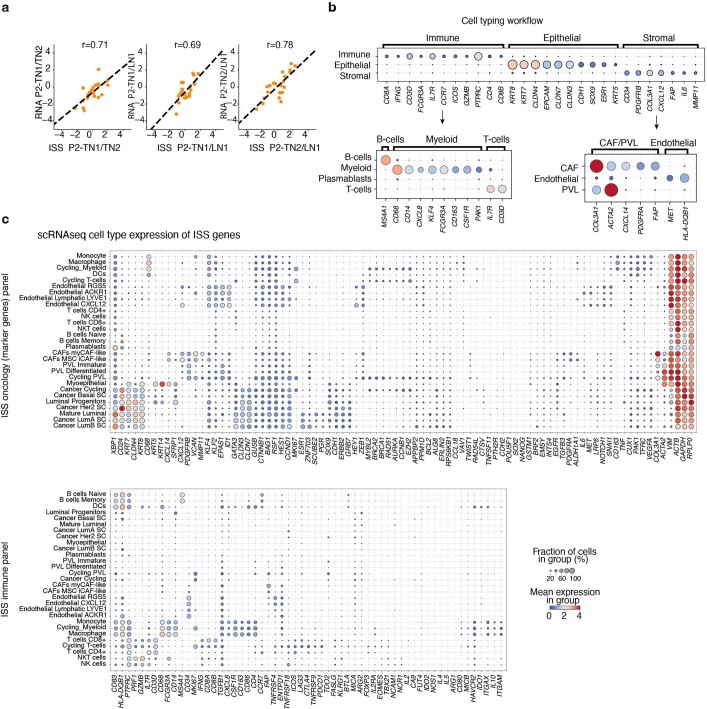
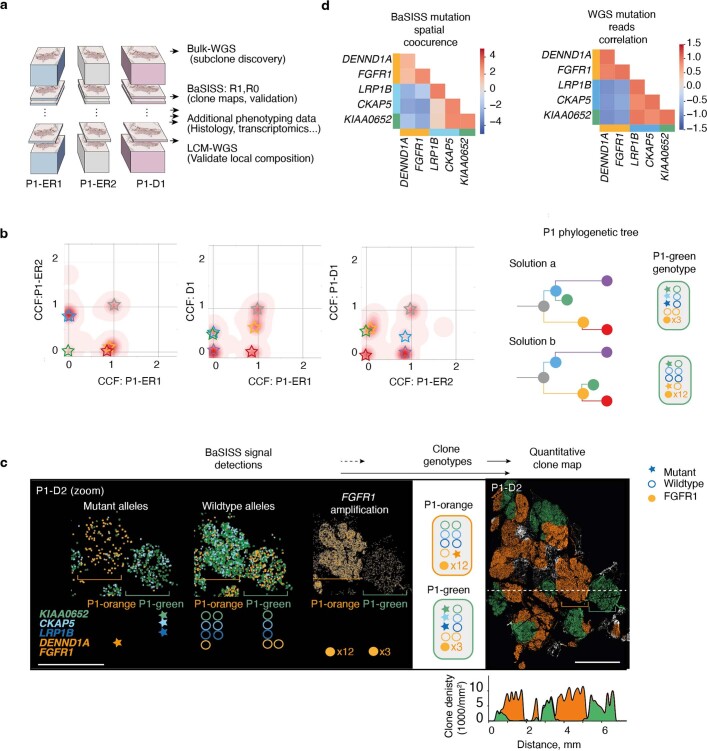
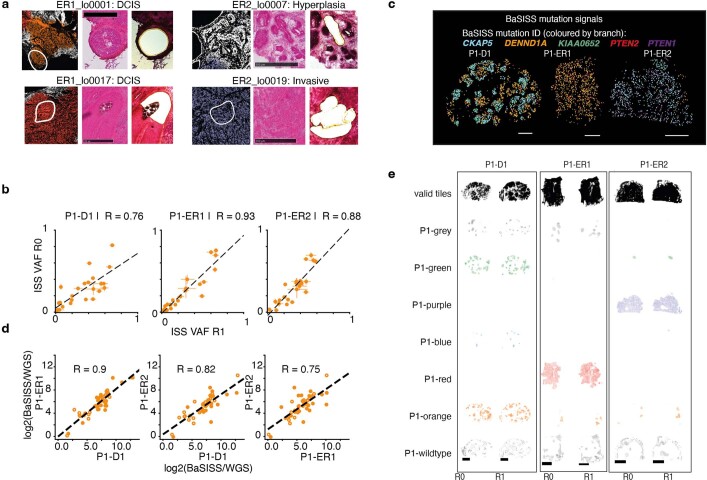
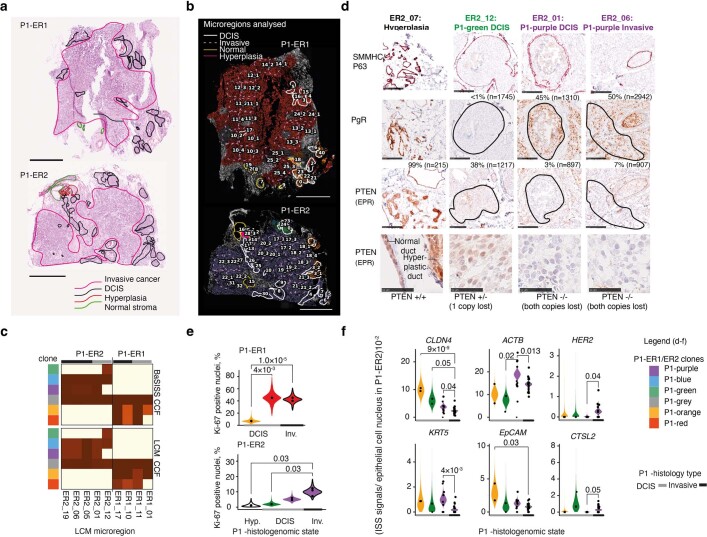
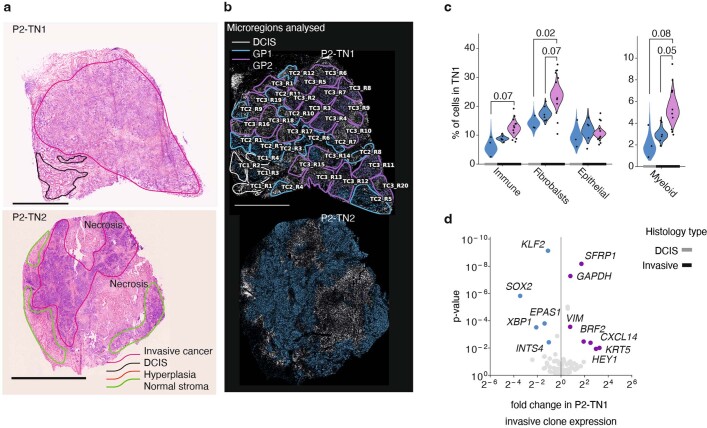
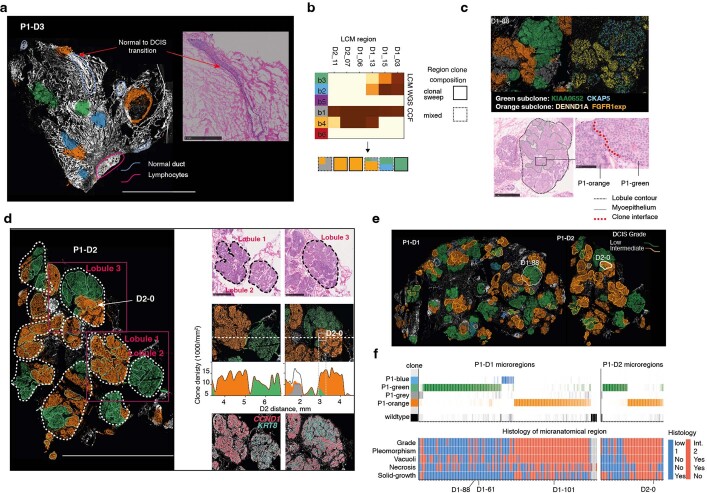
Genome sequencing of cancers often reveals mosaics of different subclones present in the same tumour1-3. Although these are believed to arise according to the principles of somatic evolution, the exact spatial growth patterns and underlying mechanisms remain elusive4,5. Here, to address this need, we developed a workflow that generates detailed quantitative maps of genetic subclone composition across whole-tumour sections. These provide the basis for studying clonal growth patterns, and the histological characteristics, microanatomy and microenvironmental composition of each clone. The approach rests on whole-genome sequencing, followed by highly multiplexed base-specific in situ sequencing, single-cell resolved transcriptomics and dedicated algorithms to link these layers. Applying the base-specific in situ sequencing workflow to eight tissue sections from two multifocal primary breast cancers revealed intricate subclonal growth patterns that were validated by microdissection. In a case of ductal carcinoma in situ, polyclonal neoplastic expansions occurred at the macroscopic scale but segregated within microanatomical structures. Across the stages of ductal carcinoma in situ, invasive cancer and lymph node metastasis, subclone territories are shown to exhibit distinct transcriptional and histological features and cellular microenvironments. These results provide examples of the benefits afforded by spatial genomics for deciphering the mechanisms underlying cancer evolution and microenvironmental ecology.


Conflict of interest statement

J.S. is now (but was not at the time of contribution to this manuscript) an employee of Spatial Transcriptomics, Part of 10X Genomics, Inc. Y.S.J. is co-founder of Genome Insight. C.S. is co-owner of HistoOne AB, and has research contracts with Prelude Dx. M.N. is an advisor to 10X Genomics. All other authors declare no competing interests.

Figures

Fig. 1
Fig. 1. The BaSISS workflow to generate cancer clone maps.
a, Following de novo mutation detection and subclone discovery in WGS data, the BaSISS workflow is performed as follows: (1) bespoke mutation-specific padlock probes are designed. (2) BaSISS transcripts are detected. To achieve this, BaSISS padlock probes hybridize to complementary DNA (cDNA) in situ. By virtue of a highly specific DNA ligase, only completely target-complementary padlock probes are ligated and form closed circles. Ligated probes are amplified through rolling circle amplification and their reader barcodes are detected in tissue space through sequencing by ligation with fluorophore-labelled interrogation probes and cyclical microscopy. (3) Mathematical modelling of BaSISS signals and the genotype of clones is then performed to derive clone maps. (4) Subsequent phenotype and microenvironment characterization of clones is then possible, by integrating clone fields with spatial datasets acquired from serial tissue sections. The BaSISS model and cell typing are described further in Extended Data Figs. 1 and 2. b, The two cases of multifocal primary breast cancer (PBC) used to develop the BaSISS approach. Coloured tiles report the histological features within each sample and the experiments performed. The number of clones identified by WGS and targeted by BaSISS are reported as white numerals. c, The traditional histological model of breast cancer progression. DCIS, ductal carcinoma in situ; H&E, haematoxylin and eosin; LN, lymph node; NST, invasive carcinoma of no special type; TME, tumour microenvironment.
Fig. 2
Fig. 2. Converting BaSISS spatial signals into maps of clones.
a, Bar plots of cancer cell fractions (CCFs) derived from bulk WGS of the P1 samples. b, Phylogenetic tree reconstructed from multiregional bulk WGS data from P1 (see Supplementary Methods for details). Each branch is labelled with the total number of WGS mutations defining the branch (grey text) and the number of BaSISS probes designed to target that branch (black text). c, Three heatmaps of variant allele fractions (VAFs) calculated using data derived from n = 11 regions of P1-ER1 and P1-ER2 (marked in d). Raw BaSISS VAFs (for each target mutation the number of mutant signals divided by total number of mutant plus wild-type signals) (top) and model-imputed BaSISS VAFs (middle) are derived from raw BaSISS signal data within these regions. In serial tissue cryosections, corresponding z-stack regions were identified and subjected to LCM–WGS. Resulting LCM–WGS VAFs are presented (bottom). Mean per-gene correlations are approximately 0.41 and 0.90 for BaSISS to LCM–WGS and model-imputed VAFs to LCM–WGS comparisons, respectively. Sample names are coloured according to the dominant BaSISS subclone in the sampled region. Each row represents a targeted mutation. The mutations plotted in d are labelled by their gene name; for PTEN there are two separate mutations. d, Spatial BaSISS detections of barcodes reporting on five selected mutations, coloured according to their targeted branch. White contours indicate LCM regions (relates to c). e, BaSISS clone maps in physical space projected on the DAPI image (nuclei are white), derived using BaSISS mathematical modelling of signals from 45 informative targets. Each clone has a different colour, and dominant clones are reported (shown if the CCF is more than 25% and the inferred local cell density is more than 300 cells per mm2). Scale bars, 2.5 mm (d,e). Source data
Fig. 3
Fig. 3. Genetic clones mapped in histological context from three PBCs.
a, BaSISS maps of two PBCs from P1 with intermixed DCIS and invasive cancer. The most prevalent genetic clone is projected as a coloured field (corresponds to b) on DAPI images (reported if the CCF is more than 25% and the inferred local cell density is more than 300 cells per mm2). Scale bar, 2.5 mm. Pie charts report the WGS-estimated clone composition of P1-ER1 and P1-ER2. Inset images (right) are regions of P1-ER2 (H&E-stained serial tissue sections) that represent three histological progression states. Scale bar, 250 µm. b, The phylogenetic tree was inferred from P1 multiregion WGS: branches are scaled according to and annotated with the number of WGS mutations and driver mutation-containing genes. Branches and nodes are coloured to reflect the clones mapped in a. Heatmaps report clone composition in 34 and 44 histologically annotated epithelial-containing microregions of P1-ER1 and P1-ER2, respectively. Microregions include individual ducts or randomly selected similarly sized regions of invasive cancer (see Extended Data Figs. 4b and 5b and the web browser https://www.cancerclonemaps.org/ for microregion details). HP, hyperplasia; N, normal ducts. c,d, IHC in P1-ER1 (c) and P1-ER2 (d) for the proliferative marker Ki-67 in six clone territories (indicated by contour colour); the percentage of nuclei staining positive (brown) is reported. Scale bars, 250 µm. e, As in a, but a clone map of P2-TN1. Scale bar, 2.5 mm. Mini-images report ISS-derived cell types (right) and H&E tissue section snapshots of the two cancer growth patterns (GP1 and GP2) reported in P2-TN1 (left). Scale bar, 250 μm. f, Phylogenetic tree for P2 and heatmap of 36 P2-TN1 microregions, as in b. Branches relating to clones not detected in this sample (that is, only found in P2-LN1) are shaded grey. The bottom heatmap is the estimate by the histopathologist and reports the contribution of different growth patterns to the microregion, defined by distinct nuclear and architectural features (Supplementary Methods). Source data
Fig. 4
Fig. 4. Growth patterns and histological associations of DCIS clones.
a, BaSISS maps of pure DCIS samples: P1-D1 and P1-D2. The most prevalent genetic clone is projected as a coloured field (which corresponds to b) on DAPI images (reported if the CCF is more than 25% and the inferred local cell density is more than 300 cells per mm2). Scale bar, 5 mm. The quantitative, continuous nature of these data can be examined via an interactive web browser (https://www.cancerclonemaps.org/). The pie chart reports the WGS-estimated clone composition of P1-D1. The white dashed contours delineate morphologically defined lobules. The beige contours mark 114 and 40 manually selected microregions in P1-D1 and P1-D2, respectively, the clonal composition of which is reported by the heatmaps in b. Microregions were manually selected and represent single or small groups of intimately related acini or ductules from the same lobule. b, The phylogenetic tree was inferred from P1 multiregion WGS: branches are scaled according to and annotated with the number of WGS mutations and driver mutation-containing genes. Branches and nodes are coloured to reflect the clones mapped in a. Only branches detected in P1-D1 and P1-D2 are coloured. WT, wild type. c, Cartoon of a lobe of the breast with normal anatomy (left) and DCIS (right), with lobules exhibiting monoclonal and polyclonal involvement. d, H&E images report representative subclone histological features in regions selected from a. Scale bars, 100 µm and 50 µm (vacuoles). e, Stacked bar plot summarizes histological features of microregions dominated by P1-green (n = 66) or P1-orange (n = 72). Nuclear pleomorphism is a measurement of the amount of variability in size and shape of the nuclei and is a major determinant of the histological grade. Source data
Fig. 5
Fig. 5. Intrinsic and extrinsic features of metastatic subclones in a lymph node.
a, BaSISS map of P2-LN1, which relates to P2-TN1 (Fig. 3e) and P2-TN2 (Extended Data Fig. 6a,b). The most prevalent genetic clone colours are projected as coloured fields on the DAPI image (reported if the CCF is more than 25%; a threshold of 5% is used in regions of diffusely infiltrating blue to allow visualization in very high normal contamination regions). Scale bar, 2.5 mm. Coloured contours define microregions with distinct metastatic cancer growth patterns (M-GP1 and M-GP2); ‘+’ indicates the surrounding sinus epithelium. b, Plots of the genomic structures in P2-blue and P2-orange clones in the vicinity of the HER2 gene, derived from WGS data of P2-TN2 and P2-LN1. Vertical lines represent genomic rearrangement breakpoints coloured by the phylogenetic tree branch where the event occurred. Dots represent local (binned) copy number. HER2 amplification, CACNB1 fusion and HER2 mutation are BaSISS targets used to track this complex event. BFB, breakage fusion bridge. c, Representative areas of the two main growth patterns stained with H&E. Scale bar, 100 µm. d, Phylogenetic tree inferred from P2 multiregion WGS. Branch and node colours inform the clones mapped in a. The top heatmap reports the BaSISS clone contribution to 39 histologically annotated microregions from a (regions with 5% or more tumour cells are included); see https://www.cancerclonemaps.org/. The bottom heatmap reports microregion histological features. Pan-CK, pan-cytokeratin. e, Volcano plot of immune cell expression of the 62 genes in the ISS immune panel. f, Volcano plot of epithelial cell expression of the 91 genes in the ISS immune panel. Significantly (FDR > 0.1), differentially expressed (fold change of more than 1.5 both ways) genes are coloured. g, Violin plots depict clone-specific cell-type contribution posterior density of the generalized linear mixed model with region-specific random effect, and includes the 22 clone territories with a dominant clone fraction of more than 0.05 in P2-LN1. Significant comparisons were controlled for FDR using the Benjamini–Hochberg procedure. Source data
Extended Data Fig. 1
Extended Data Fig. 1. Mathematical modelling BaSISS data.
Mathematical model for generating quantitative clone maps. The essential idea is that the BaSISS signals count matrix D is decomposed into maps of clones M each with a distinct genotype G (grey shading), accounting for multiple sources of variability. For further details see Supplementary Methods.
Extended Data Fig. 2
Extended Data Fig. 2. Hierarchical cellular typing workflow.
a, Scatterplots of between sample log2-fold change of gene expression derived from RNAseq and combined ISS oncology and immune experiments. Correlations indicate that the probes are on-target. Included genes are those with transcripts per million (TPM) > 25 in RNAseq and 1000 detections per million cells in ISS whose deviation due to low counts would be negligible, R = Pearson’s correlation coefficient. b, Marker genes for the cell typing were selected using hierarchical logistic regression. The input datasets are the targeted ISS oncology and immune panels. If nuclei have marker ISS signals within 5 μm from their centre, the corresponding cell types were assigned. At first iteration, nuclei were classified into 3 broad categories (Immune, Epithelial and Stromal). At the second iteration, nuclei with Immune and Stromal assignments were further subdivided into (B-cells, Myeloid and T-cells) and (CAF/PVL, Endothelial) groups. The identity of nuclei that did not have any marker genes in proximity or had a contradictory assignment was considered unknown. PVL = perivascular-like. c, Mean expression of the genes used in ISS immune and oncology panels was calculated from the breast cancer single cell RNA sequencing (scRNA) reference (derived from Wu et al. Nature Genetics, 2021) to aid interpretation of the observed ISS signal distribution. Source data
Extended Data Fig. 3
Extended Data Fig. 3. BaSISS resolves ambiguous WGS derived clonal architectures.
a, Cartoon illustrating tissue block handling for P1. b, Density plots of WGS derived point mutation, cancer cell fraction (CCF) estimates from pairs of samples (see Supplementary Methods for details). Mutation clusters are denoted by coloured stars. The two phylogenetic tree solutions most compatible with the mutation cluster CCFs are presented alongside their respective inferred P1-green genotypes. c, BaSISS signal detections in approximately 3 mm2 region of D2 (repeated x3, left), exhibit co-occurrence and segregation patterns of both wild-type and mutant alleles that support the phylogenetic tree solution ‘a’. Sample D2 clone map (right) with frequency plot (below) of local, mean clone composition, corresponding to horizontal dashed line. The quantitative, continuous nature of these data can be examined more fully via the interactive web browser https://www.cancerclonemaps.org/. d, Spatial co-occurrence matrix of BaSISS mutant allele signals from P1-D1 (top) and LCM-WGS read correlations from 6 microdissected regions of P1-D1/P1-D2 reveal the same co-occurrence patterns that support tree solution ‘a’. Source data
Extended Data Fig. 4
Extended Data Fig. 4. Validation of the BaSISS workflow.
a, Four examples of BaSISS clone map regions (left) (see Fig. 2e) selected for laser capture microdissection (LCM) and whole genome sequencing (WGS) validation. Corresponding regions in z-stack tissue sections stained with H&E before (middle) and after (right) LCM. Scale bar = 500 um. b, Scatterplots of BaSISS variant allele fractions (VAF) defined as the number of mutation specific signals divided by mutation plus wildtype signals (depth) for each mutation target between replicate BaSISS experiments. Data are presented as mean estimates and 95% HPDI. c, Replicate BaSISS experiments (relates to Fig. 2d). Signals for selected mutations are coloured according to branch of origin. Scale bar = 2.5 mm. d, Scatterplots of BaSISS VAFs (normalised to WGS VAFs) in related samples indicate that the BaSISS data provide a meaningful read out of genomic structure. R = Pearson’s correlation coefficient. e, BaSISS clone fields derived from replicate sequencing data: Factor 2–7 are clones corresponding to the same coloured branch. Factor 1 is residual, 8 is normal. Scale bar = 2.5 mm. Source data
Extended Data Fig. 5
Extended Data Fig. 5. Phenotype characterisation of histo-genomic states in sample P1 PBCs.
a, Broadly annotated H&E tissue sections of the P1-ER1 and P1-ER2 primary breast cancers. b, Microregions selected for detailed analysis overlaid on BaSISS maps (regions relate to heatmaps in Fig. 3a; numbers relate to histological annotations in Supplementary Table 2). c, Comparison of the cancer cell fractions (CCF) of 9 regions of P1-ER1/P1-ER2 determined through both BaSISS (top) and laser capture microdissection (LCM) whole genome sequencing (WGS) (bottom). d, Snapshots of immunohistochemistry (IHC) staining in serial fresh frozen tissue cryosections from P1-ER2. Selected regions with confirmed clone compositions (by LCM WGS) are presented. SMMHC/P63 antibody stains myoepithelial cells red, PTEN protein and the progesterone receptor (PR) stain brown. % reports proportion of positive nuclei stained, n reports number of nuclei in region assessed by QuPath digital software. Row 1–3 scale bars = 250 um. Row 4 scale bar = 50 um. e, Violin plots depict clone specific Ki67 IHC staining rate posterior density of the generalised linear mixed model (glmm) with region specific random effect. Significant comparisons were controlled for FDR using the BH procedure. Analysis was limited to the 11 regions with confirmed clone compositions by WGS due to variation between IHC and BaSISS sections in z-stack morphology (relates to Fig. 2d). f, Violin plots depict clone specific gene expression contribution posterior density of the glmm with region specific random effect. A total of 36 regions of P1-ER2 with a dominant clone fraction > 0.7 were analysed. Significant comparisons were controlled for FDR using the BH procedure. DCIS = Ductal carcinoma in situ. Source data
Extended Data Fig. 6
Extended Data Fig. 6. Ecosystem characterisation in P2-TN1.
a, Haematoxylin and eosin (H&E) stained sections of the two primary breast cancers from case P2. b, Microregions selected for detailed analysis overlaid on BaSISS maps (regions relate to heatmaps in Fig. 3a; numbers relate to histological annotations in Supplementary Table 2). Microregions were not defined for P2-TN2 as a single clone was targeted and detected. c, Cell type contribution posterior density of the generalised linear mixed models (glmm) model with region specific random effect. Significant comparisons were controlled for FDR using the BH procedure. 19 clone territories (with dominant clone fraction > 0.1) were analysed. Fibroblasts and perivascular-like cells (PVL) could not be differentiated within this experiment and are reported as ‘fibroblasts’. d, Volcano plot of epithelial expression of the 91 oncology ISS panel genes in TN1 invasive regions. Significance was adjusted for multiple testing using BH procedure, only genes with FDR < 0.1 and fold change > 1.5 in both ways are coloured/labelled. DCIS = Ductal carcinoma in situ. Source data
Extended Data Fig. 7
Extended Data Fig. 7. DCIS clone specific histologies.
a, BaSISS clone map of P1-D3, a sample that contains Ductal carcinoma in Situ (DCIS), stroma and normal glandular regions. The most prevalent genetic clone colour is projected as a coloured field on DAPI images (reported if cancer cell fraction > 25% and inferred local cell density > 300 cells/mm2). Scale bar = 5 mm. Inlaid, H&E stained image (from a serial tissue section) details the histological transition from normal to DCIS morphology, consistent with the clone field transition in the BASISS map (scale bar = 1 mm). b, Heatmap of cancer cell fractions (CCF) derived from LCM WGS of six regions of P1-D1/P1-D2 with cartoon of predicted clone composition indicating inference of monoclonal and polyclonal growth patterns. c, Example of a clone interface within a single sub-lobular space in P1-D1. Clone fields (top left); spatial BaSISS mutation signals (top right); characteristic histological features on H&E (bottom left) with zoom image of clone interface (scale bar = 100 um) (bottom right). d, Histological, genetic and transcriptional features of three lobules (identified on the clone map of P1-D2; left, scale bar = 5 mm) are shown: H&E staining (top) scale bar = 1 mm; BaSISS clone fields projected on DAPI with frequency plots of the local, mean cancer (coloured areas) and non-cancer (white) corresponding to horizontal dashed line (middle); and ISS gene expression signals reporting CCND1 and KRT8 that exhibit clone specific spatial patterns. e, Clone maps of P1-D1/P1-D2 (as presented in Fig. 4a) but microregions are coloured according to histological grade. f, Histopathological annotations for each microregion presented alongside the same clone composition heatmap as shown in Fig. 4b. Source data
Extended Data Fig. 8
Extended Data Fig. 8. Distinct transcriptional profiles of two DCIS clones.
a, Volcano plot of epithelial expression of the 91 oncology ISS panel genes in P1-D2. Significance was adjusted for multiple testing using BH procedure, only genes with FDR < 0.1 and fold change > 1.5 in both ways are coloured/labelled. The coloured genes are included in the by region plot in b. b, Heatmap of gene expression data within each of the 41 sampled regions in P1-D2, presented alongside the relevant clone composition regions (top) as per Fig. 4b. ISS counts in each regions are transformed by applying Poisson cdf with λ = mean (P1-green expression, P1-orange expression) × nuclei count in each region, thus divergence from 0.5 reflects deviation from the global mean expression. Only genes with FDR < 0.1 are presented and ordered by the confidence of differential. Source data
Extended Data Fig. 9
Extended Data Fig. 9. Highly recurrent clone specific ecosystems in a metastatic lymph node.
a, P2-LN1 sample (left) DAPI image with BaSISS subclone fields (as shown in Fig. 5a) and coloured squares mark regions depicted in b,c,d; (middle) pan-cytokeratin immunohistochemistry stained (IHC) (epithelial cells appear brown); (right) CD45 antibody (immune cells appear brown) with ISS immune panel derived cell types projected as coloured dots. bd, Snapshots of example regions dominated by P2-blue or P2-orange clones, as indicated in a. In each case signals (dots) from selected targets in BaSISS b, ISS oncology c or ISS immune panels d are presented overlaid on sections stained by IHC following the BaSISS/ISS experiment. In the bottom row of c and top row of d inferred epithelial and immune cell types are presented. In top rows of c and d, 80% transparency is applied to the underlying IHC image to aid visualisation of overlaid dots. e, Spatial patterns of three hypoxia related genes are projected on the entire P2-LN1 tissue section. f, Spatial patterns of PDGFRB, CD34, CD68 and hypoxia related ISS signals overlaid on HER2 (left) and CD45 IHC stained sections(right) correspond to region of white square on top left clone field image in e.

Comment in

References

    1. Gerstung M, et al. The evolutionary history of 2,658 cancers. Nature. 2020;578:122–128. - PMC - PubMed
    1. Andor N, et al. Pan-cancer analysis of the extent and consequences of intratumor heterogeneity. Nat. Med. 2016;22:105–113. - PMC - PubMed
    1. Yates LR, et al. Subclonal diversification of primary breast cancer revealed by multiregion sequencing. Nat. Med. 2015;21:751–759. - PMC - PubMed
    1. Greaves M, Maley CC. Clonal evolution in cancer. Nature. 2012;481:306–313. - PMC - PubMed
    1. McGranahan N, Swanton C. Clonal heterogeneity and tumor evolution: past, present, and the future. Cell. 2017;168:613–628. - PubMed

Publication types