. 2022 Nov;611(7936):585-593.
doi: 10.1038/s41586-022-05397-3. Epub 2022 Nov 9.

Parenchymal border macrophages regulate the flow dynamics of the cerebrospinal fluid

Collaborators, Affiliations

Parenchymal border macrophages regulate the flow dynamics of the cerebrospinal fluid

Antoine Drieu et al. Nature. 2022 Nov.

Abstract

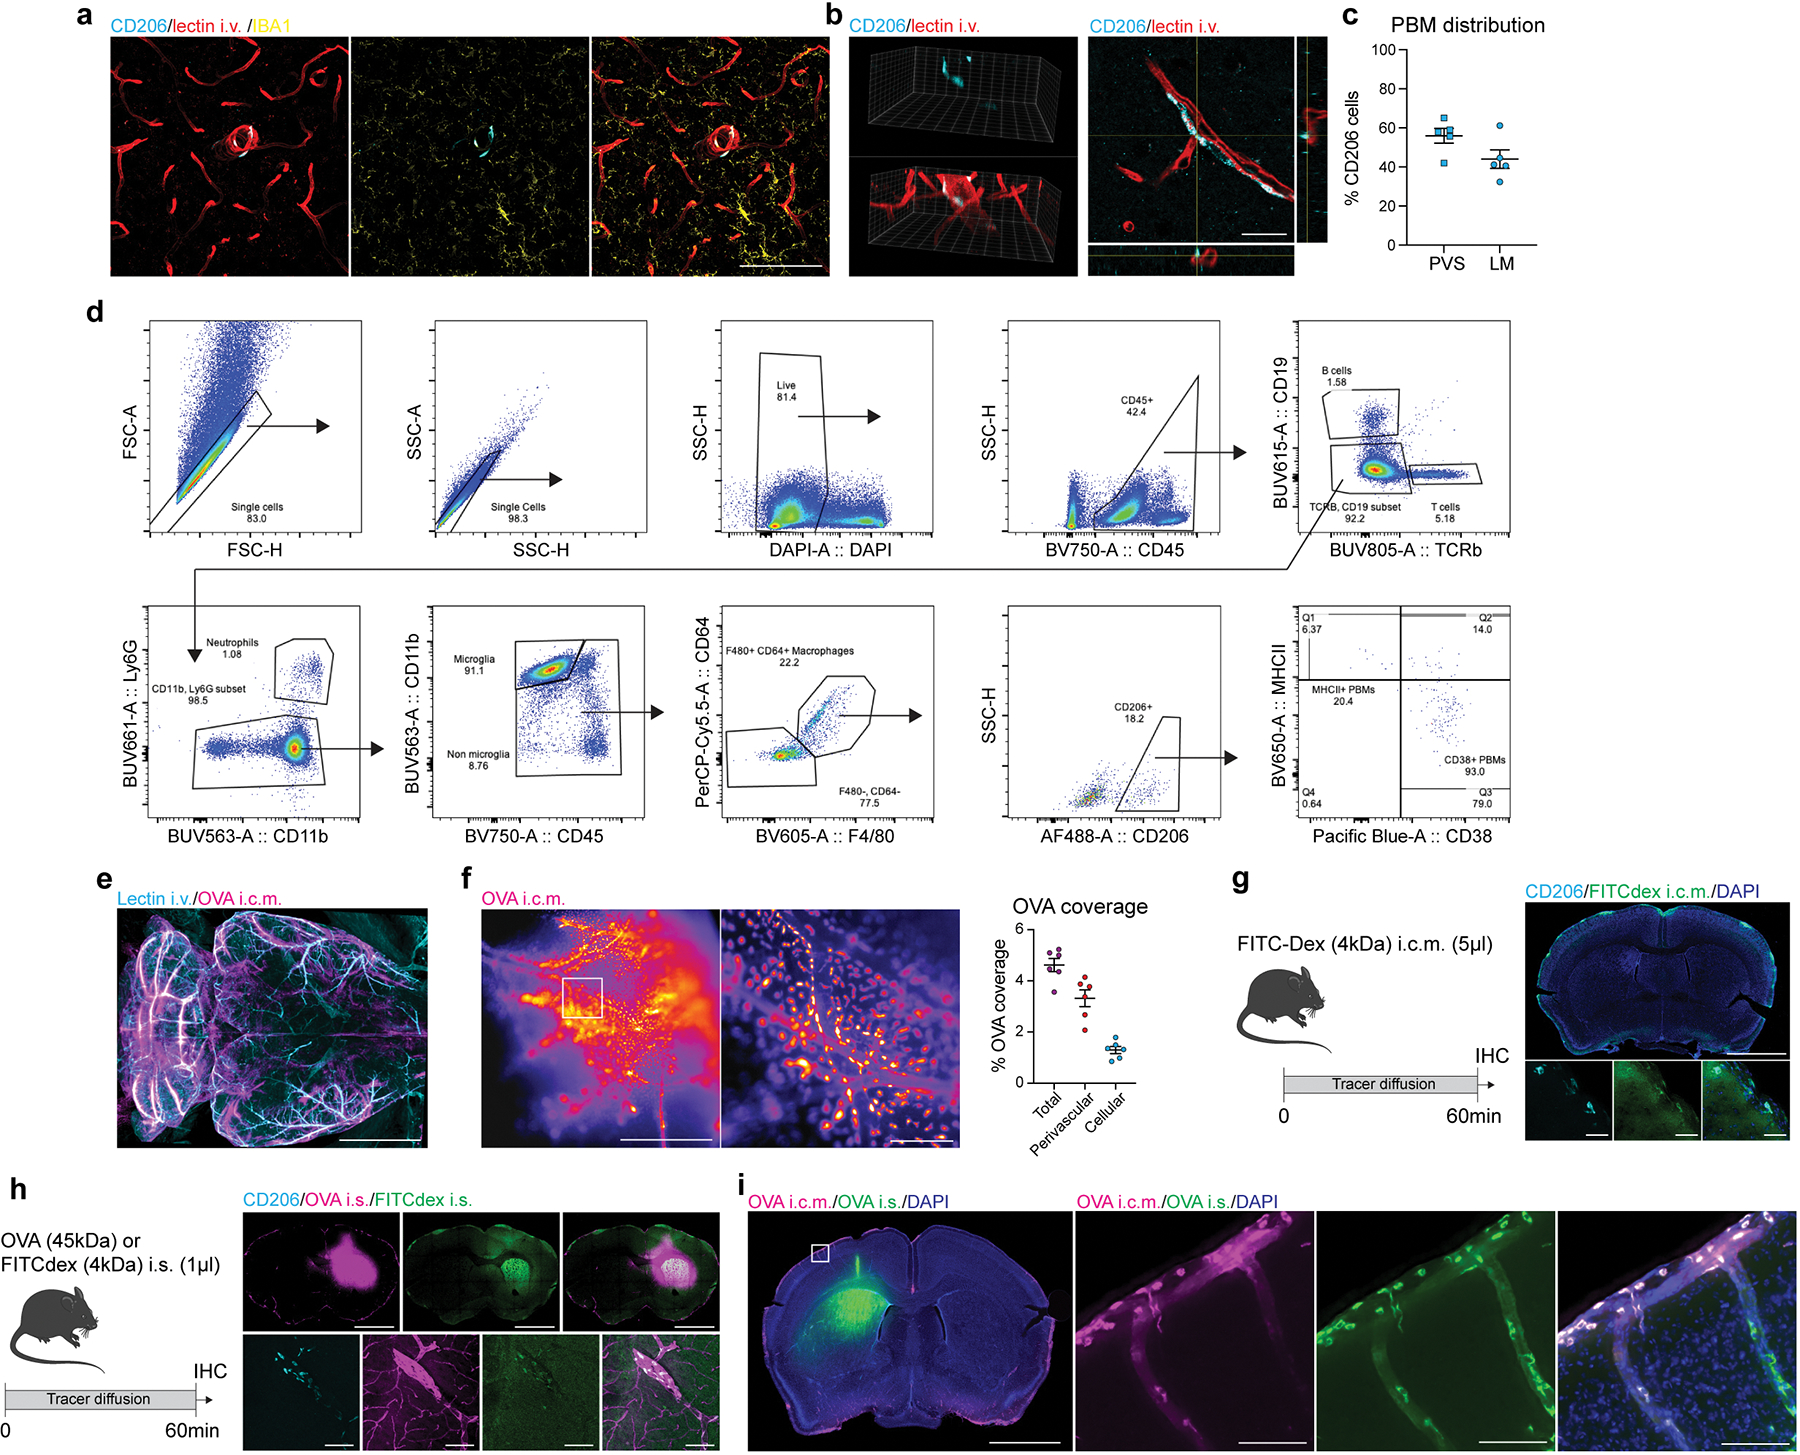
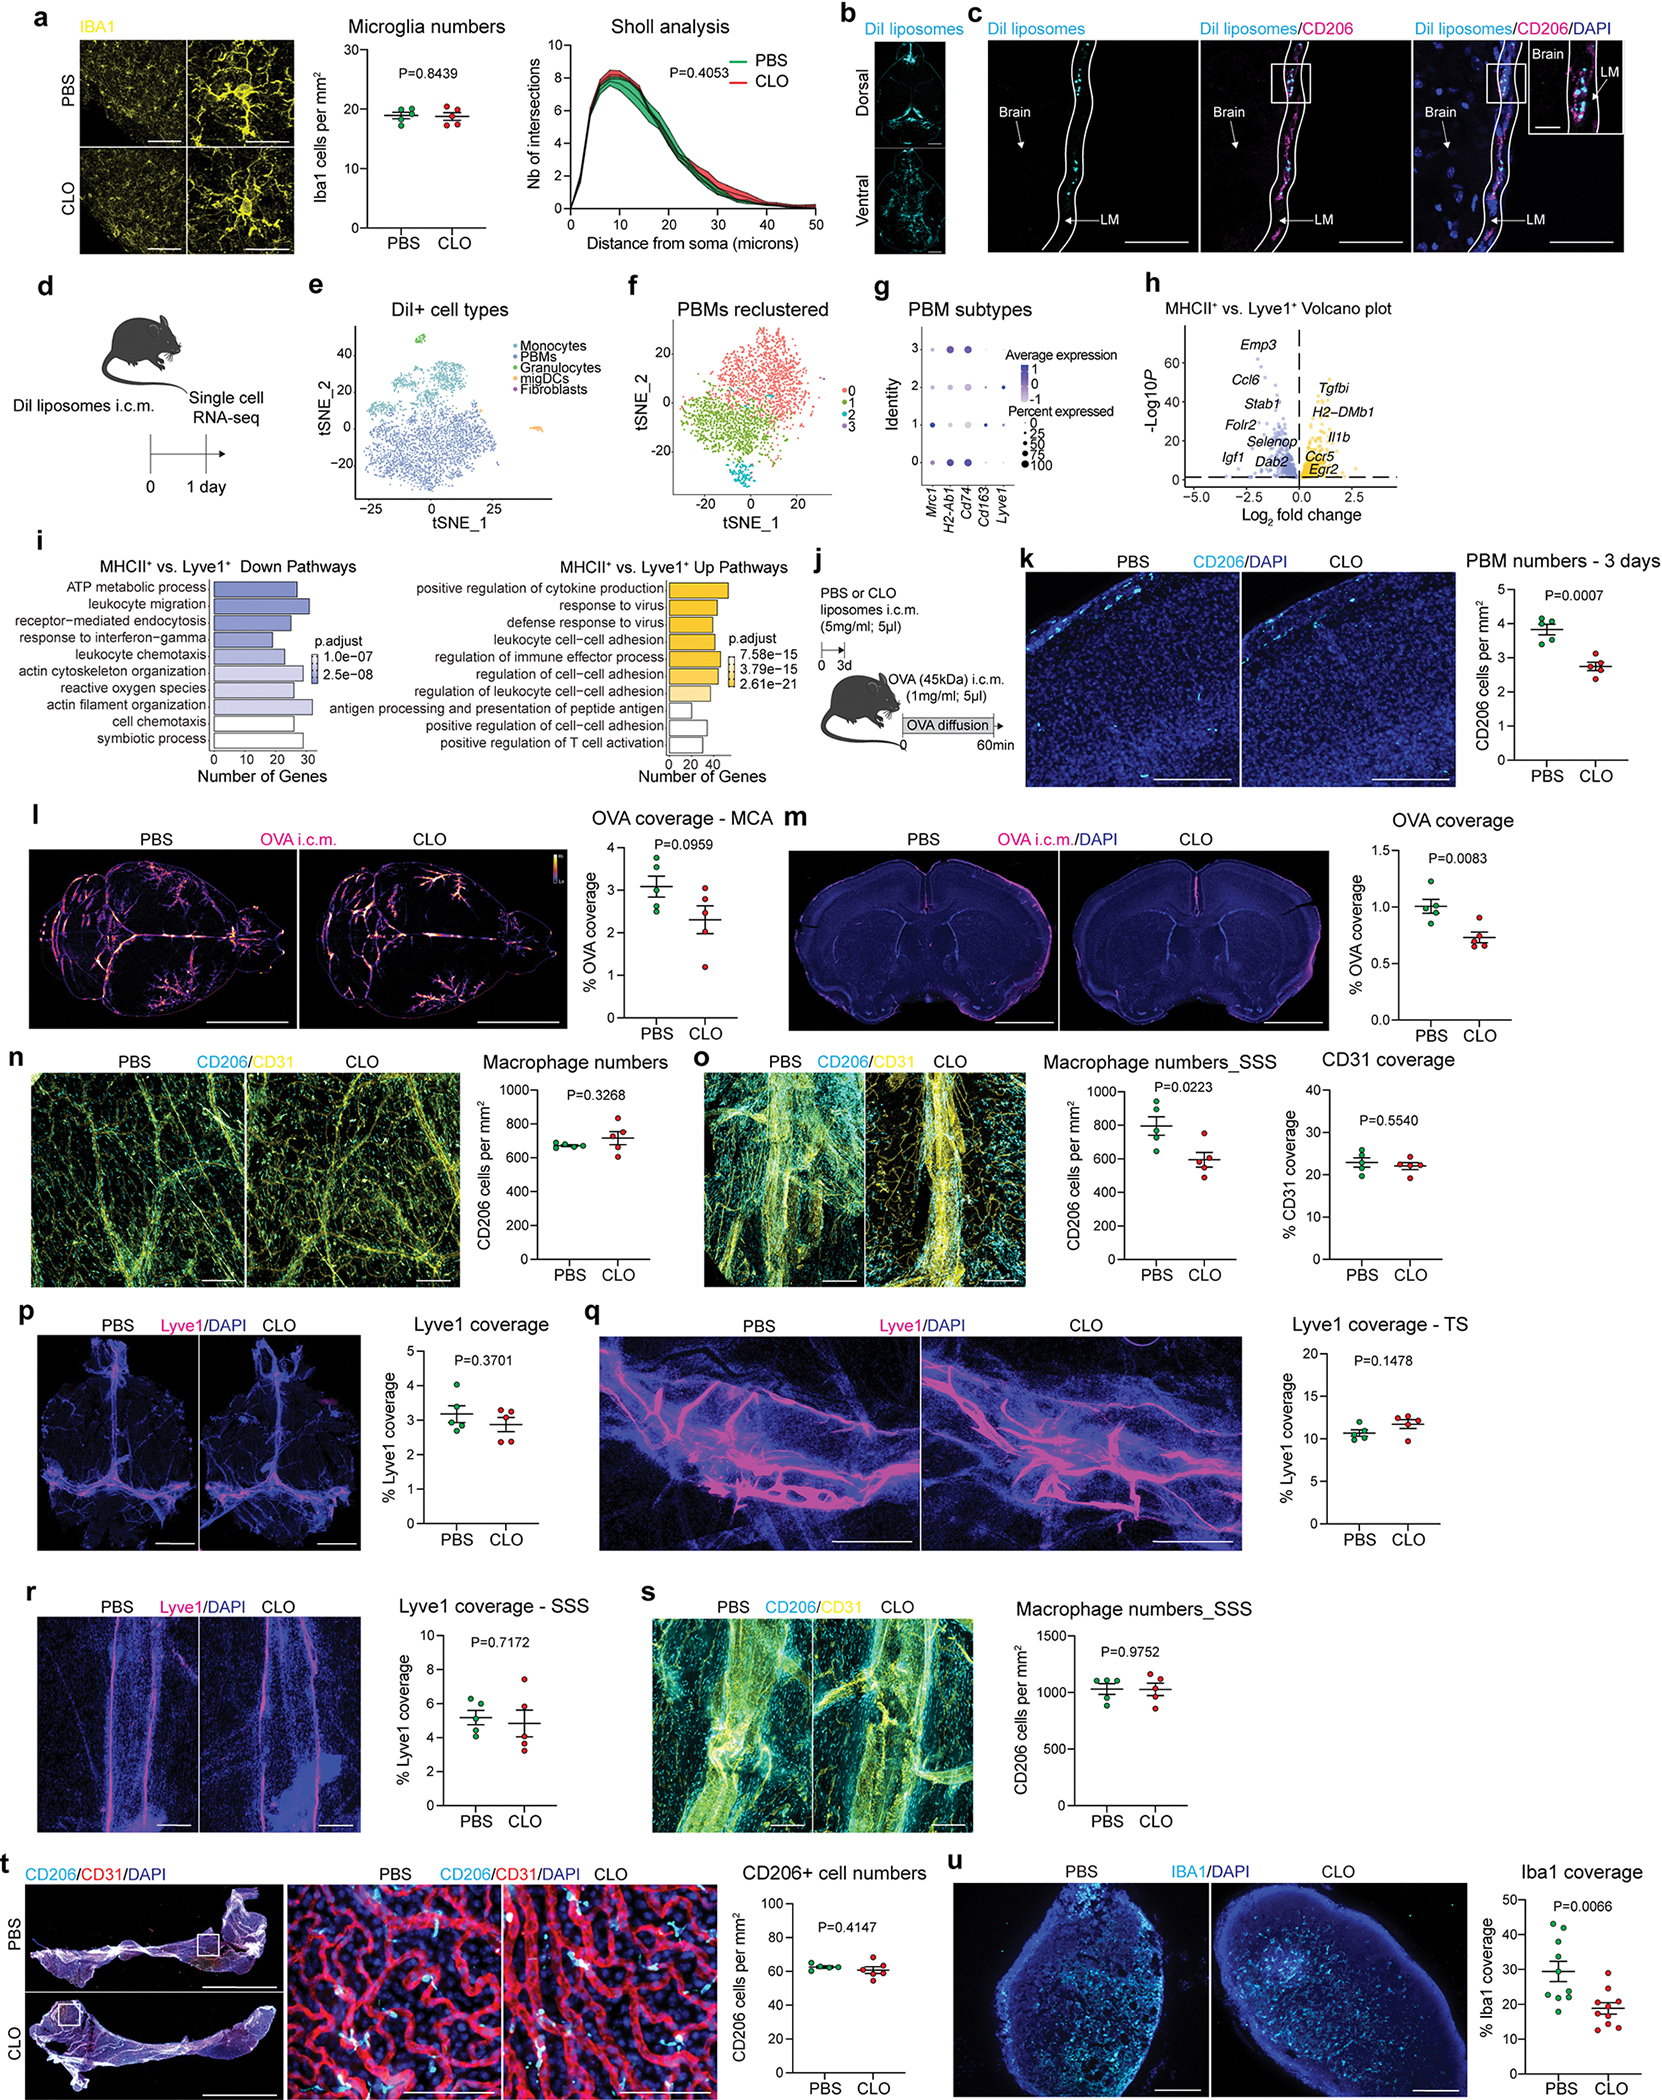
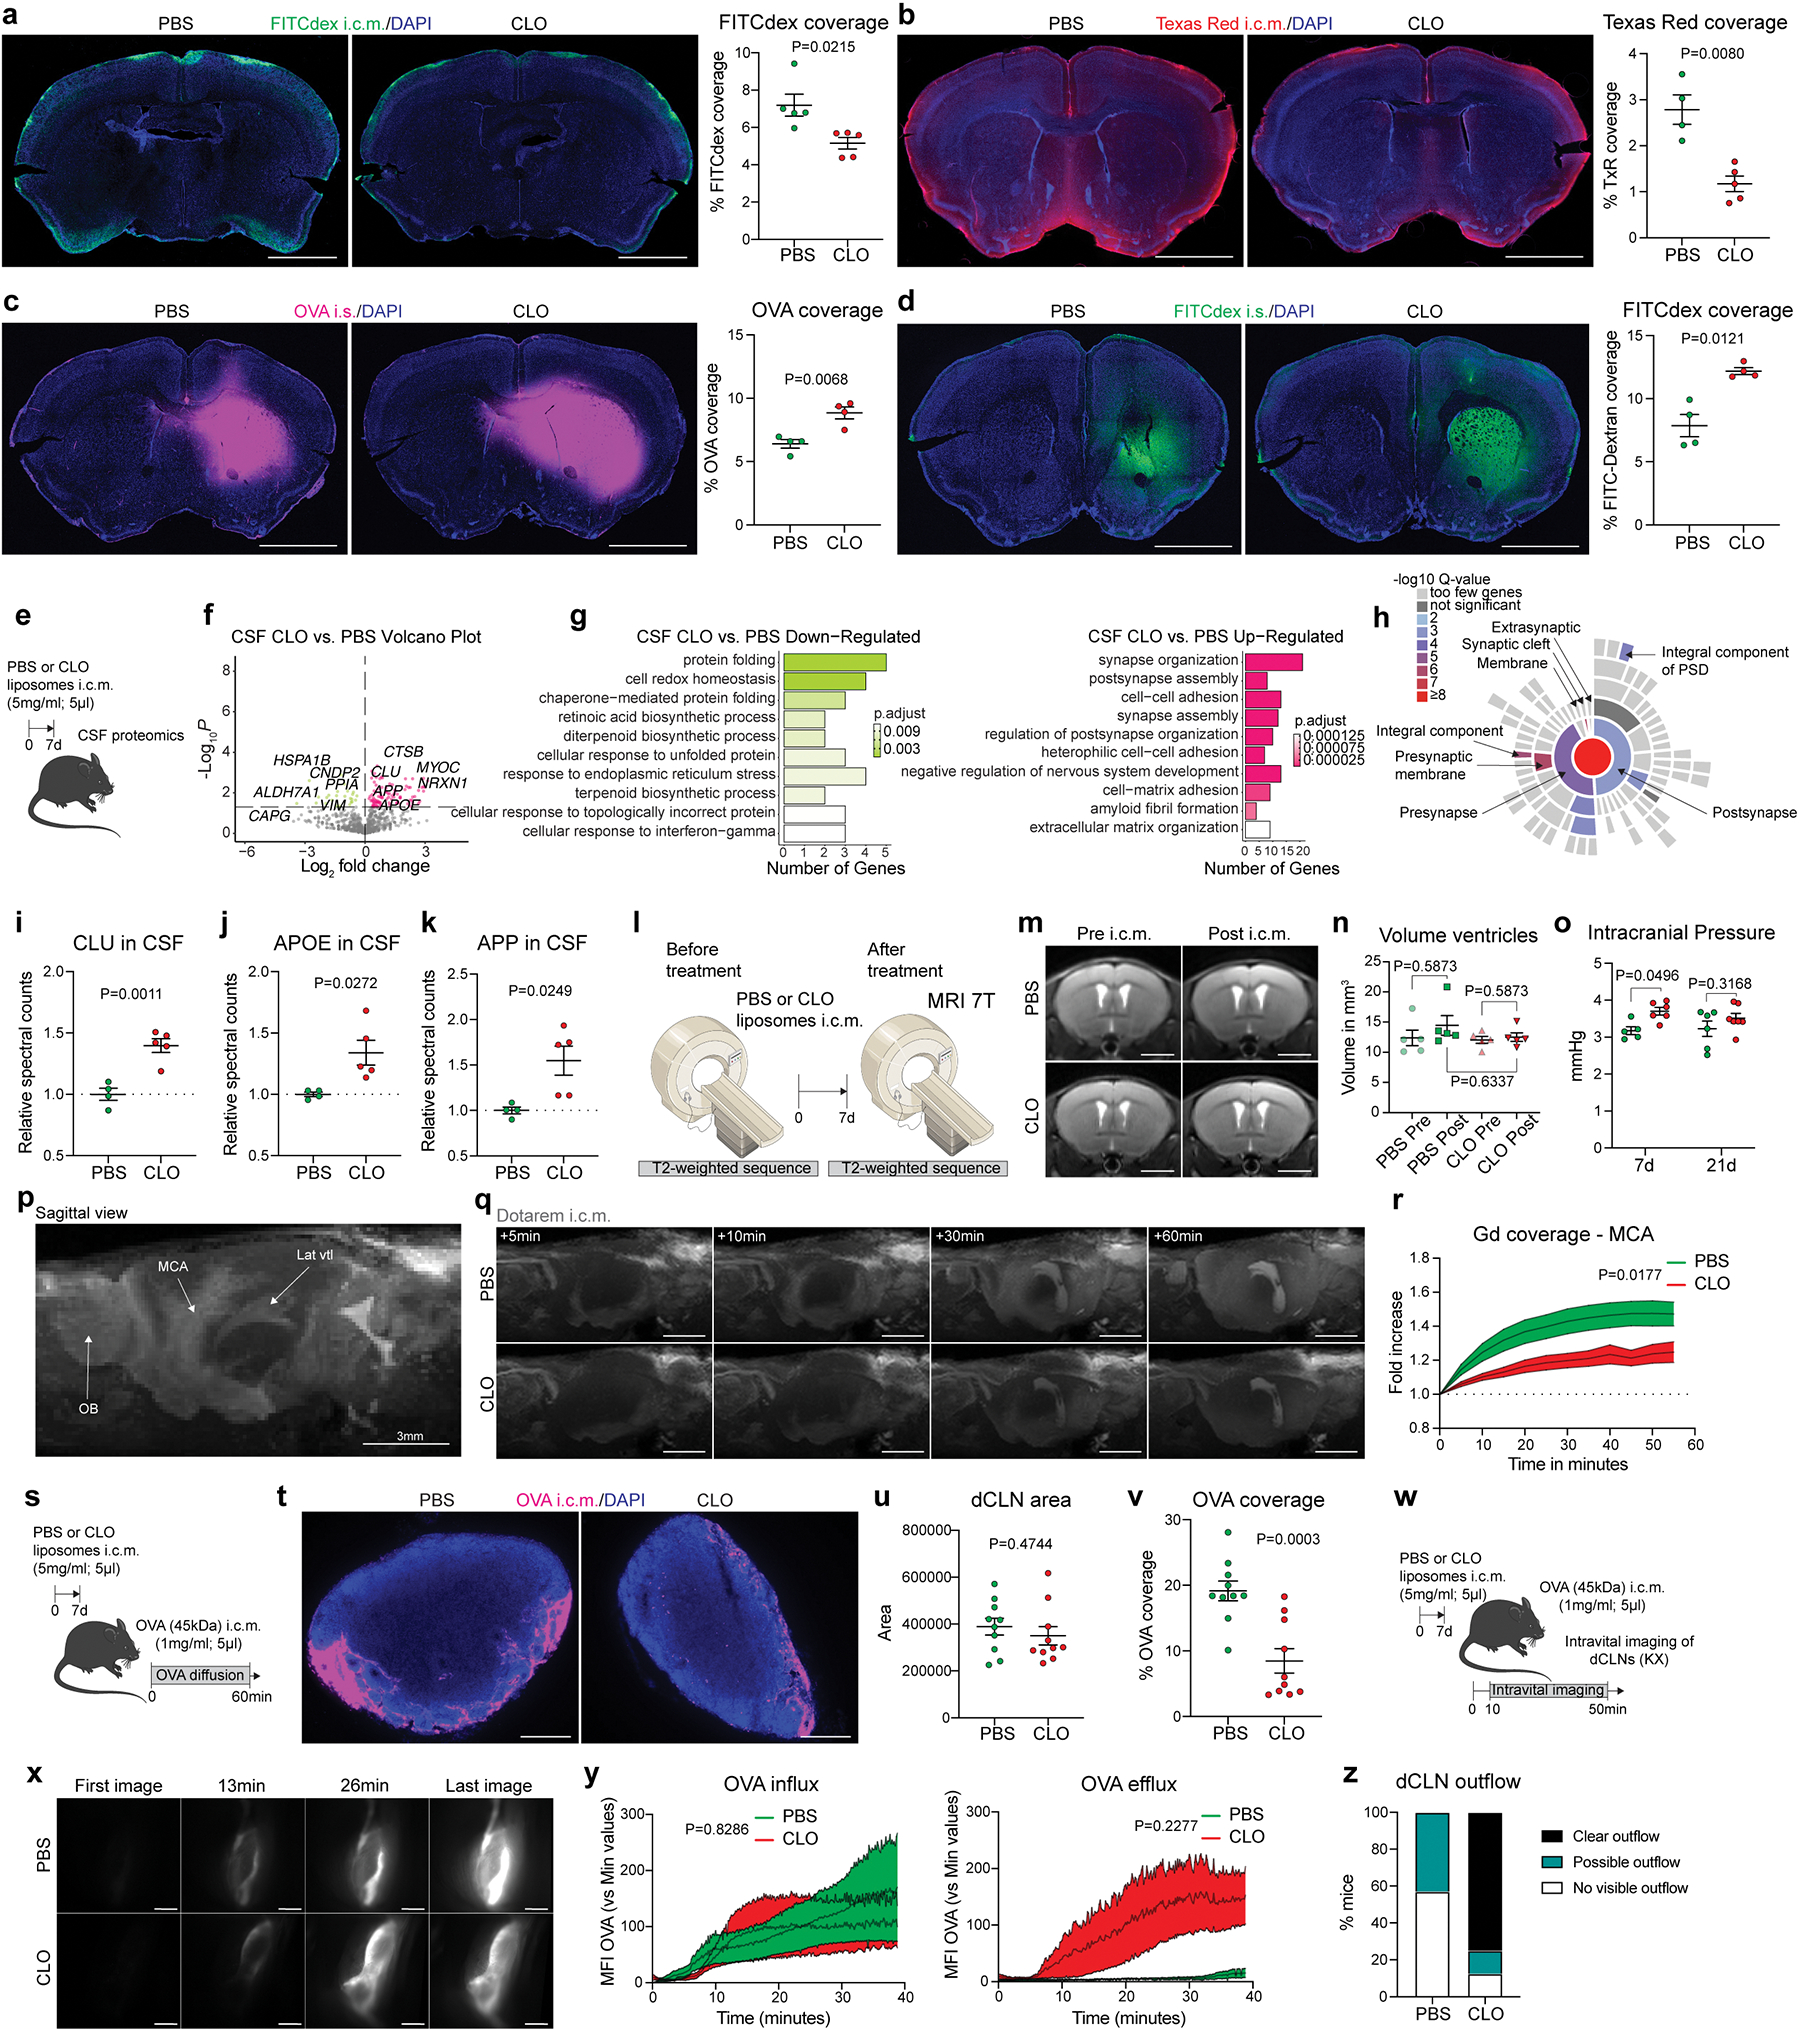
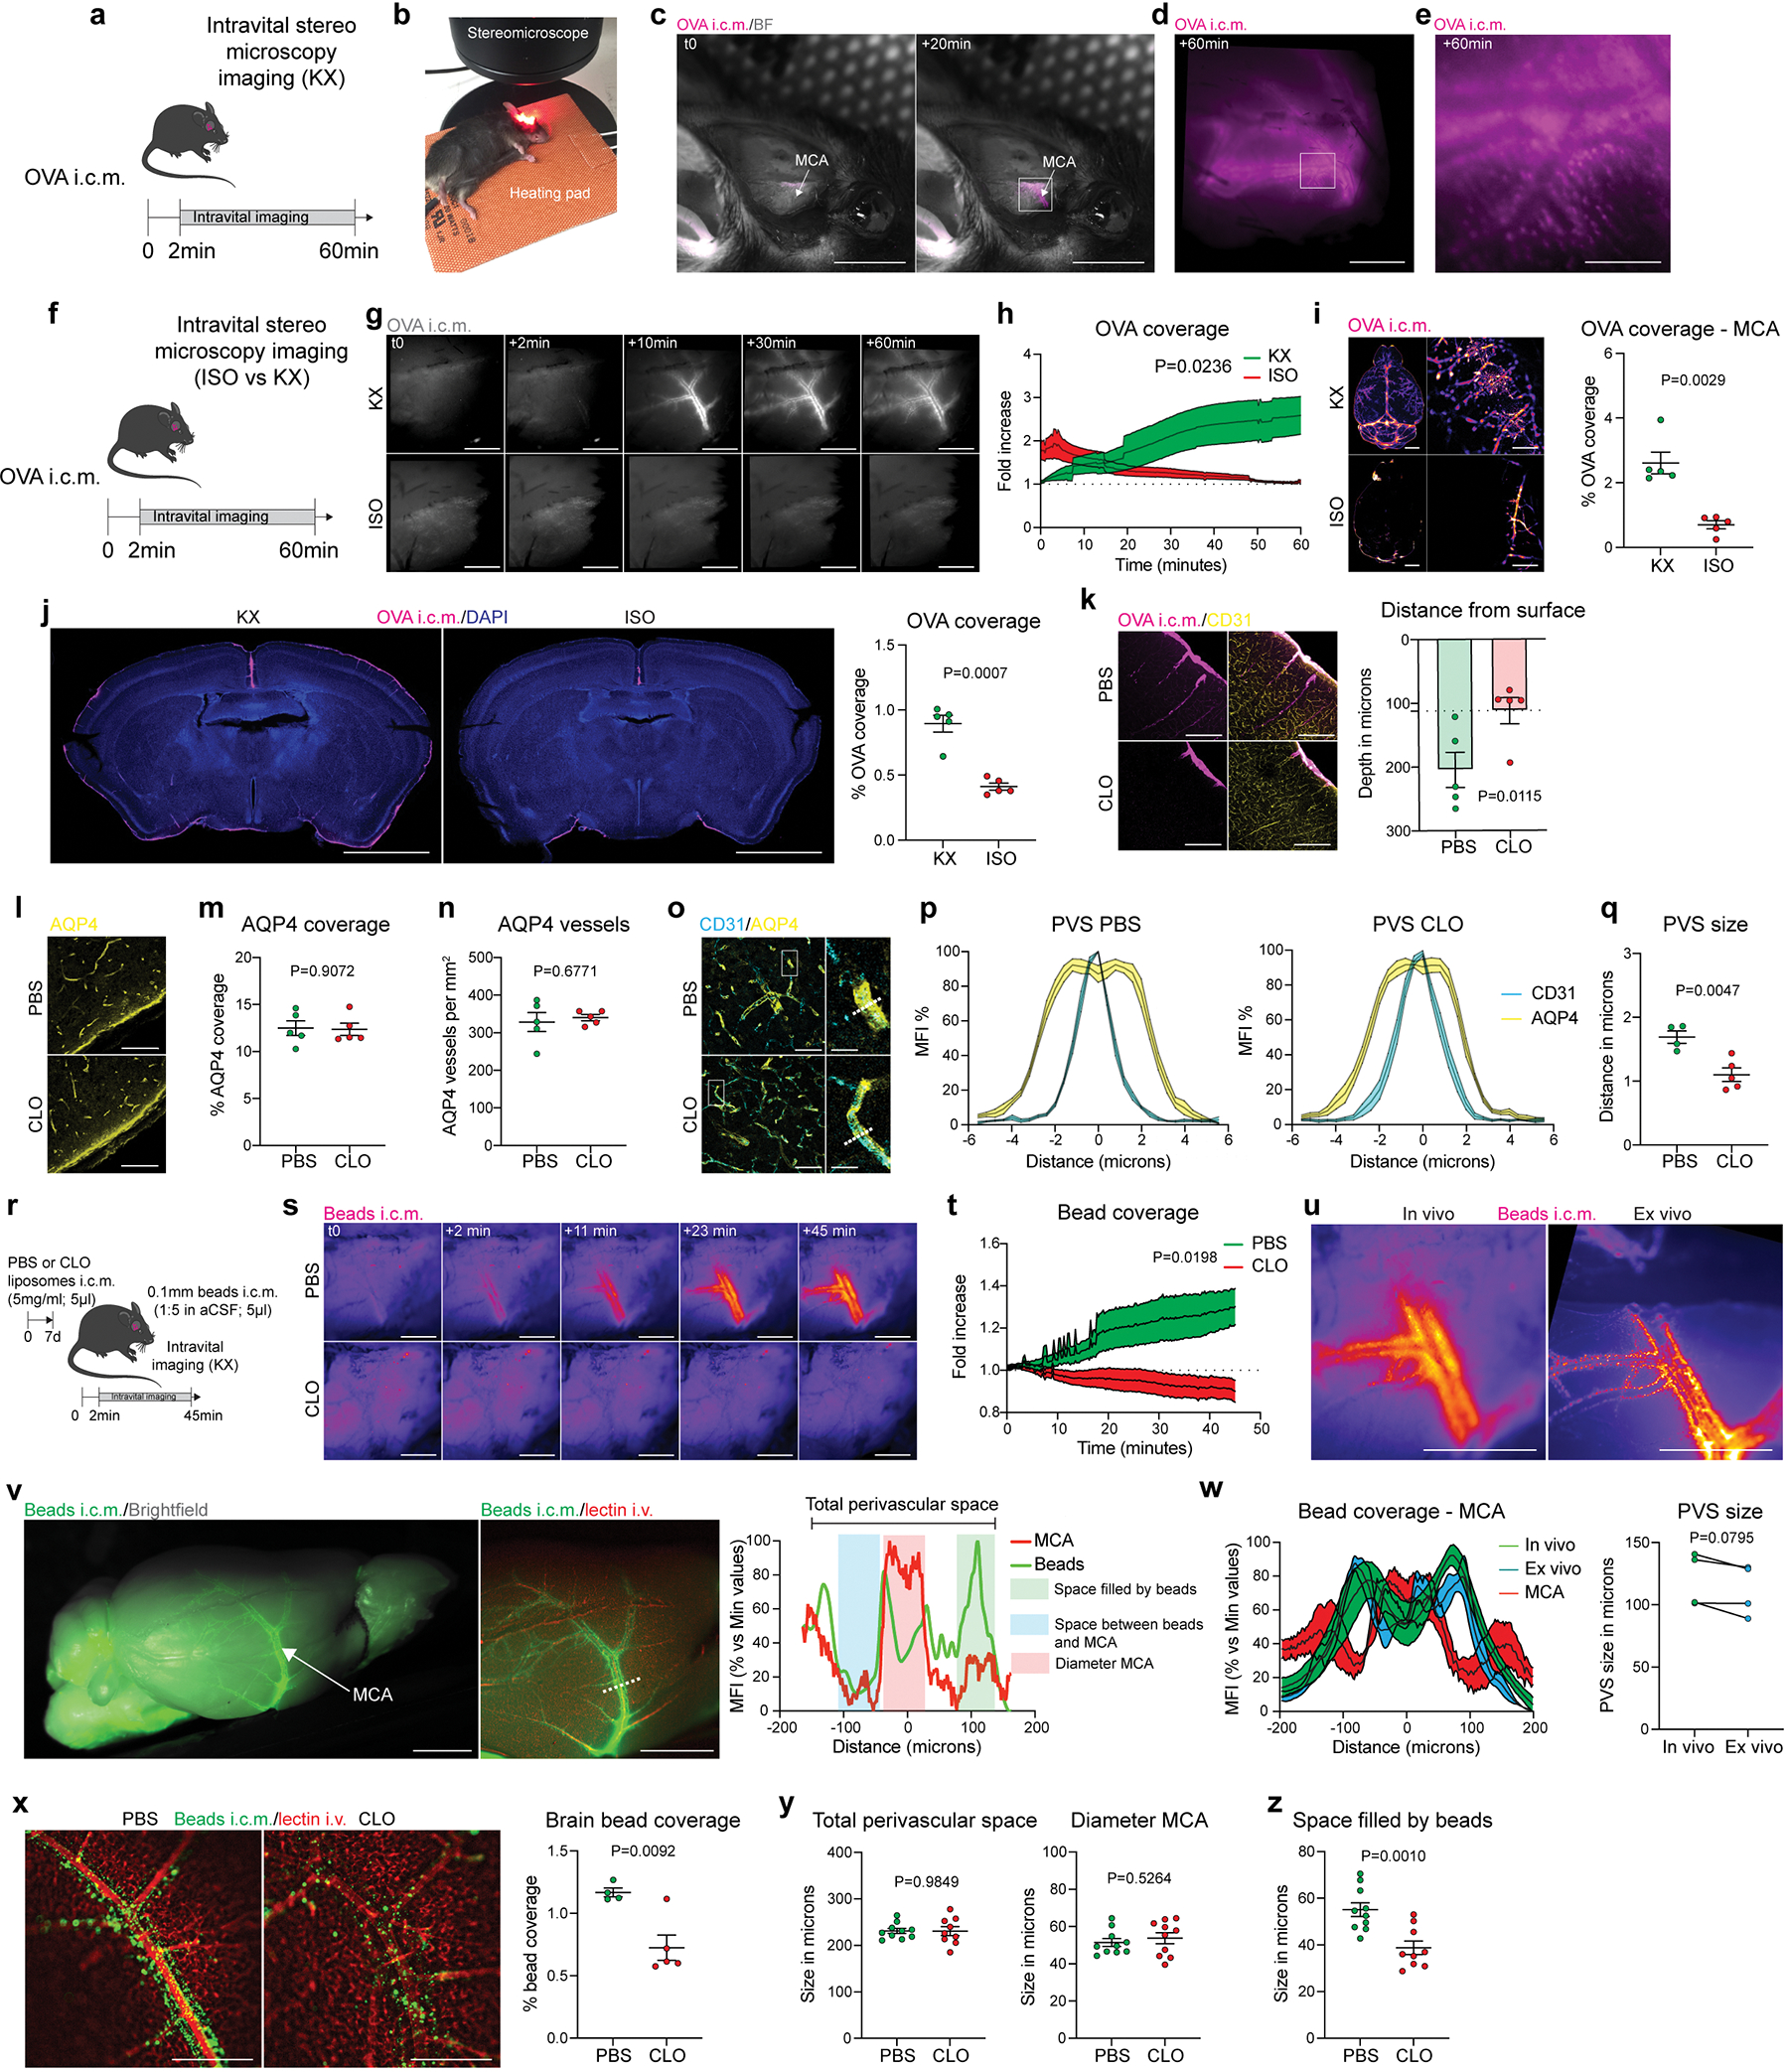
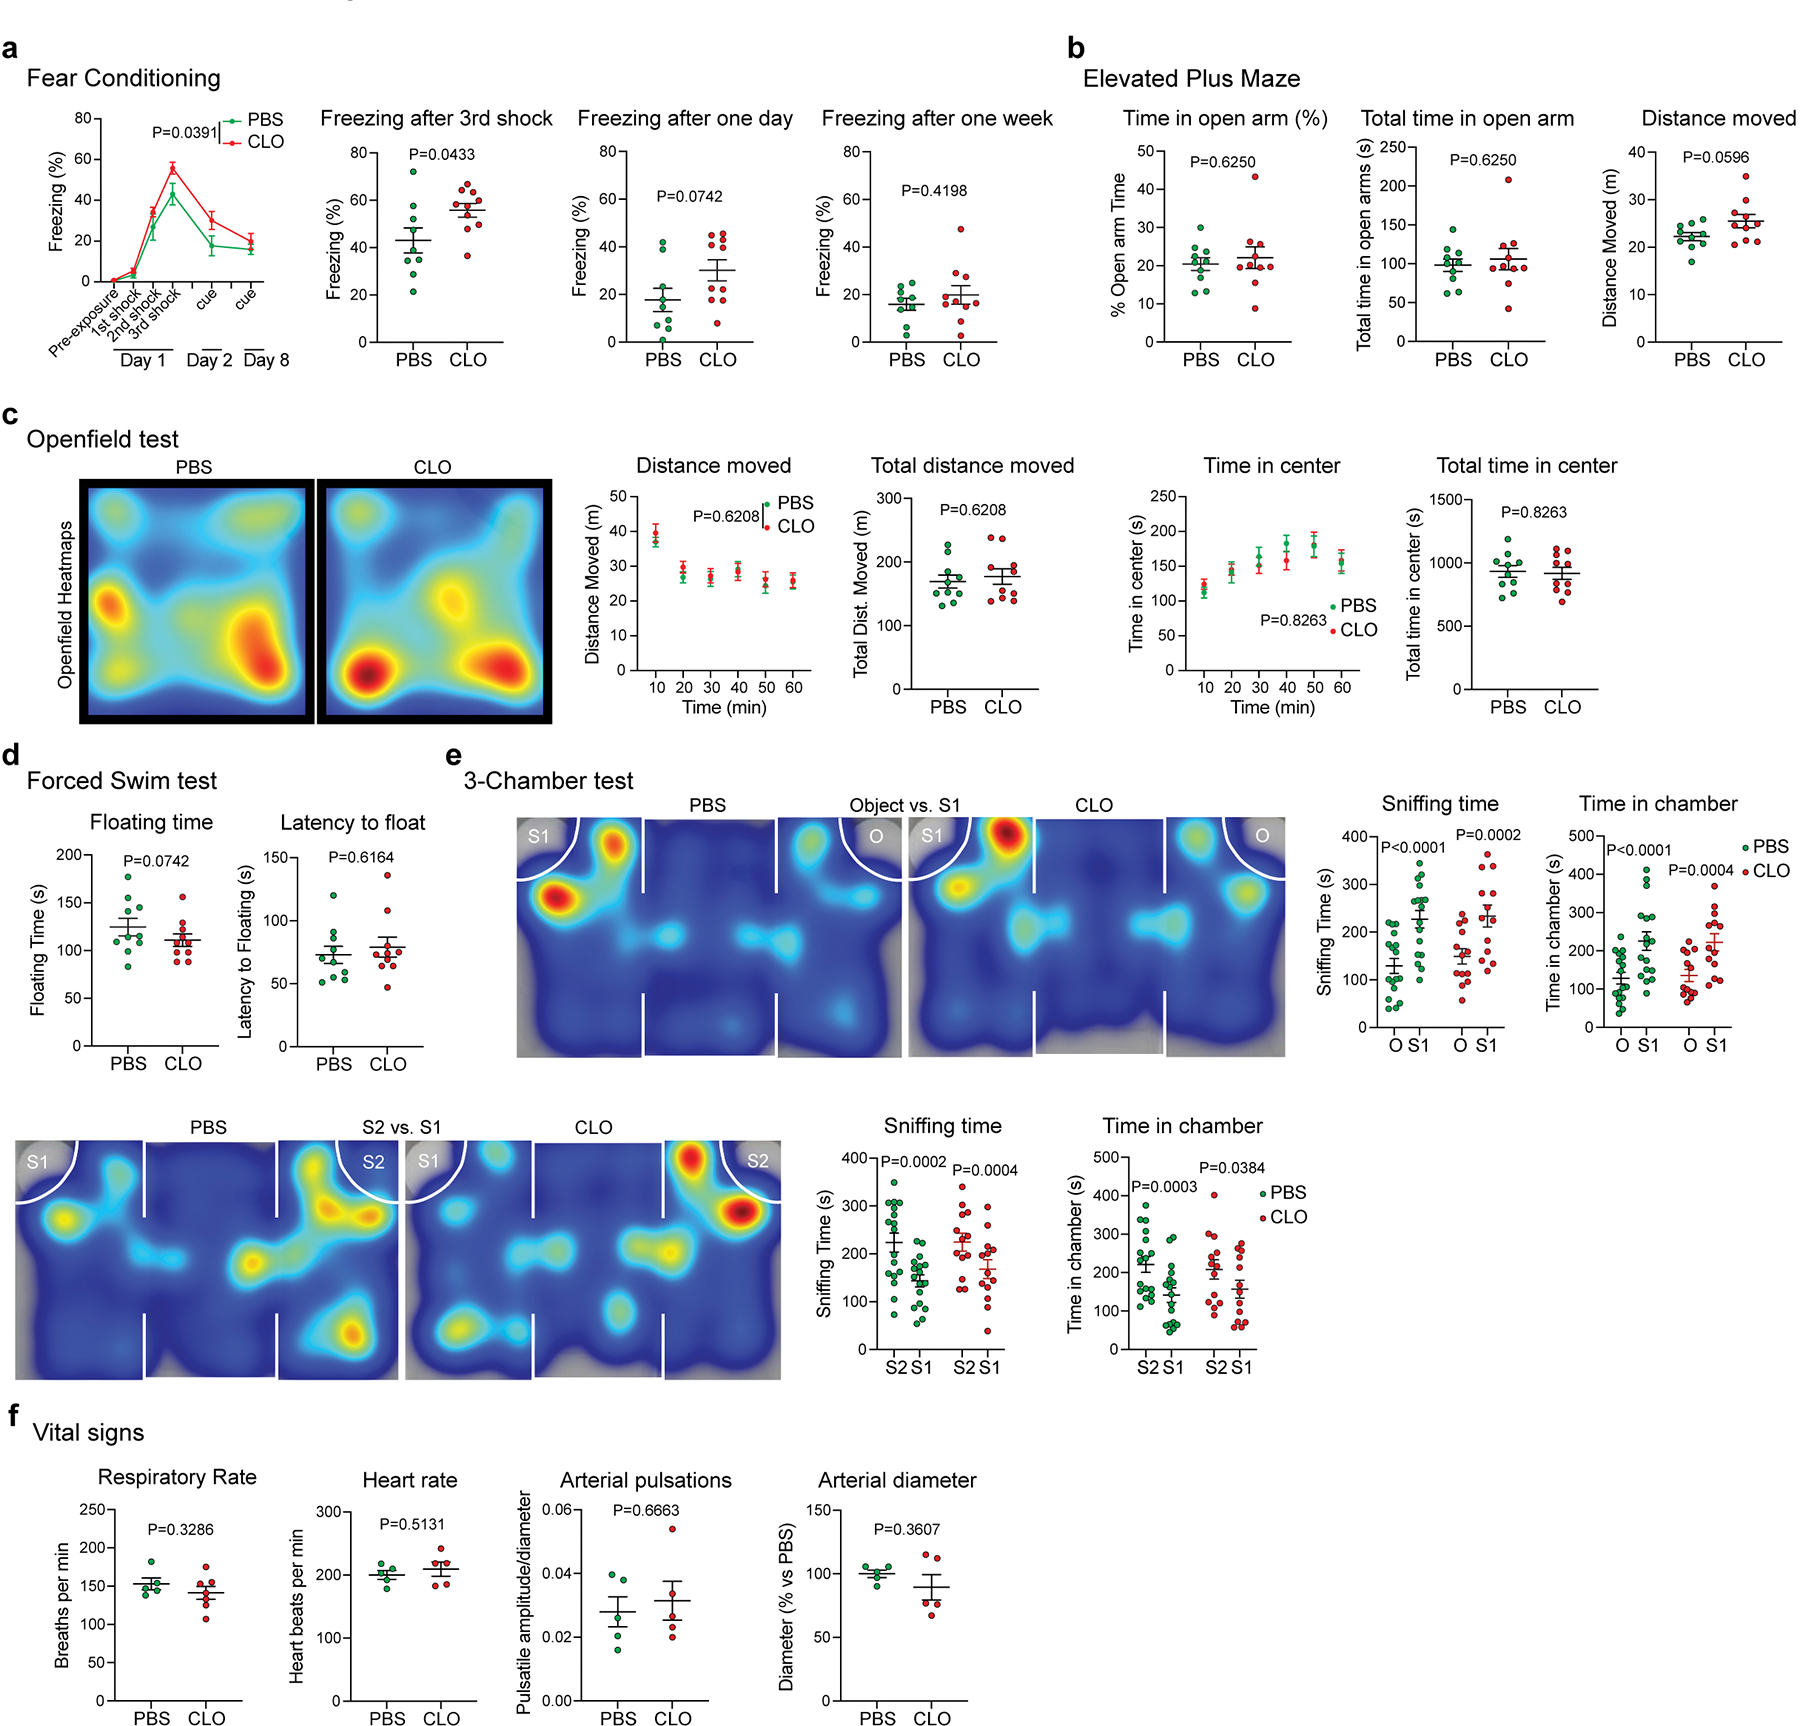
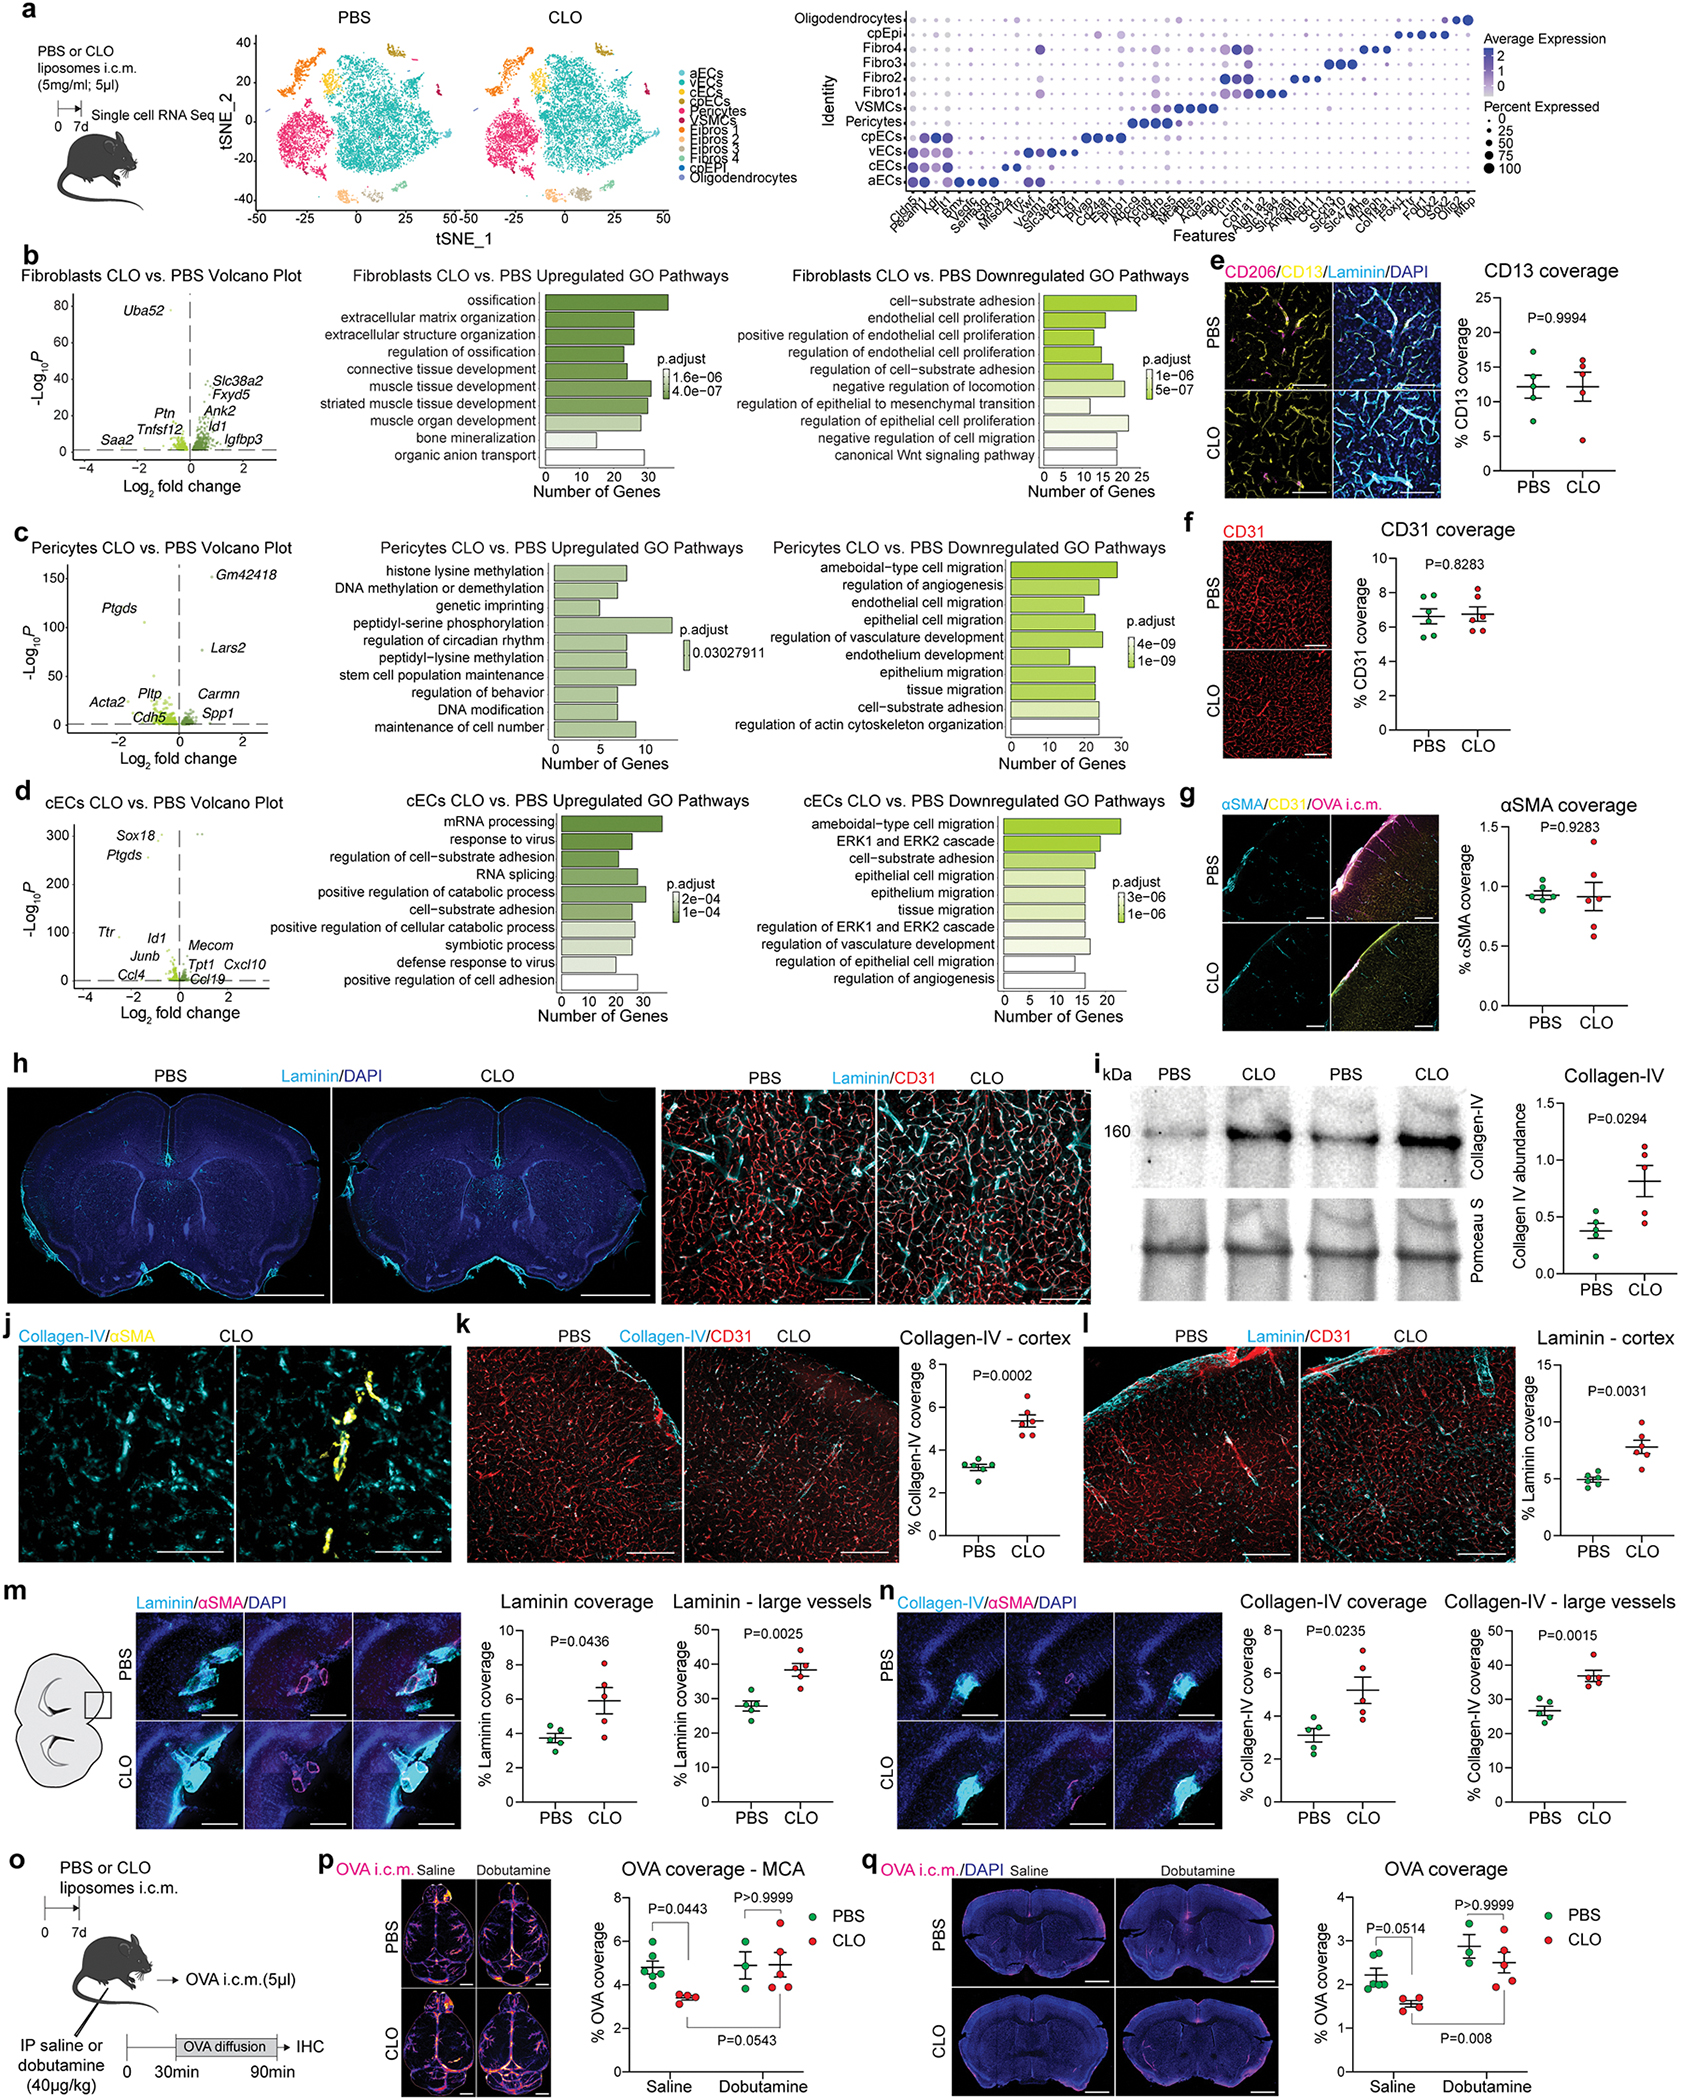
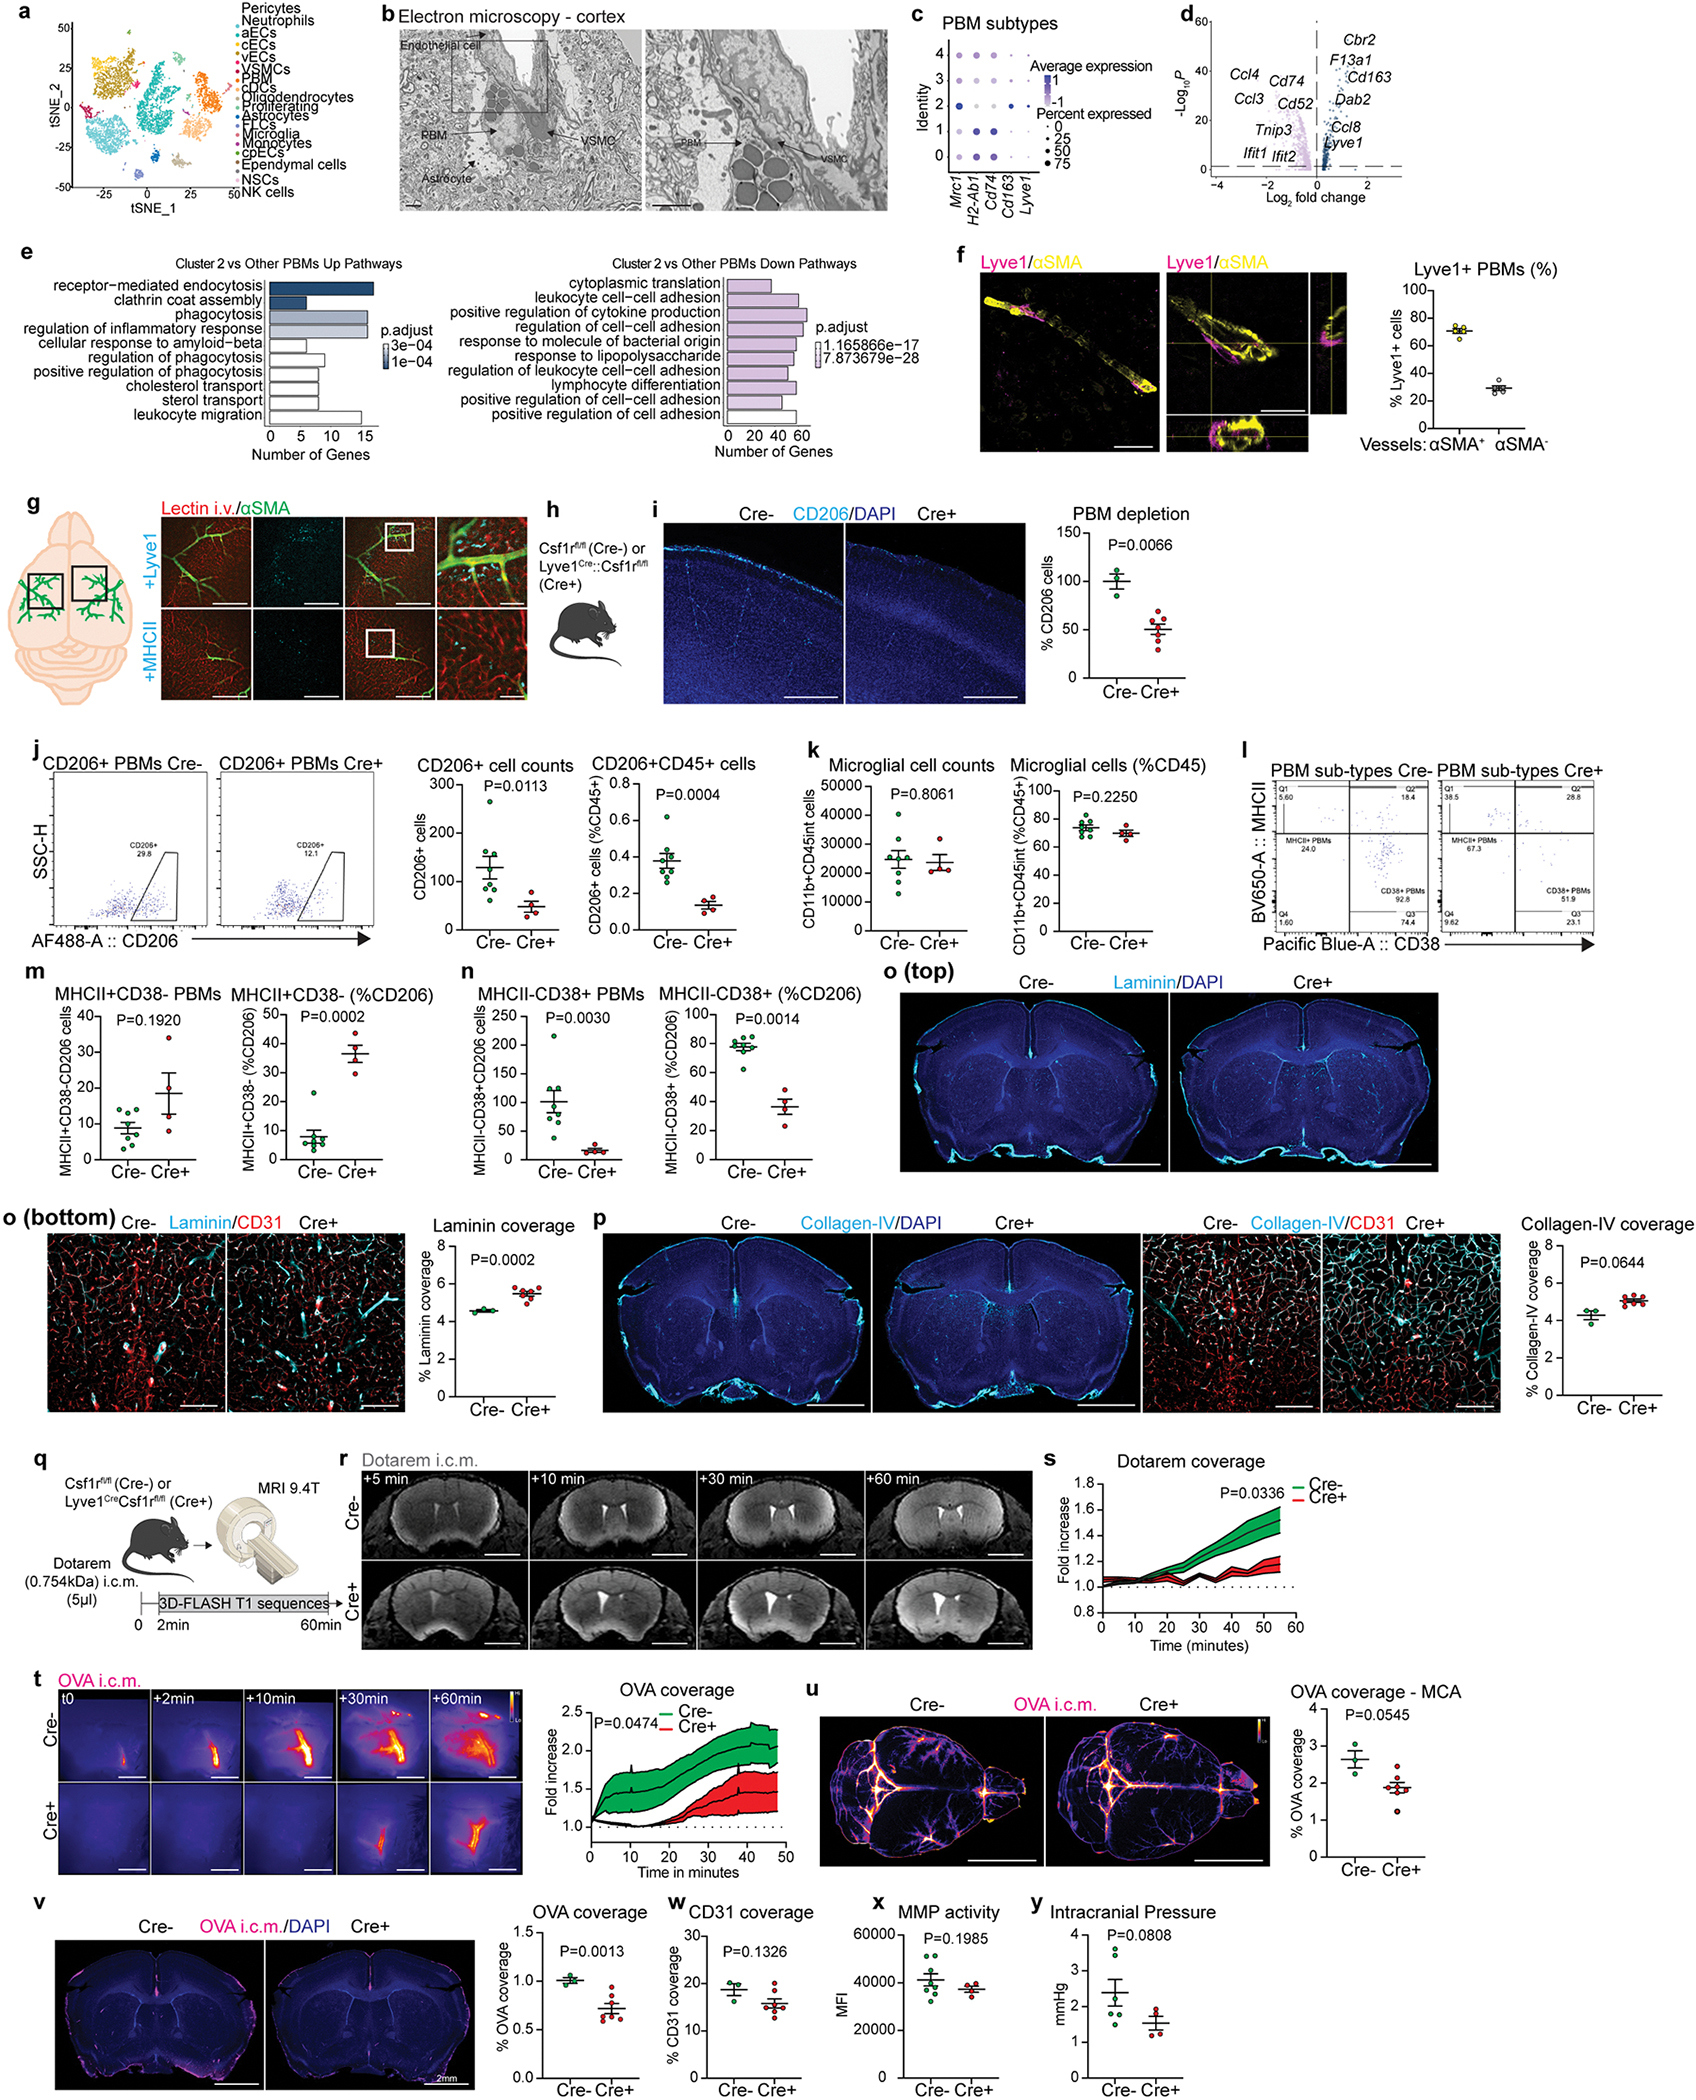
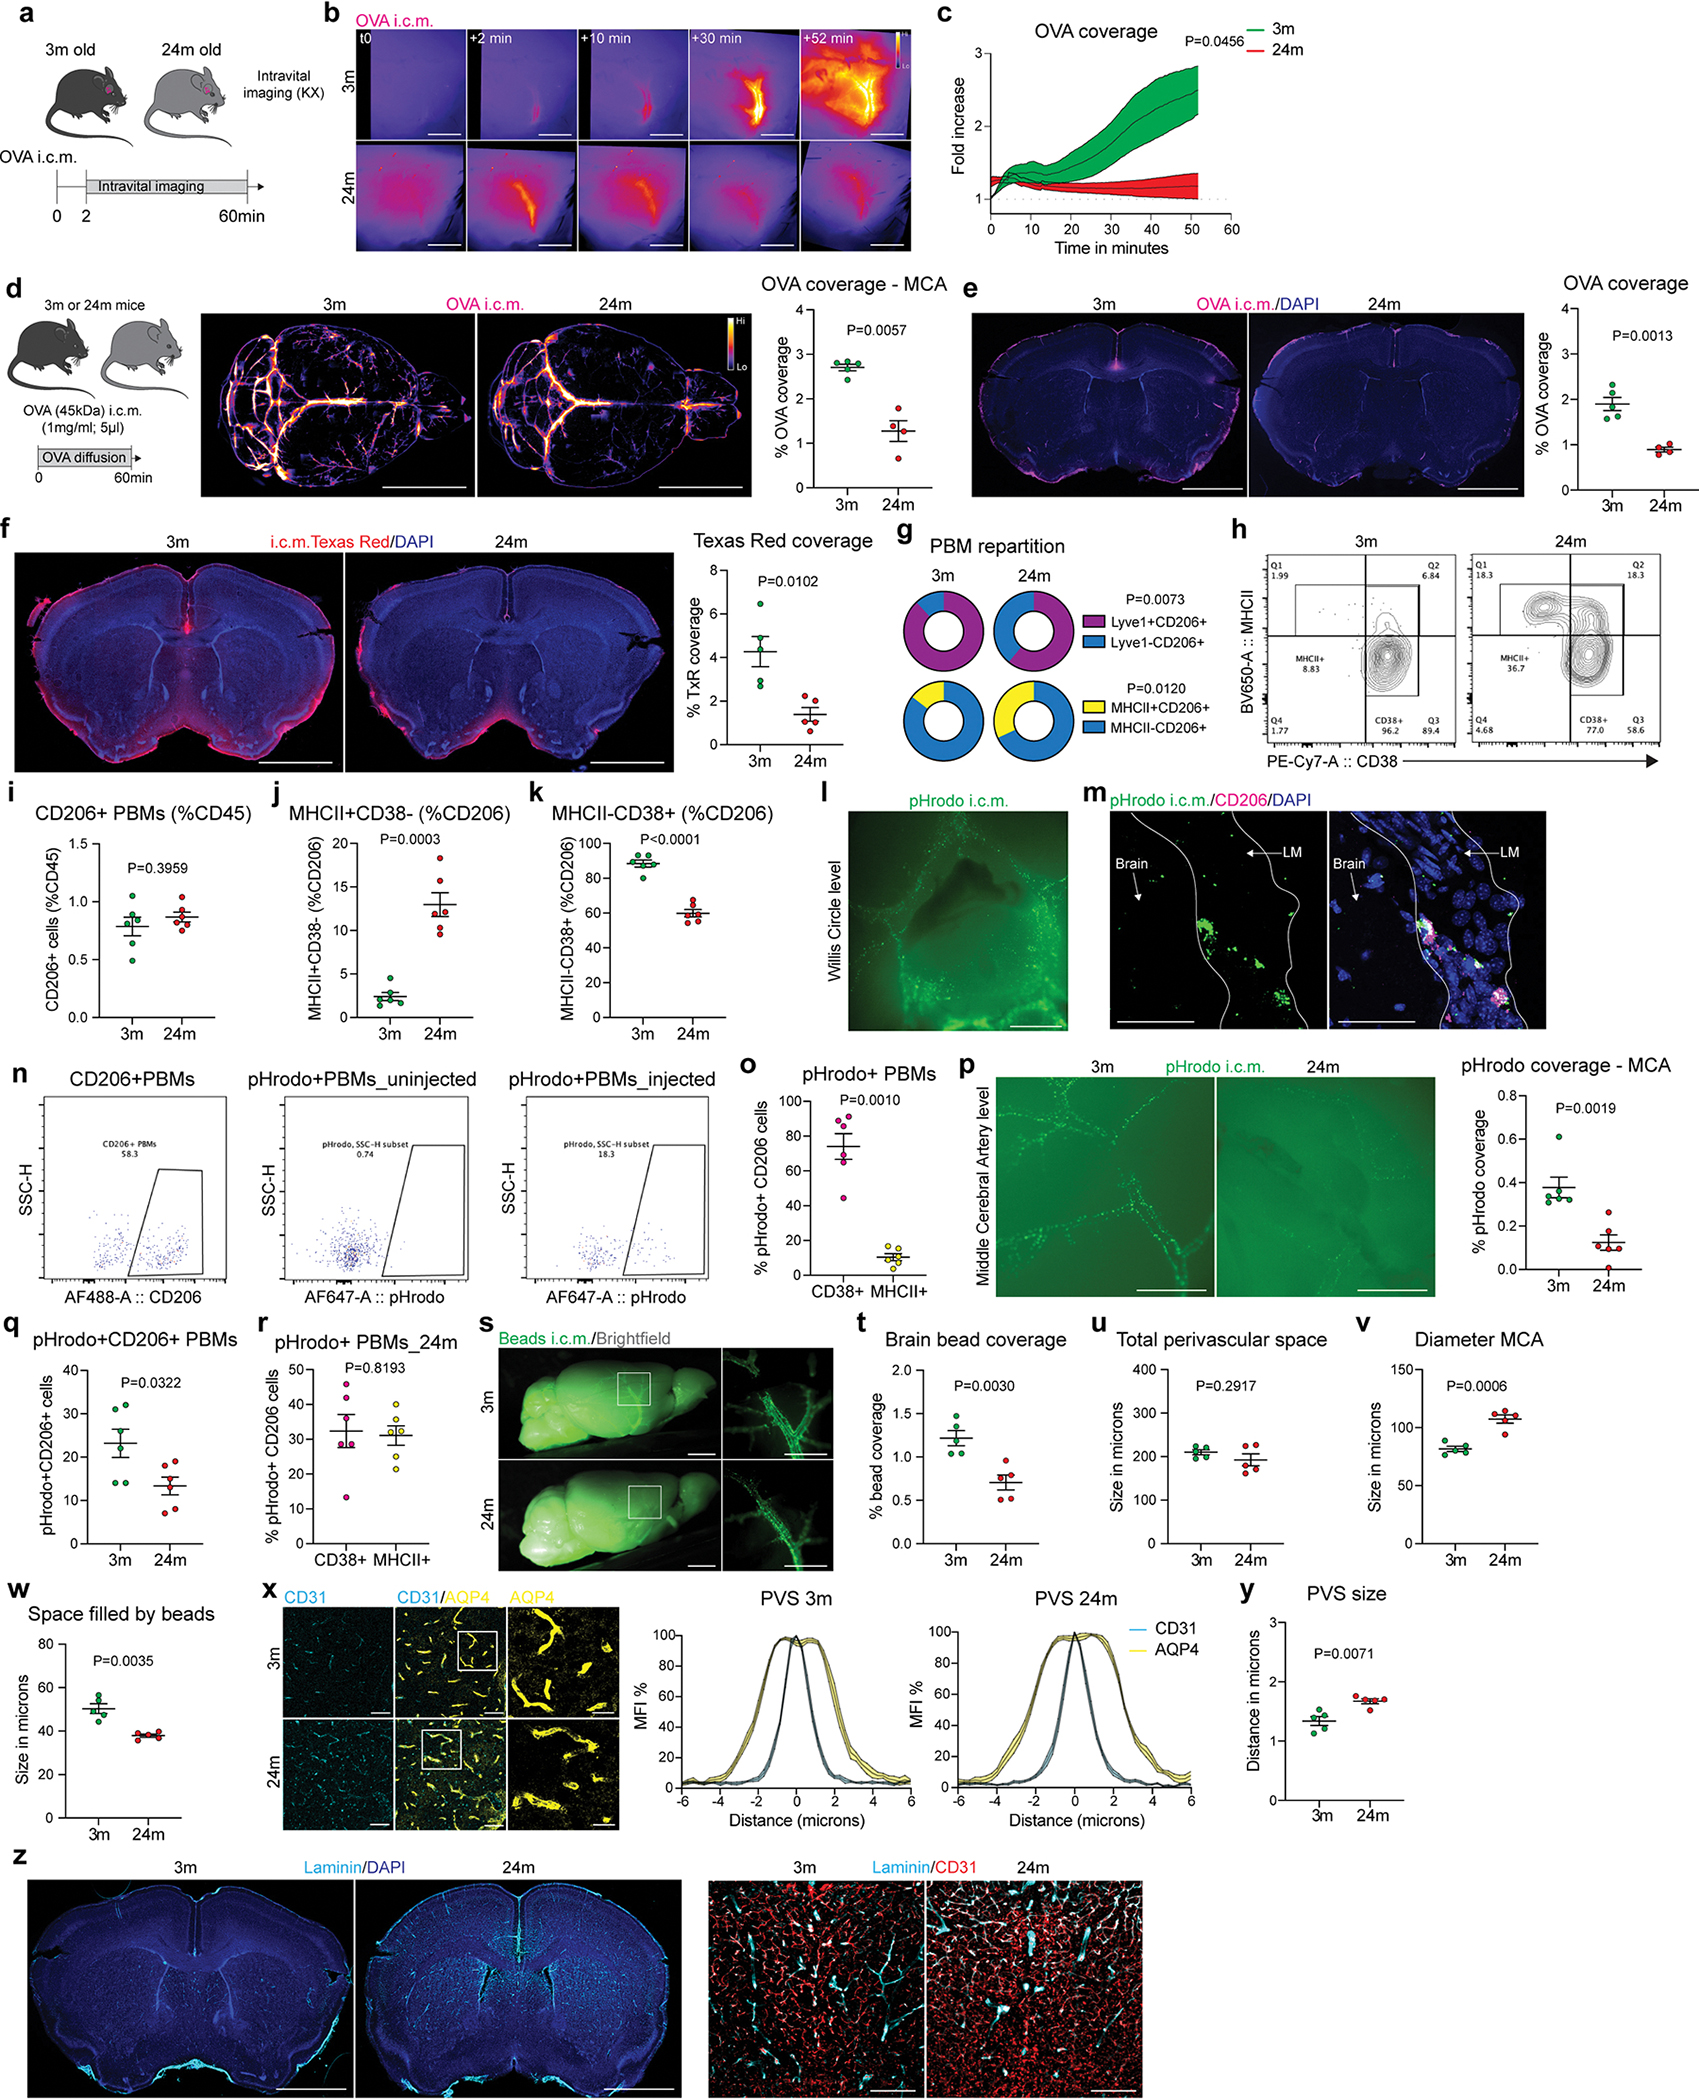
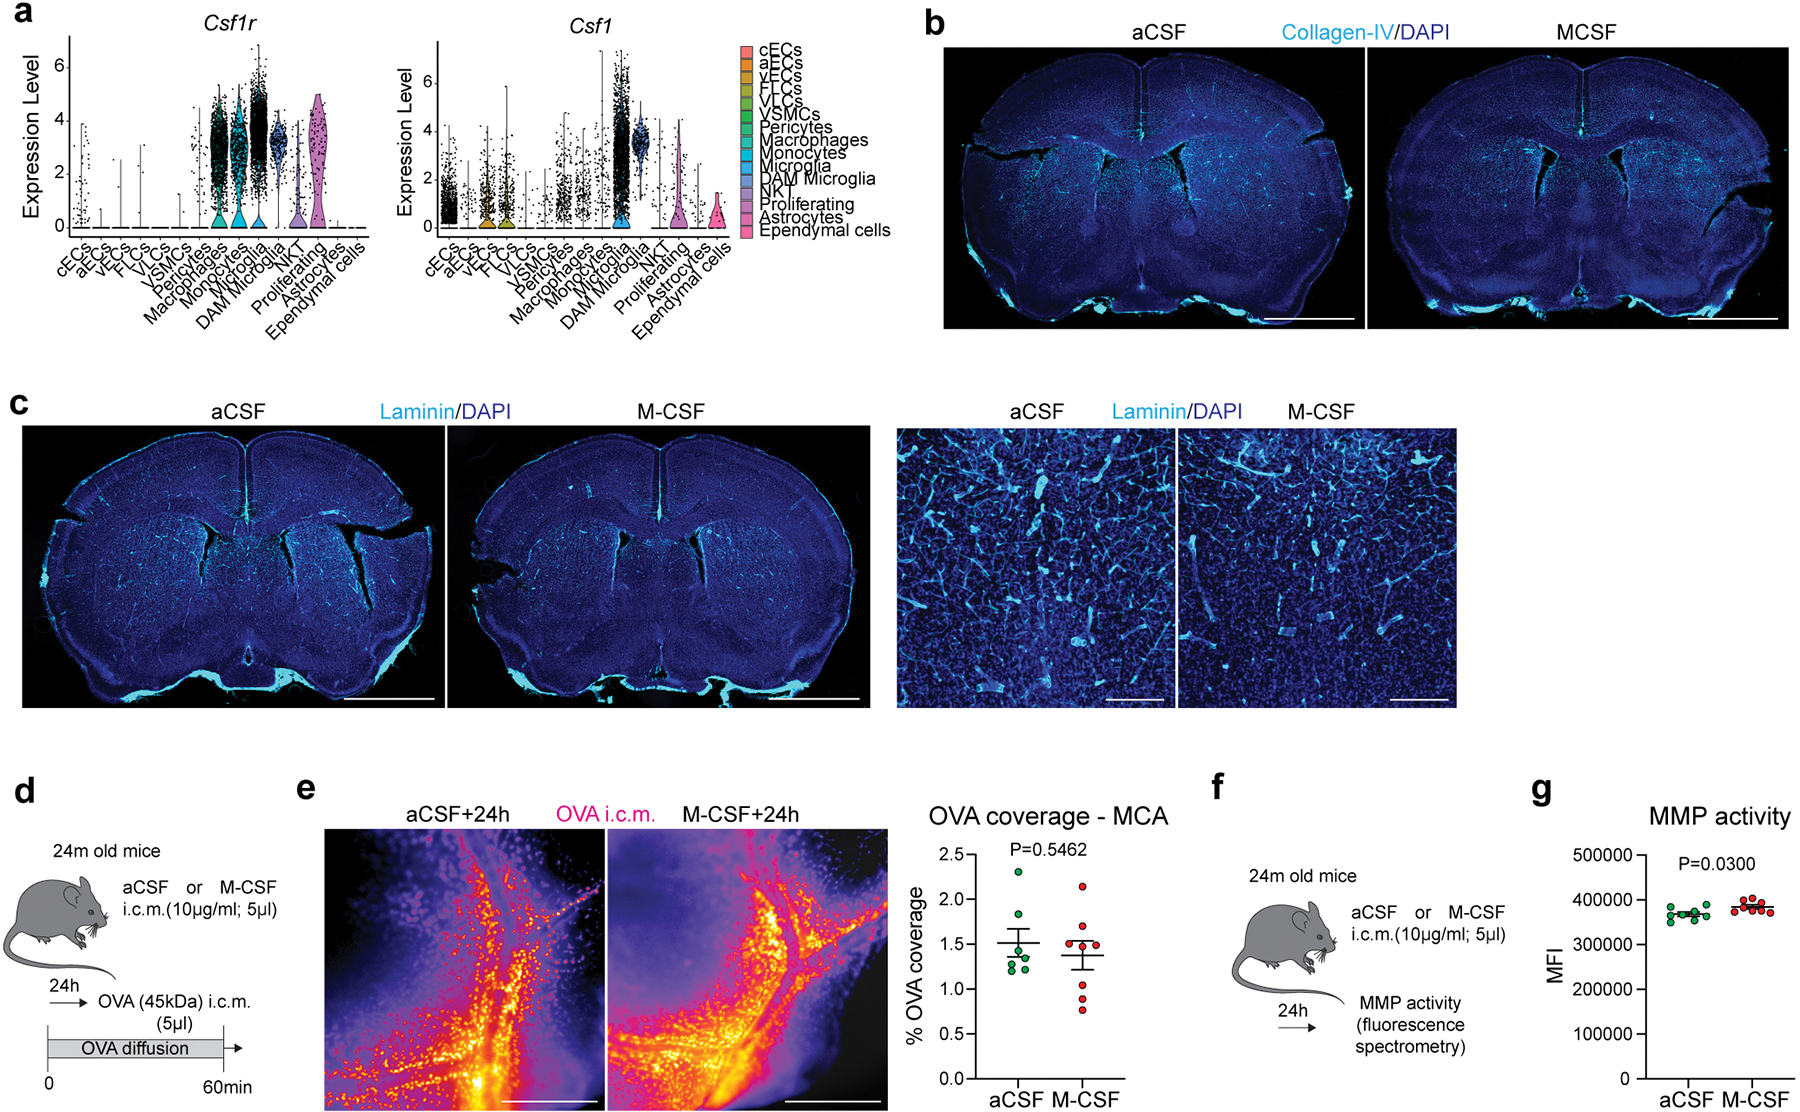
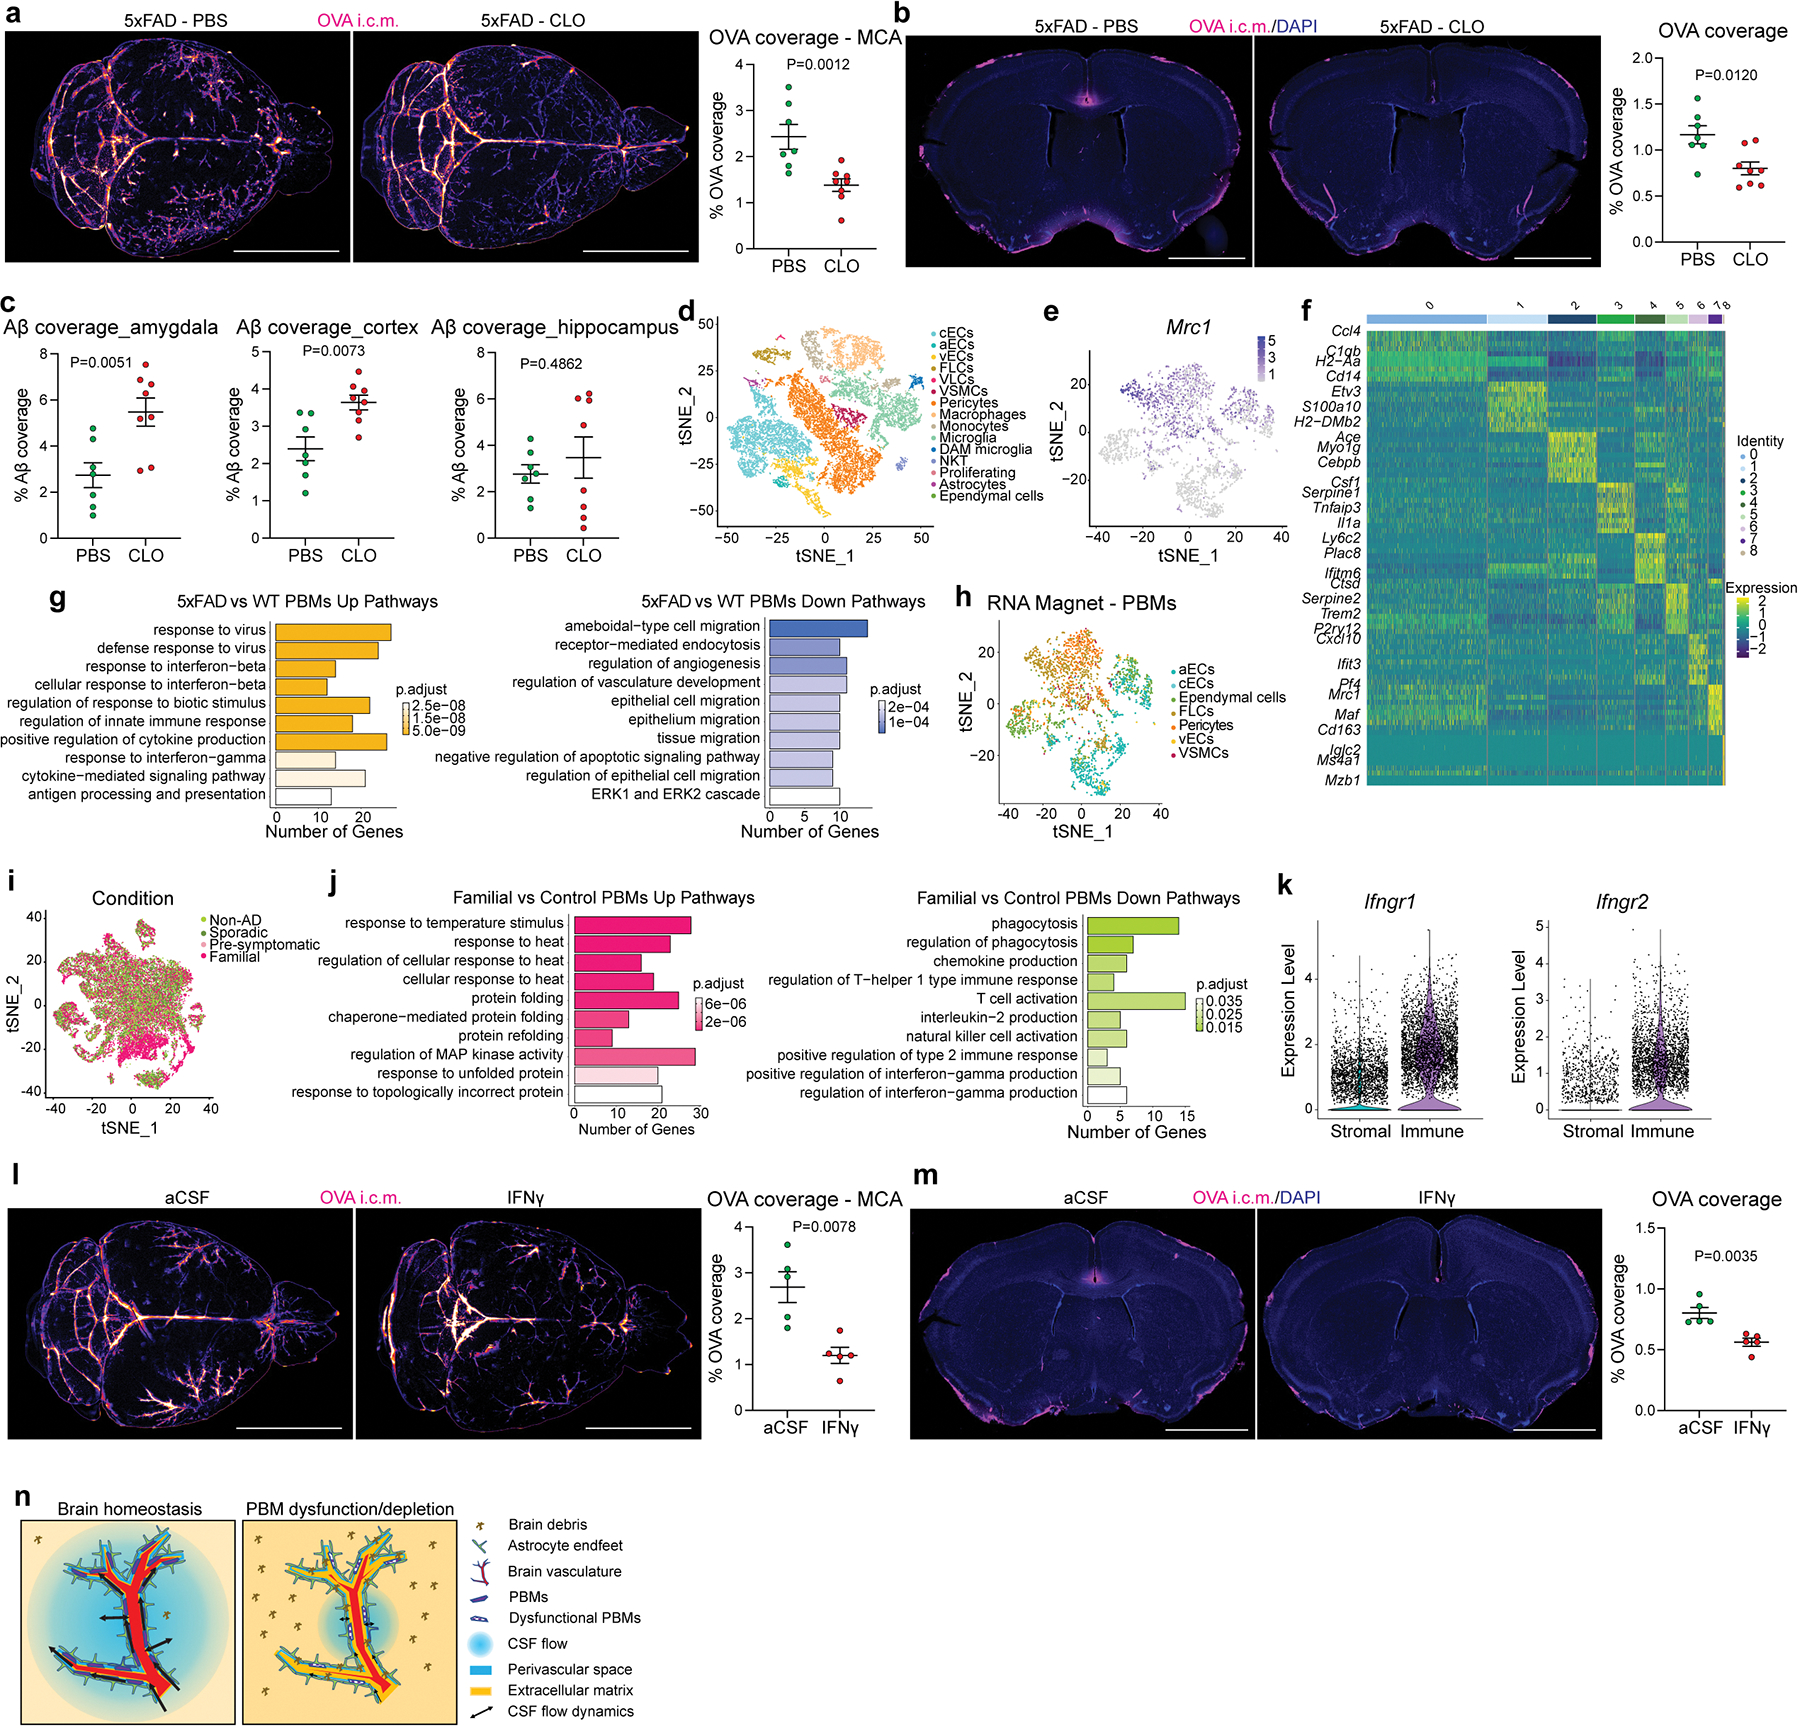
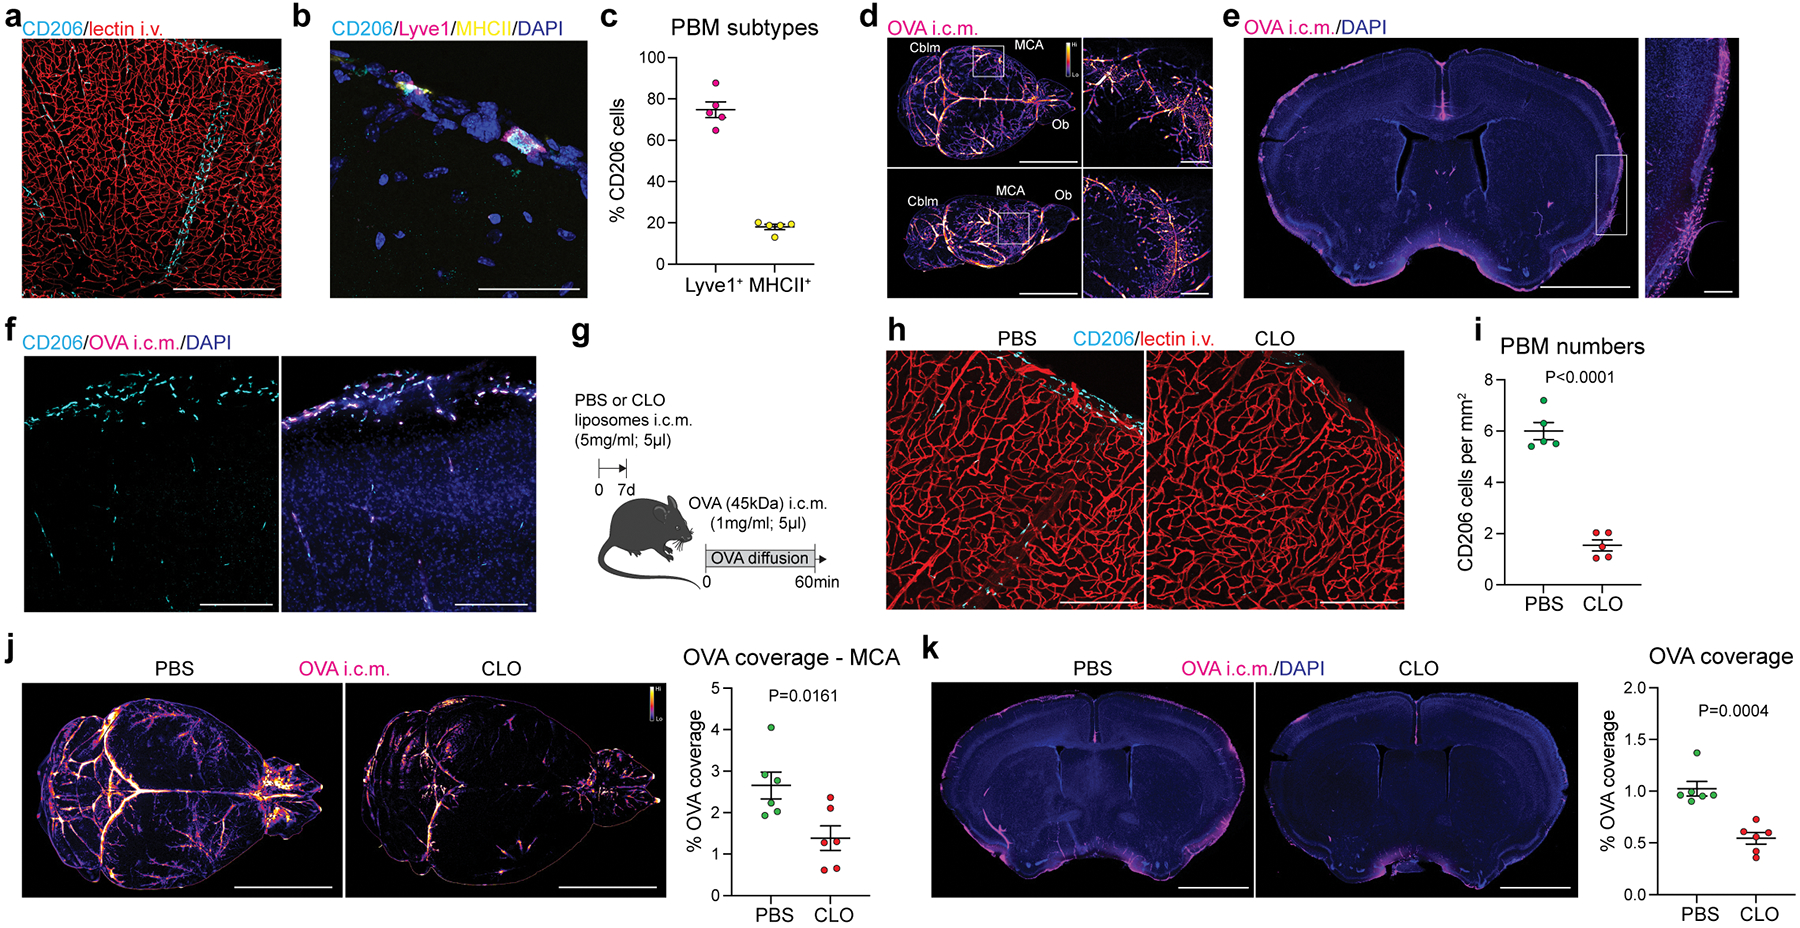
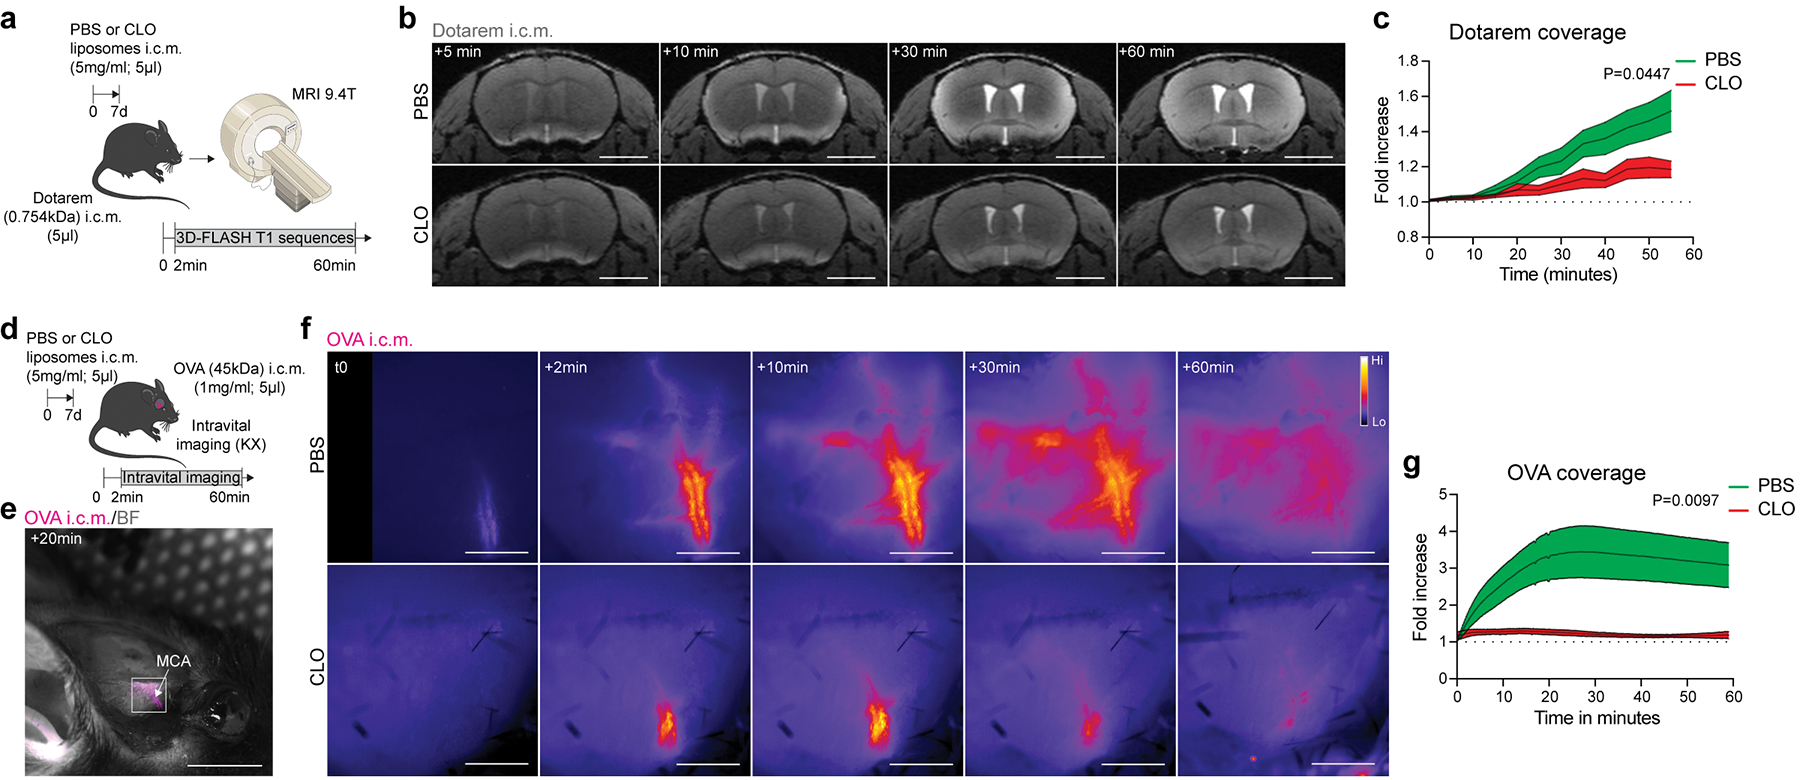
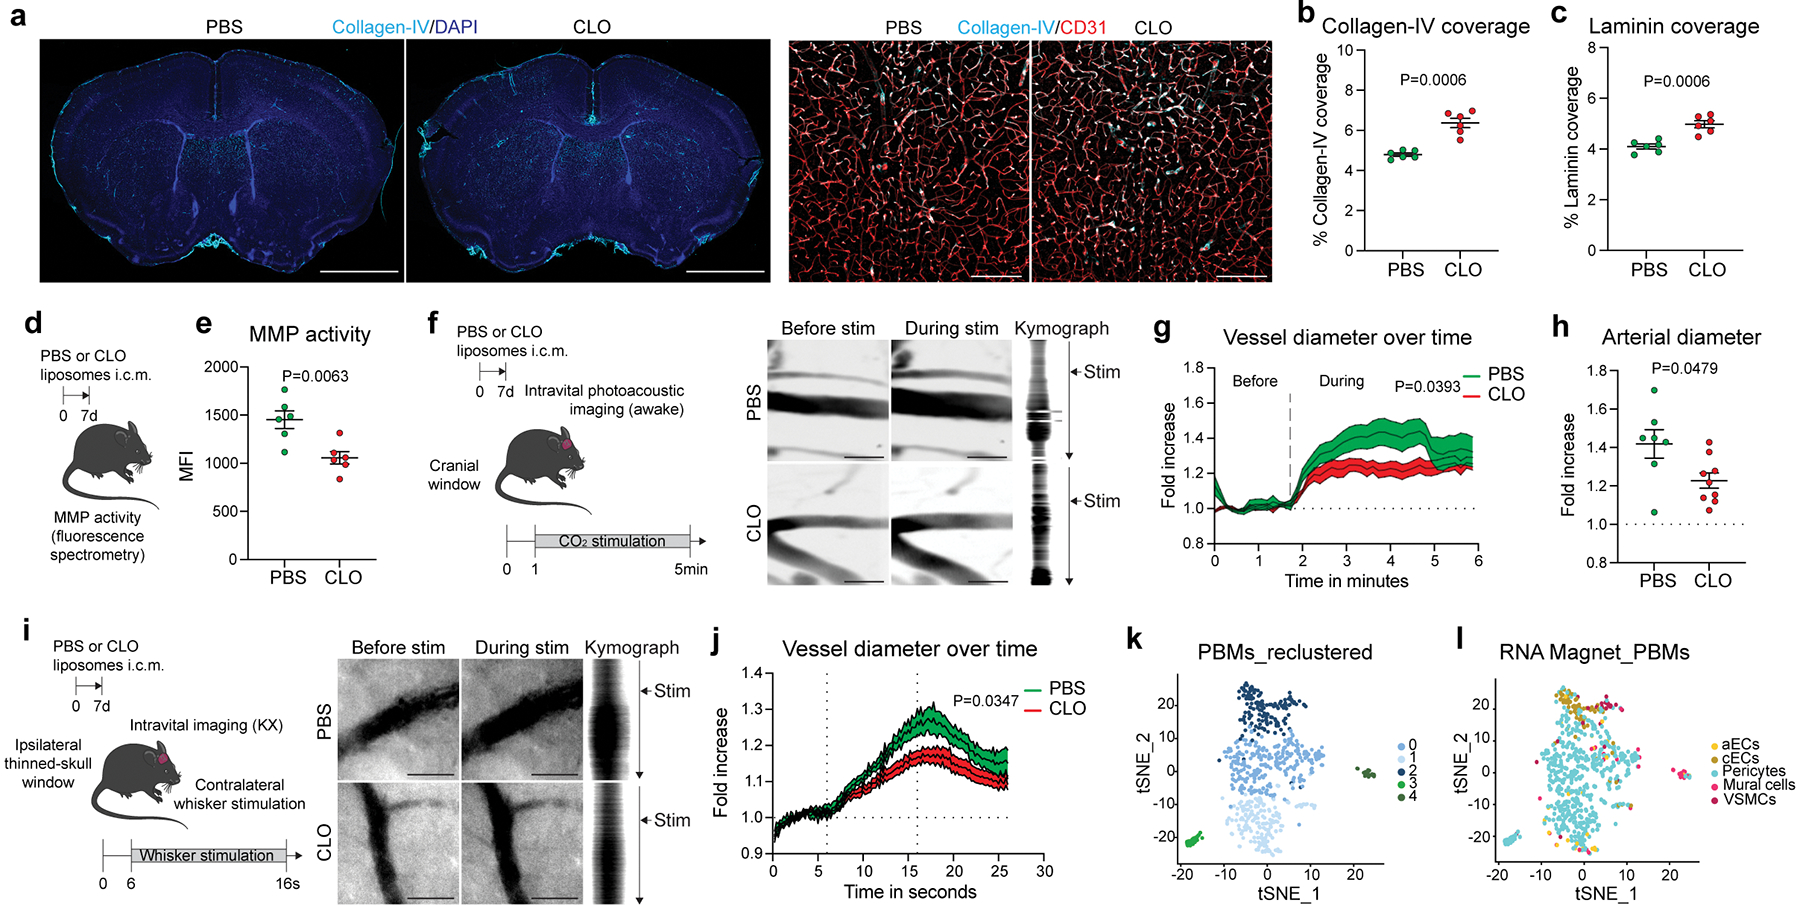
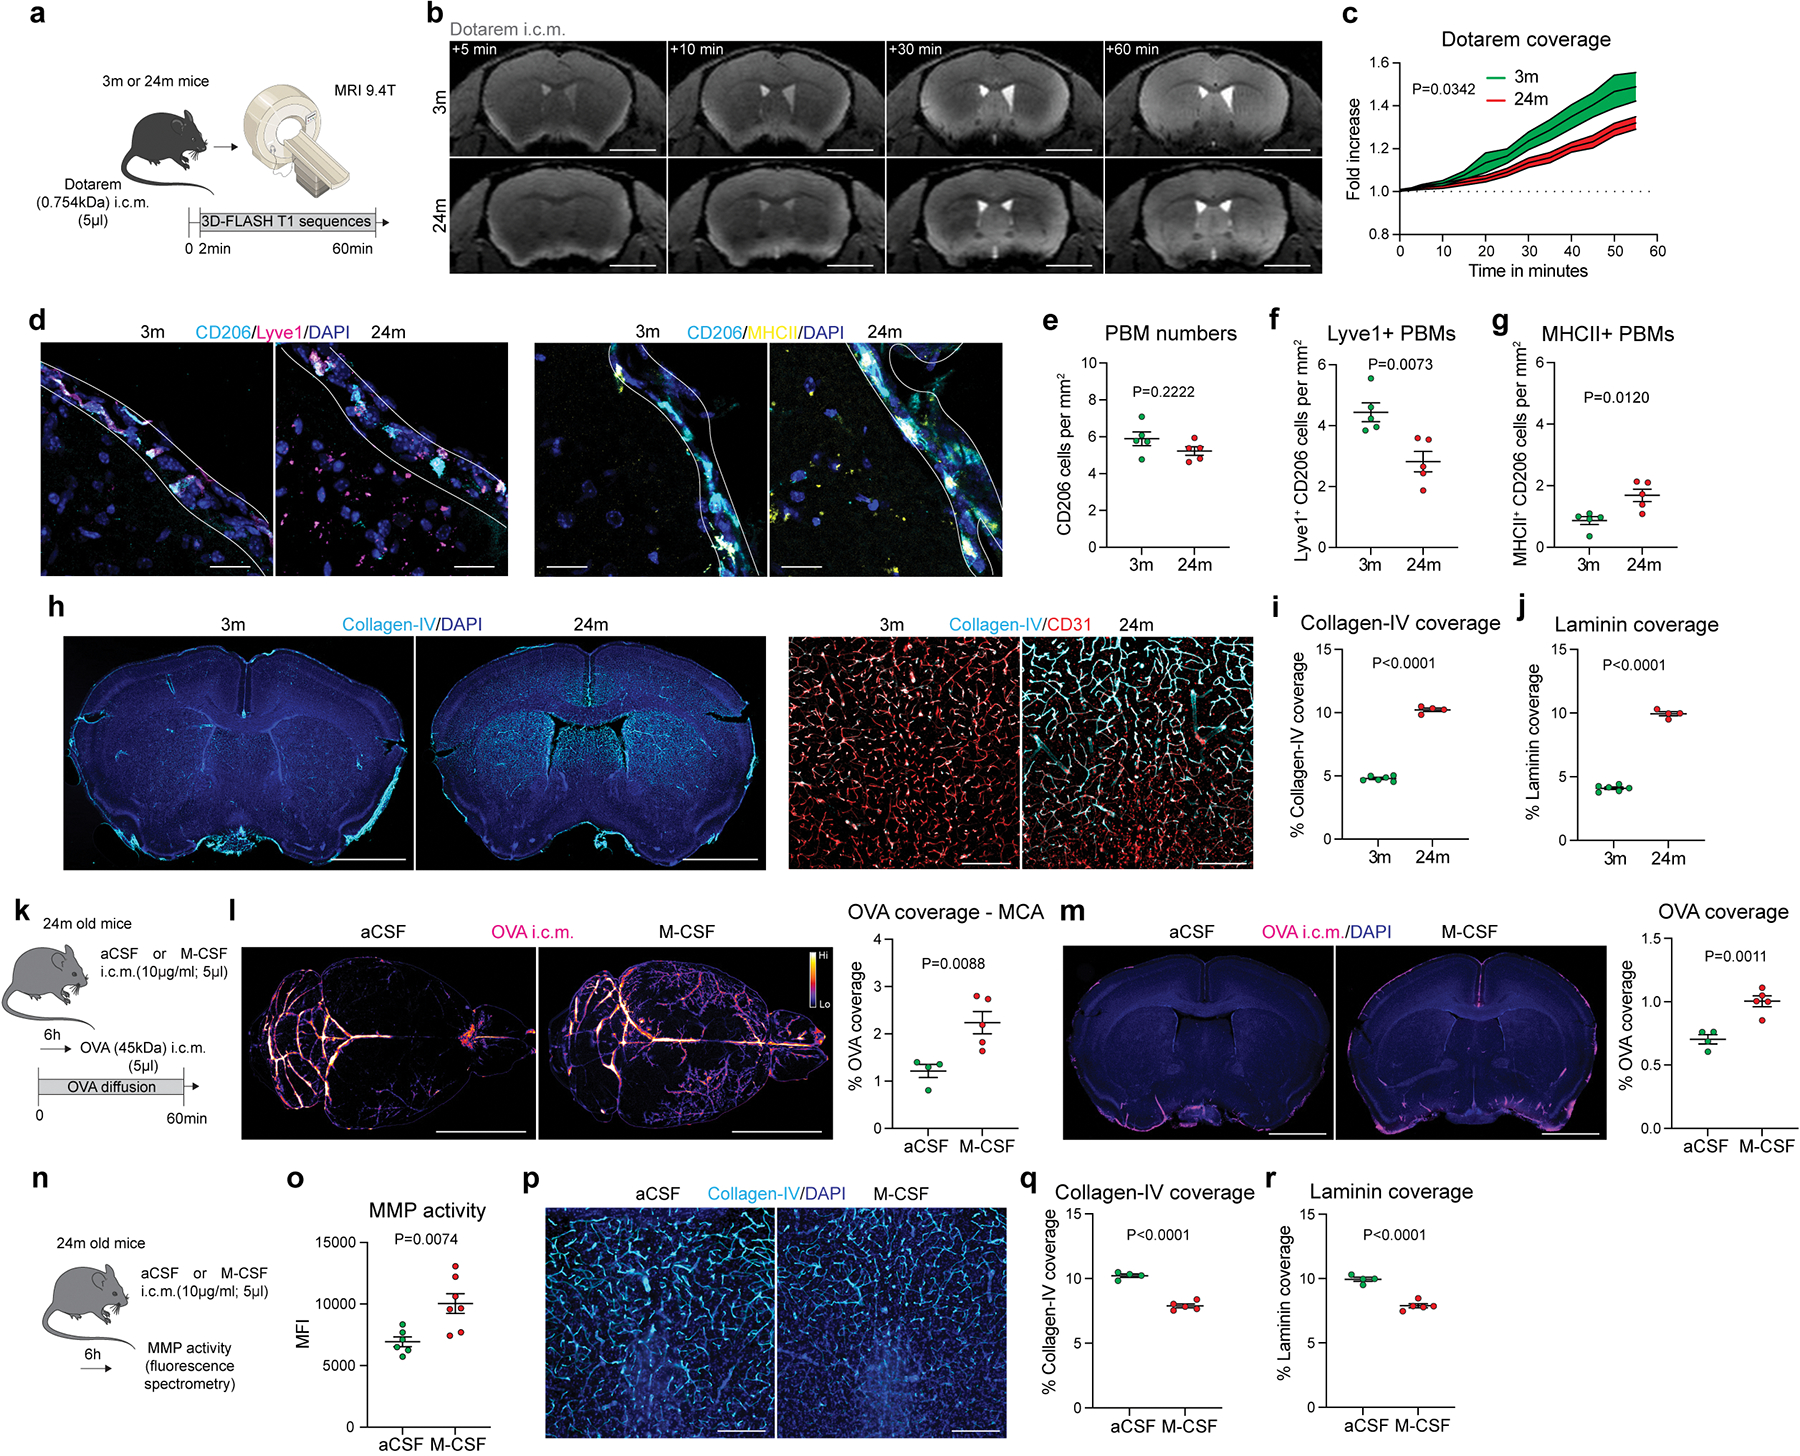
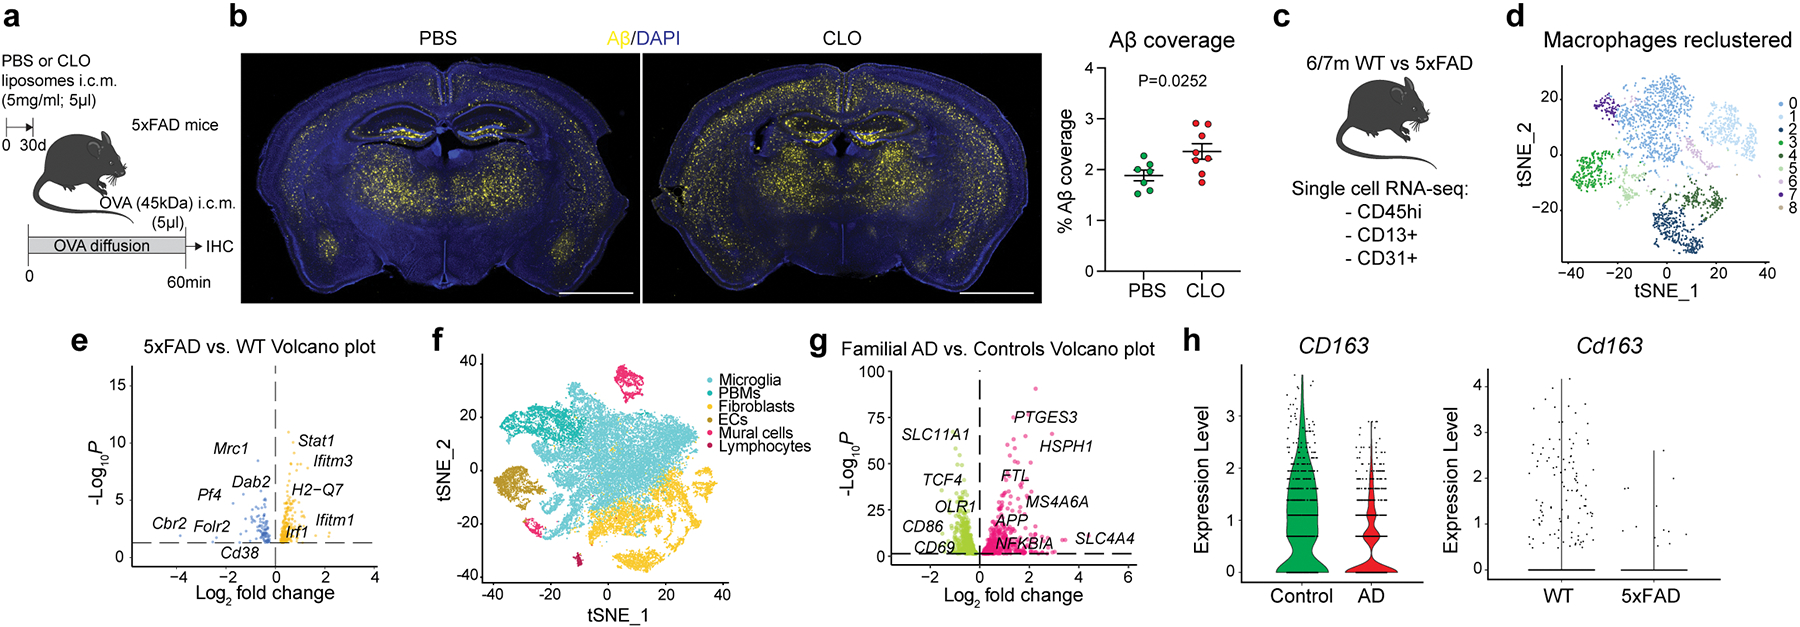
Macrophages are important players in the maintenance of tissue homeostasis1. Perivascular and leptomeningeal macrophages reside near the central nervous system (CNS) parenchyma2, and their role in CNS physiology has not been sufficiently well studied. Given their continuous interaction with the cerebrospinal fluid (CSF) and strategic positioning, we refer to these cells collectively as parenchymal border macrophages (PBMs). Here we demonstrate that PBMs regulate CSF flow dynamics. We identify a subpopulation of PBMs that express high levels of CD163 and LYVE1 (scavenger receptor proteins), closely associated with the brain arterial tree, and show that LYVE1+ PBMs regulate arterial motion that drives CSF flow. Pharmacological or genetic depletion of PBMs led to accumulation of extracellular matrix proteins, obstructing CSF access to perivascular spaces and impairing CNS perfusion and clearance. Ageing-associated alterations in PBMs and impairment of CSF dynamics were restored after intracisternal injection of macrophage colony-stimulating factor. Single-nucleus RNA sequencing data obtained from patients with Alzheimer's disease (AD) and from non-AD individuals point to changes in phagocytosis, endocytosis and interferon-γ signalling on PBMs, pathways that are corroborated in a mouse model of AD. Collectively, our results identify PBMs as new cellular regulators of CSF flow dynamics, which could be targeted pharmacologically to alleviate brain clearance deficits associated with ageing and AD.


Conflict of interest statement

Competing interests.

J.K. is a scientific advisor and collaborator with PureTech. J.K. and A.D. are holding provisional patent applications related to the findings described herein. R.J.B co-founded and is on the scientific advisory board of C2N Diagnostics. C2N Diagnostics has licensed certain anti-tau antibodies to AbbVie for therapeutic development. He receives research support from Biogen, Eisai, and the DIAN-TU Pharma Consortium. He is also an advisor to Amgen and Hoffman La-Roche.

Figures

Extended Data Fig 1.
Extended Data Fig 1.. PBMs are distinct from microglia and sample CSF and ISF.
a, CD206+ PBMs (cyan) are easily distinguishable from IBA1+ microglia (yellow) and are located at the vicinity of i.v. lectin+ large blood vessels (red). Scale bar, 100μm. b, PBM are located outside of the brain vasculature, in the perivascular space. c, Quantification of whole brain sections showing spatial distribution of PBMs through both perivascular space (PVS) and leptomeninges (LM). Scale bar, 20μm. n = 5 mice. d, Gating strategy for PBM detection. PBMs were defined as DAPICD45+TCRbCD19CD11b+CD64hiF4/80hiCD206+ cells. PBMs can be divided in subtypes using MHCII and CD38. e, WT mice received an i.c.m. injection of Alexa-647 conjugated ovalbumin (OVA; 45kDa; 1mg/ml; 5μl). One hour after OVA injection, mice received an i.v. injection of Alexa-594 conjugated lectin (30μl) and were perfused five minutes later. Maximum projection image obtained by light sheet microscopy from a cleared mouse brain showing brain OVA (magenta) distribution at the vicinity of i.v.-injected lectin+ blood vessels (cyan). Scale bar, 1mm. f, WT mice received an i.c.m. injection of Alexa-647 conjugated ovalbumin (OVA; 45kDa; 1mg/ml; 5μl). Mice were perfused one hour after OVA injection. Representative stereomicroscopy images showing whole brain OVA distribution from the distal part of the middle cerebral artery (MCA), and quantification of both perivascular and cellular OVA distribution. Scale bars, 1mm and 200μm (inset). n = 6 mice. g, Experimental schematic: WT mice received an i.c.m. injection of FITC Dextran (FITCDex; 4kDa; 10mg/ml; 5μl) and brain were harvested one hour later. Brain coronal sections were stained for anti-CD206 (cyan) and DAPI. Scale bars, 2mm and 50μm (insets). h, Experimental schematic: WT mice received an intrastriatal (i.s.) injection of a cocktail containing 0.5μl of FITC-Dex (10mg/ml; green) and 0.5μl of OVA (1mg/ml; magenta) and brains were harvested one hour later. Brains were then stained for anti-CD206 (cyan). Scale bars, 2mm and 50μm (insets). i, Mice received an i.s. injection of A488-OVA (green) and an i.c.m. injection of A647-OVA (magenta) one hour later. Mice were perfused one hour later (two hours after the i.s. injection). Some cells sampled both i.s. and i.c.m. OVAs. Scale bars, 2mm and 100μm (inset). All data are presented as mean values +/− SEM.
Extended Data Fig 2.
Extended Data Fig 2.. Effect of PBM depletion.
a, WT mice received an i.c.m. injection of clodronate-loaded liposomes (CLO) or PBS-loaded liposomes (PBS). Microglial cells were identified using anti-IBA1 staining (yellow). Cells that were not in the leptomeninges and CD206− were used for quantifications of cell numbers and Sholl analysis. Scale bars, 100μm and 20μm. n = 5 mice/group, two-tailed unpaired Welch’s t-test; repeated measures 2-way ANOVA with Geisser-Greenhouse correction. b, WT mice received an i.c.m. injection of DiI-liposomes (5mg/ml; 5μl) and mice were perfused 24 hours later. Representative images showing DiI-liposome coverage in whole brains. Scale bar: 2mm. c, Representative images showing Dil-liposome (cyan) uptake by CD206+ PBMs (magenta) in leptomeninges (LM) co-stained for DAPI. Scale bars: 50μm and 10μm (inset). d, Experimental schematic: Twenty-four hours after i.c.m. injection of DiI-liposomes, leptomeninges were harvested, DiI-positive cells were sorted and single-cell RNA sequencing was performed. e, tSNE plot showing Dil-positive cells: monocytes, PBMs, granulocytes, migratory dendritic cells (migDCs), fibroblasts and NK/T cells. f, Single-cell RNA sequencing demonstrating 4 PBM clusters. g, Dot plots showing Mrc1, H2-Ab1, Cd74, Cd163 and Lyve1 gene expression in the 4 PBM subtypes. h, Volcano plot corresponding to down- and up-regulated genes comparing MHCIIhi vs. Lyve1hi PBMs. F-test with adjusted degrees of freedom based on weights calculated per gene with a zero-inflation model and Benjamini-Hochberg adjusted P values. i, GO Pathway analysis showing up- and down-regulated pathways comparing MHCIIhi vs. Lyve1hi PBMs. Over-representation test. j. Experimental schematic: WT mice received an i.c.m. injection of CLO or PBS liposomes. OVA was injected i.c.m. three days later and mice were perfused one hour later. k. Representative images showing CD206+ PBMs (cyan) on brain coronal section co-stained for DAPI, and corresponding quantification. Scale bar, 200μm. n = 5 mice/group; two-tailed unpaired Welch’s t-test. l, Representative images and quantification of OVA distribution in whole brains one hour after OVA injection. Scale bar, 5mm. m, Representative images and quantification of OVA coverage in brain coronal sections. Scale bar, 2mm. For l and m: n = 5 mice/group; two-tailed unpaired Welch’s t-test. n, Representative images from non-superior sagittal sinus region of the dura mater three days after CLO treatment co-stained for anti-CD206 (cyan) and anti-CD31 (yellow) and corresponding quantifications. o, Representative images from the superior sagittal sinus region from the dura mater three days after CLO treatment co-stained for anti-CD206 (cyan) and anti-CD31 (yellow), and corresponding quantifications. For n and o: Scale bars, 200μm; n = 5 mice/group; two-tailed unpaired Welch’s t-test. p-u, WT mice received an i.c.m. injection of CLO or PBS liposomes. Tissues were harvested one week later. p, Representative images of total Lyve1 (magenta) coverage in the dura mater co-stained for DAPI and corresponding quantification. Scale bar, 3mm. q, High magnification images showing Lyve1 staining at the transverse sinus level co-stained for DAPI and corresponding quantification. Scale bar, 500μm. r, High magnification images showing Lyve1 staining at the superior sagittal sinus level co-stained for DAPI and corresponding quantification. Scale bar, 200μm. s, High magnification images showing CD206 staining (cyan) co-stained for anti-CD31 (yellow) and corresponding quantification. Scale bar, 500μm. For p-s: n = 5 mice/group; two-tailed unpaired Welch’s t-test. t, Representative images from lateral choroid plexuses whole mounts co-stained for anti-CD206 (cyan), anti-CD31 (red) and DAPI with corresponding high magnifications and quantification. Scale bars, 2mm and 200μm (insets). n = 5 mice treated with PBS, and 6 mice treated with CLO; two-tailed unpaired Welch’s t-test. u, Representatives images from deep cervical lymph nodes co-stained for anti-IBA1 (cyan) and DAPI and corresponding quantification. Scale bar, 200μm. n = 10 mice/group; two-tailed unpaired Welch’s t-test. All data are presented as mean values +/− SEM.
Extended Data Fig 3.
Extended Data Fig 3.. CSF flow after PBM depletion.
a, One week after PBM depletion, mice received an i.c.m. injection of FITC-Dextran (FITCDex; 4kDa; 5μl), brains were harvested one hour later and FITCDex (green) coverage was measured on coronal sections co-stained for DAPI. Representative images and corresponding quantifications are shown. Scale bar, 2mm. n = 5 mice/group; two-tailed unpaired Welch’s t-test. b, One week after PBM depletion, mice received an i.c.m. injection of Texas Red (3kDa; 5μl), brains were harvested one hour later and Texas Red (red) coverage was measured on coronal sections co-stained for DAPI. Representative images and corresponding quantifications are shown. Scale bar, 2mm. n = 4 mice treated with PBS, and 5 mice treated with CLO; two-tailed unpaired Welch’s t-test. c, One week after PBM depletion, mice received an intrastriatal injection of OVA (45kDa; 1μl) and brains were harvested one hour later. Representative images and corresponding quantifications are shown. Scale bar, 2mm. n = 4 mice treated with PBS, and 5 mice treated with CLO; two-tailed unpaired Welch’s t-test. d, One week after PBM depletion, mice received an intrastriatal (i.s.) injection of FITC-Dextran (FITCdex; 4kDa; 1μl) and brains were harvested one hour later. Representative images and corresponding quantifications are shown. Scale bar, 2mm. n = 4 mice/group; Two-tailed unpaired Welch’s t-test. e, One week after CLO or PBS liposome injection, mice were anesthetized, and a glass capillary was inserted i.c.m. to collect CSF for proteomic analyses. f, Volcano plot corresponding to down- and up-regulated proteins in CSF comparing PBM-depleted and control mice. F-test with adjusted degrees of freedom based on weights calculated per gene with a zero-inflation model and Benjamini-Hochberg adjusted P values. g, Corresponding GO Pathway analysis showing down- and up-regulated pathways in PBM-depleted and control mice. Over-representation test. h, Sunburst plot representing the location of the upregulated CSF-derived neuronal/synaptic-related proteins after PBM depletion. i-k, Quantification of relative spectral counts for i, Clusterin (CLU); j, Apolipoprotein E (APOE) and k, Amyloid Precursor Peptide (APP). For e-k: n = 4 mice treated with PBS, and 5 mice treated with CLO; two-tailed unpaired Welch’s t-test. l, MRI based T2-weighted anatomical sequences were performed before and one week after PBM depletion. m, Representative T2 images showing lateral ventricles (in hypersignal) before and after PBM depletion. Scale bar, 2mm. n, Quantification of ventricle volume in mm3. n = 5 mice/group; one-way ANOVA with Tukey multiple comparisons test. o, Intracranial pressure was measured one- (7d) and three (21d) weeks after PBM depletion. n = 5 mice treated with PBS, 7 mice treated with CLO at 7d; 6 mice treated with PBS, and 7 mice treated with CLO at 21d; two-way ANOVA with Sidak’s multiple comparisons test. p, Sagittal view of a T1-FLASH 3D image showing Dotarem (0.754kDa; 5μl) accumulation in different brain compartments, including the olfactory bulbs (OB), the lateral ventricles (Lat vtl) and the middle cerebral artery (MCA). Scale bar, 3mm. q, Representative T1-FLASH 3D images showing Dotarem distribution at the MCA level over time. Scale bar, 3mm. r, Quantification of Dotarem signal fold increase over an hour. n = 5 mice treated with PBS, and 7mice treated with CLO; repeated measures 2-way ANOVA with Geisser-Greenhouse correction. s, One week after CLO or PBS liposome injection, mice received an i.c.m. injection of OVA, and deep cervical lymph nodes (dCLNs) were harvested one hour later. t, Representative images showing OVA coverage on dCLN sections. Scale bar, 200μm. u, Quantification of dCLN area. v, Quantification of OVA coverage. For u and v: n = 10 mice/group; two-tailed unpaired Welch’s t-test. w, One week after CLO or PBS liposome injection, mice received an i.c.m. injection of OVA and then placed in supine position under the stereomicroscope for dynamic imaging of OVA diffusion in the exposed lymph nodes. x, Representative images showing OVA coverage in dCLNs over time. Scale bar, 500μm. y, Quantifications of both OVA influx (left) and efflux (right) over time. n = 3 mice treated with PBS, and 7 mice treated with CLO; repeated measures 2-way ANOVA with Geisser-Greenhouse correction. z, Proportion of mice that showed OVA outflow from dCLNs. All data are presented as mean values +/− SEM.
Extended Data Fig 4.
Extended Data Fig 4.. In vivo recording of tracer diffusion at the middle cerebral artery (MCA) level and evaluation of the perivascular space.
A, Experimental schematic: One week after CLO or PBS liposome injection, mice were placed in a stereotaxic frame, the top and the right side of the head were shaved, the skin was incised, and the right temporalis muscle was gently removed. b, After cleaning the area with a cotton bud, mice received an i.c.m. injection of OVA and were immediately placed on their side under the stereomicroscope. c, Example of OVA distribution at the middle cerebral artery level (MCA) before and 20min after injection. Scale bar, 5mm. d, Inset of c. Higher magnification image showing OVA distribution one hour after injection. The tracer is located around the vessel, at the perivascular level. Scale bar, 1mm. e, High magnification from d showing that OVA can be sampled by perivascular cells. Scale bar, 100μm. f, Experimental schematic: mice were anesthetized with either KX or isoflurane (4% induction, 1–2% during dynamic imaging) and received an i.c.m. injection of OVA. Mice were maintained with the same anesthesia regime during the dynamic imaging. g, Representative images showing OVA distribution over time. Scale bar, 1mm. h, Quantification of OVA coverage over time. n = 5 mice/group; two-way ANOVA mixed-effects analysis (30 last min only). i and j, Mice were then perfused and whole brains were imaged by stereomicroscopy, then the brains were sliced and analyses were made on brain coronal sections. i, Representative images showing OVA distribution and quantification in whole brains and a zoom on the middle cerebral artery. Scale bars, 2mm (left panels) and 1mm (right panels). j, Representative images showing OVA coverage on brain coronal sections. Scale bar, 2mm. For i and j, n = 5 mice/group; two-tailed unpaired Welch’s t-test. k, One week after PBM depletion and one hour after i.c.m. injection of OVA, mice were perfused, brains were extracted, and OVA distribution was analyzed on coronal sections stained for DAPI, and corresponding quantification of OVA depth distribution from the brain surface. Scale bars, 100μm and 50μm (insets). n = 5 mice/group; two-tailed unpaired Welch’s t-test. l, Representative images showing anti-aquaporin 4 (AQP4) staining. Scale bar, 50μm. m, Quantification of AQP4 coverage. n, Quantification of AQP4+ blood vessels. For m and n, n = 5 mice/group; two-tailed unpaired Welch’s t-test. o, Brain sections were co-stained for anti-AQP4 (yellow) and anti-CD31 (cyan), and perpendicular lines to blood vessels were used to measure the perivascular space. Scale bars, 50μm and 10μm (insets). p, Representation of the perivascular space (PVS) in PBS (left) and CLO (right) treated mice. q, Quantification of perivascular space. n = 4 mice treated with PBS, and 5 mice treated with CLO; two-tailed unpaired Welch’s t-test. r, One week after PBM depletion, mice received an i.c.m. injection of fluorescent beads (0.1μm thick; 5μl) and then were immediately placed on their side under the stereomicroscope for dynamic bead imaging at the MCA level. s, Representative images showing bead distribution over an hour at the proximal part of the MCA. Scale bar, 1mm. t, Quantification of bead coverage at the MCA level over time. n = 4 mice treated with PBS, and 7 mice treated with CLO; repeated measures 2-way ANOVA with Geisser-Greenhouse correction. u, Representative images showing beads located at the MCA perivascular space in vivo (left) and ex vivo after perfusion with PBS and post-fixation in 4% PFA (right) from the same mouse. Scale bar, 1mm. v, Representative images from extracted whole brain showing bead repartition at low (left image) and higher magnification (right image) and corresponding plot profile. The beads (green line) are located outside of the MCA (red line), at the perivascular level. Scale bar, 2mm. w, Measure of the perivascular space (PVS) between in vivo and ex vivo from the same mice. n = 4 mice; Two-tailed paired t-test. x, Representative images showing ex vivo bead repartition at the MCA level in PBM-depleted mice and PBS-treated control mice, and corresponding quantification of bead coverage. Scale bar, 500μm; n = 4 mice treated with PBS, and 5 mice treated with CLO; two-tailed unpaired Welch’s t-test. y, Quantifications of total perivascular space (space between the two sides of the MCA where beads were found to accumulate) and MCA diameter (identified by the i.v. lectin injection). z, Quantification of the functional space where beads were found to be accumulated. For y and z: n = 10 mice treated with PBS, and 9 mice treated with CLO; two-tailed unpaired Welch’s t-test. All data are presented as mean values +/− SEM.
Extended Data Fig. 5.
Extended Data Fig. 5.. PBM depletion has mild effect on mouse behavior and no effect on vital signs.
One week after PBM depletion, mice underwent a battery of different behavioral tests. a, Cued fear conditioning: quantification of the percentage of time spent freezing during the three shocks the first day, and exposure to conditioned clues at one- and seven days after fear conditioning. b, Elevated plus maze: quantifications of the percentage of time spent in the open arm (left), the total time spent in the open arm (middle) and the total distance moved (right). c, Open field test: quantification of the distance moved over an hour, the total distance moved, the time spent in the center of the box over an hour and the total time spent in the center of the box. d, Forced swim test: quantification of the total floating time (left) and the latency to float (right). For a-d: n = 10 mice/group; two-tailed unpaired Welch’s t-test. e, Three-chamber test: mice were first exposed to a mouse (S1) or an object (O), and then to a previously-exposed mouse (S1) or a new mouse (S2). Quantifications of the total sniffing time and the total time spent in the chamber for the two tests. n = 17 mice treated with PBS, and 13 mice treated with CLO; two-tailed unpaired Welch’s t-test. f, One week after PBM depletion, respiratory rate, heart rate, arterial pulsation and diameter were monitored. n = 5 mice/group; two-tailed unpaired Welch’s t-test. All data are presented as mean values +/− SEM.
Extended Data Fig 6.
Extended Data Fig 6.. PBMs and extracellular matrix remodeling.
a, One week after CLO or PBS liposome injection, mice were perfused, brains were extracted, lateral choroid plexuses were removed, CD45-CD13+ and CD45-CD31+ cells were sorted and used for single-cell RNA sequencing. Nine different cell types were identified based on canonical markers. b, Volcano plot corresponding to up- and down-regulated genes comparing fibroblasts in PBM-depleted mice and PBS-treated control mice, and corresponding GO Pathway analyses showing up- (left) and down-regulated (right) pathways. c, Volcano plot corresponding to up- and down-regulated genes comparing pericytes in PBM-depleted mice and PBS-treated control mice, and corresponding GO Pathway analyses showing up- (left) and down-regulated (right) pathways. d, Volcano plot corresponding to up- and down-regulated genes comparing capillary endothelial cells (cECs) in PBM-depleted mice and PBS-treated control mice, and corresponding GO Pathway analyses showing up- (left) and down-regulated (right) pathways. For b-d, Volcano plots: F-test with adjusted degrees of freedom based on weights calculated per gene with a zero-inflation model and Benjamini-Hochberg adjusted P values; GO-pathways analyses: over-representation test. e, Representative images showing cortical brain sections stained for anti-CD13 (mural cells, yellow) co-stained for anti-CD206 (magenta), anti-Laminin (cyan) and DAPI, and corresponding quantification. Scale bar, 100μm; n = 5 mice/group; two-tailed unpaired Welch’s t-test. f, Representative images showing cortical brain sections stained for anti-CD31 (endothelial cells) and corresponding quantification. Scale bar, 200μm; n = 6 mice/group; two-tailed unpaired Welch’s t-test. g, Representative images showing cortical brain sections of mice that were i.c.m. injected with OVA (magenta), stained for anti-αSMA (vascular smooth muscle cells, cyan) and co-stained for anti-CD31 (yellow), and corresponding quantification. Scale bar, 200μm; n = 6 mice/group; two-tailed unpaired Welch’s t-test. h, One week after CLO or PBS liposome injection, brain coronal sections were stained for anti-Laminin (cyan) and DAPI (blue). Scale bar, 2mm. k, High magnification images showing Laminin (cyan) in association with CD31+ blood vessels (red). Scale bar, 200μm. i, Representative Western blot images of Collagen-IV (160kDa) and Ponceau S from isolated brain blood vessels one week after PBM depletion, and corresponding quantification. n = 5 mice/group; two-tailed unpaired Welch’s t-test. j, Representative images showing Collagen-IV (cyan) deposition at both αSMA+ (arteries/arterioles; yellow) and αSMA− blood vessels. Scale bar, 200μm. k and l, Representative images from mouse cortex showing accumulation of k: Collagen-IV; and l: Laminin (cyan), co-stained for anti-CD31 (red), and respective quantifications. Scale bars, 200μm; n = 6 mice/group; two-tailed unpaired Welch’s t-test. m, High magnification images showing Laminin (cyan) in association with αSMA+ surface and penetrating large blood vessels (magenta), and corresponding quantifications. n, High magnification images showing Collagen-IV (cyan) in association with αSMA+ surface and penetrating large blood vessels (magenta), and corresponding quantifications. For m and n: Scale bar, 200μm; n = 5 mice/group; two-tailed unpaired Welch’s t-test. o, Experimental schematic: mice received an i.p. injection of dobutamine (40μg/kg) or saline 30min prior to receiving an i.c.m. injection of OVA (1mg/ml; 5μl). Mice were perfused one hour later. p, Representative images showing OVA distribution in whole brains and corresponding quantifications. q, Representative images showing OVA coverage on brain coronal sections and corresponding quantifications. For p and q, Scale bars, 2mm; n = 6 mice treated with PBS, 4 mice treated with CLO in saline group; 3 mice treated with PBS, and 5 mice treated with CLO in dobutamine group; two-way ANOVA with multiple comparisons. All data are presented as mean values +/− SEM.
Extended Data Fig 7.
Extended Data Fig 7.. Lyve1+ PBMs drive CSF flow dynamics.
a, Single-cell RNA sequencing of the whole brain was performed. Eighteen cell types were identified based on canonical markers. b, Scanning electron microscopy image from a mouse cortex suggesting interactions between a PBM and a vascular smooth muscle cell (VSMC). Scale bars, 2μm. c, Dot plot for Mrc1 (CD206), H2-Ab1 (MHCII), Cd74, Cd163 and Lyve1 expression in each PBM cluster. d and e, Volcano plot and GO pathway analysis showing up- and down-regulated pathways in PBM cluster 2 versus other PBM clusters. Volcano plots: F-test with adjusted degrees of freedom based on weights calculated per gene with a zero-inflation model and Benjamini-Hochberg adjusted P values; GO-pathways analyses: over-representation test. f, Representative images suggesting interactions between Lyve1+ PBMs (magenta) and αSMA+ (yellow) VSMC. Scale bar, 200μm and 50μm (inset). g, Quantification of Lyve1+ cells associated or not with αSMA+ blood vessels. n = 5 mice. h, Mice received an i.v. injection of lectin and were perfused few minutes later. Whole brains were extracted, post-fixed with 4% PFA, and stained for anti-αSMA (green) and anti-Lyve1 (top panels) or anti-MHCII (bottom panels) (cyan). Scale bars: 1mm and 200μm (insets). i, Characterization of PBM depletion in Lyve1Cre::Csf1rfl/fl mice (Cre+) in brain coronal sections using CD206 staining (co-stained for DAPI) versus control littermates not expressing Cre (Csf1rfl/fl; Cre−). Scale bar, 500μm; n = 7 Cre− mice, and 3 Cre+ mice; two-tailed unpaired Welch’s t-test. j, Flow cytometry panels showing CD206+ cells in Csf1rfl/fl mice (Left; Cre−) and Lyve1Cre::Csf1rfl/fl mice (Right; Cre+), and quantifications of CD206+ PBM cell numbers (left), and frequency of CD206+ PBMs from total CD45+ cells (right). k, Quantification of CD11b+CD45int microglial cell numbers (left), and frequency of CD11b+CD45int microglial cells from total CD45+ cells (right). l, Flow cytometry panels showing CD38+ and/or MHCII+ CD206+ PBMs in Csf1rfl mice (Left; Cre−) and Lyve1Cre::Csf1rfl mice (Right; Cre+). m, Quantification of MHCII+CD38− PBMs (left), and frequency of MHCII+CD38− PBMs from total CD206+ cells (right). n, Quantification of MHCII-CD38+ PBMs (left), and frequency of MHCII-CD38+ PBMs from total CD206+ cells (right). For i-n: n = 8 Cre− mice, and 4 Cre+ mice; two-tailed unpaired Welch’s t-test. o, (Top) Representative images of coronal brains sections from Lyve1Cre::Csf1rfl/fl (Cre+) and Csf1rfl/fl (Cre−) mice co-stained for anti-Laminin (cyan) and DAPI. (Bottom) High magnification images showing Laminin location at the vicinity of CD31+ blood vessels (red), and corresponding quantification. Scale bars, 2mm (top) and 200μm (bottom). p, (Left) Representative images of coronal brains sections from Lyve1Cre::Csf1rfl/fl (Cre+) and Csf1rfl/fl (Cre−) mice co-stained for anti-Collagen-IV (cyan, right panels) and DAPI. (Right) High magnification images showing Collagen-IV location at the vicinity of CD31+ blood vessels (red), and corresponding quantification. Scale bars, 2mm (left) and 200μm (Right). q, Three-month-old Cre+ and Cre− mice received an i.c.m. injection of Dotarem (0.754kDa; 5μl) and were immediately placed in prone position into the MRI device for dynamic imaging. r, Representative brain coronal images showing Dotarem distribution over an hour. Scale bar, 3mm. s, Quantification of Dotarem signal fold increase over time, n = 8 Cre− mice, and 5 Cre+ mice; repeated measures 2-way ANOVA with Geisser-Greenhouse correction. t, In vivo imaging of OVA coverage at the MCA level in Lyve1Cre::Csf1rfl/fl (Cre+) and Csf1rfl/fl (Cre−) mice, with corresponding representative images and quantification. Scale bar, 1mm; n = 7 Cre− mice, and 5 Cre+ mice; repeated measures 2-way ANOVA with Geisser-Greenhouse correction. u, Representative images showing OVA distribution in whole brains in Lyve1Cre::Csf1rfl/fl (Cre+) and Csf1rfl/fl (Cre−) mice. Scale bar, 5mm. v, OVA coverage in coronal sections of Lyve1Cre::Csf1rfl/fl (Cre+) and Csf1rfl/fl (Cre−) mice. Scale bar, 2mm. For u and v: n = 7 Cre− mice, and 3 Cre+ mice; two-tailed unpaired Welch’s t-test. x, Quantification of CD31 coverage in Lyve1Cre::Csf1rfl/fl (Cre+) and Csf1rfl/fl (Cre−) mouse brain sections. n = 7 Cre− mice, and 3 Cre+ mice; two-tailed unpaired Welch’s t-test. y, Quantification of MMP activity from Lyve1Cre::Csf1rfl/fl (Cre+) and Csf1rfl/fl (Cre−) mice measured by fluorescence spectrometry after 15 min of incubation. n = 8 Cre− mice, and 4 Cre+ mice; two-tailed unpaired Welch’s t-test. z, Quantification of intracranial pressure from Lyve1Cre::Csf1rfl/fl (Cre+) and Csf1rfl/fl (Cre−) mice. n = 6 Cre− mice, and 4 Cre+ mice; two-tailed unpaired Welch’s t-test. All data are presented as mean values +/− SEM.
Extended Data Fig 8.
Extended Data Fig 8.. PBMs in normal aging.
a, Experimental schematic: young adult (3-month-old) and aged (24-month-old) mice received an i.c.m. injection of OVA (45kDa; 1mg/ml; 5μl). Immediately after the injection, mice were placed on their side under the stereomicroscope for dynamic imaging. b, Representative images showing OVA distribution over time. Scale bar, 1mm. c, Quantification of OVA signal fold increase over time in 3m and 24m old mice. n = 5 mice/group; repeated measures 2-way ANOVA with Geisser-Greenhouse correction. d and e, 3m and 24m old mice received an i.c.m. injection of OVA. Mice were perfused one hour later. d, Representative images showing OVA distribution in whole brains in 3m and 24m old mice, and corresponding quantification. Scale bar, 5mm. e, OVA coverage in coronal sections in 3m and 24m old mice, and corresponding quantification. Scale bar, 2mm. For d and e: n = 5 3m mice, and 4 24m mice; two-tailed unpaired Welch’s t-test. f, 3m and 24m old mice received an i.c.m. injection of Texas Red (3kDa; 1mg/ml; 5μl), brains were harvested one hour later. Representative images of Texas Red coverage (red) and corresponding quantification. Scale bar, 2mm. n = 5 mice/group; two-tailed unpaired Welch’s t-test. g, Pie chart representation of the quantification of Lyve1+MHCII− versus Lyve1-MHCII+ PBMs by immunostaining. n = 5 mice/group; two-tailed unpaired Welch’s t-test. h, Representative flow cytometry plots from 3m and 24m old mice showing PBM subtypes, characterized by their expression of CD38 and MHCII. i-k, Quantification of i: CD206+ PBMs; j: MHCII+CD38− PBMs and k: MHCII-CD38+ PBMs. For i-k, n = 6 mice/group; two-tailed unpaired Welch’s t-test. l, 3m and 24m old mice received an i.c.m. injection of pHrodo particles (1μm; 5μl), which became fluorescent only after being phagocytosed. Scale bar, 2mm. m, Representative confocal image showing pHrodo particles being phagocytosed by CD206+ PBMs. Scale bar, 50μm. n, pHrodo-positive PBMs can also be detected by flow cytometry. o, Quantification of pHrodo+MHCII-CD38+ versus pHrodo+MHCII+CD38− PBMs in 3m old mice. n = 6 mice; paired t-test. p, Representative images of 3m and 24m old mice showing pHrodo particle repartition at the MCA level, and corresponding quantification. Scale bar, 2mm. q, Quantification of pHrodo+CD206+ PBMs in 3m and 24m old mice. For p and q: n = 6 mice/group; two-tailed unpaired Welch’s t-test. r, Quantification of pHrodo+MHCII-CD38+ versus pHrodo+MHCII+CD38− PBMs in 24m old mice. n = 6 mice; paired t-test. s, 3m and 24m old mice received an i.c.m. injection of fluorescent beads (0.1μm thick; 5μl). Mice were perfused one hour later. Representative image from extracted whole brain showing bead repartition at low (left images) and higher magnification (insets, right images). Scale bars, 2mm and 1mm (insets). t, Quantification of brain bead coverage. u, Quantifications of total perivascular space (space between the two sides of the MCA where beads were found to accumulate) v, Quantification of MCA diameter (identified by the i.v. lectin injection). w, Quantification of the functional space where beads were found to be accumulated. For t-w: n = 5 mice/group; two-tailed unpaired Welch’s t-test. x, Brain coronal sections from 3m and 24m old mice were co-stained for anti-AQP4 (yellow) and anti-CD31 (cyan) to measure the perivascular space size. Scale bars, 50μm and 10μm (insets), and representation of the perivascular space (PVS) diameter in 3m (middle) and 24m (right) old mice. y, Quantification of perivascular space diameter. n = 5 mice/group; two-tailed unpaired Welch’s t-test. z, (Left) Brain coronal sections were stained for anti-Laminin (cyan) and DAPI (blue). Scale bar, 2mm. (Right) High magnification images showing Laminin (cyan) in association with CD31+ blood vessels (red). Scale bar, 200μm. All data are presented as mean values +/− SEM.
Extended Data Fig 9.
Extended Data Fig 9.. M-CSF treatment in old mice.
a, Violin plots showing expression of Csf1r mostly by PBMs, monocytes and microglia, as well as expression of Csf1, expressed mostly by endothelial, mural and microglial cells, from the mouse 5xFAD single-cell RNA sequencing dataset. b and c, Brain coronal sections of aged mice six hours after i.c.m. injection of artificial CSF (aCSF) or M-CSF (10μg/ml; 5μl) were stained for b: anti-Collagen-IV (left panels) or c: anti-Laminin (right panels) and co-stained for DAPI, Scale bars, 2mm and 200μm. d, Experimental schematic: 24m old mice received an i.c.m. injection of M-CSF (or aCSF as a control), and mice received an i.c.m. injection of OVA to assess CSF flow 24 hours later. e, Representative images showing OVA coverage at the MCA level, and corresponding quantification. Scale bar, 500μm. n = 7 mice treated with aCSF, and 8 mice treated with M-CSF; two-tailed unpaired Welch’s t-test. f, Experimental schematic: 24m old mice received an i.c.m. injection of M-CSF (or aCSF as a control), and MMP activity was assessed by fluorescence spectrometry 24 hours later. g, Quantification of MMP activity. n = 8 mice/group; two-tailed unpaired Welch’s t-test. All data are presented as mean values +/− SEM.
Extended Data Fig 10.
Extended Data Fig 10.. PBMs in an Alzheimer’s disease mouse model and in AD patients.
a and b, One month after CLO or PBS liposome injection, 5xFAD mice received an i.c.m. injection of OVA, and brains were analyzed one hour later. a, Representative images and quantification of OVA distribution in whole brains. Scale bar, 2mm. b, Representative images and quantification of OVA coverage on brain coronal sections. Scale bar, 2mm. For a and b, n = 7 5XFAD mice treated with PBS, and 8 5XFAD mice treated with CLO; two-tailed unpaired Welch’s t-test. c, Quantification of Aβ coverage in amygdala, cortex and hippocampus. n = 7 5XFAD mice treated with PBS, and 8 5XFAD mice treated with CLO; two-tailed unpaired Welch’s t-test. d, tSNE plot showing 35 different clusters on the 5xFAD mouse single-cell RNA sequencing dataset, based on expression of CD13, CD31 and CD45. e, Mrc1 expression in macrophage cluster allows PBM identification. f, Heatmap showing top 10 positively differentially expressed genes per cluster by adjusted p-value. g, GO Pathway analysis showing up- and down-regulated pathways in 5xFAD mice compared to their WT littermates. Over-representation test. h, The RNA Magnet algorithm determined that PBMs interact preferentially with vascular smooth muscle cells (VSMCs), pericytes and fibroblast-like cells (FLCs). i, Single-nuclei RNA sequencing on familial, pre-symptomatic, sporadic and non-AD patients. j, GO Pathway analysis showing up- and down-regulated pathways in familial AD patients compared to controls. Over-representation test. k, Gene expression levels of Ifngr1 and Ifngr2 from immune versus stromal cells from the mouse 5xFAD single-cell RNA sequencing dataset. l and m, Wild-type mice received an i.c.m. injection of artificial CSF (aCSF) or interferon gamma (IFNγ, 20ng/ml; 1μl). The same mice received an i.c.m. injection of OVA (1mg/ml; 5μl) 3 hours later and brains were harvested one hour later. l, Representative images and quantification of OVA distribution in whole brains. m, Representative images showing OVA coverage on brain coronal sections and corresponding quantification. For l and m, n = 5 mice/group; two-tailed unpaired Welch’s t-test. n, Proposed model that recapitulates the findings. All data are presented as mean values +/− SEM.
Fig. 1:
Fig. 1:. PBMs sample CSF and regulate its flow dynamics.
a, CD206+ PBMs are located in close association with i.v.-injected lectin+ blood vessels. Scale bar, 500μm. b, CD206+ PBMs can be separated into two major subtypes by their expression of Lyve1 or MHCII co-stained for DAPI. Scale bar, 50μm. c, Quantification of Lyve1+ versus MHCII+ PBMs (average of both perivascular space and leptomeninges). Data in c, n = 5 mice. d, WT mice received an i.c.m. injection of Alexa-647 conjugated ovalbumin (OVA). Mice were perfused one hour after OVA injection. Representative stereomicroscopy images showing whole brain OVA distribution from top (top raw) and side (bottom row) views. OVA is mostly distributed around the olfactory bulbs (Ob), middle cerebral artery (MCA) and cerebellum (Cblm). Scale bars, 5mm and 1mm (insets). e, OVA distribution in brain coronal sections (co-stained for DAPI) is largely found in leptomeninges and penetrating blood vessels. At higher magnification, OVA distribution appears also to be cellular (inset). Scale bars, 2mm and 200μm (inset). f, OVA+ cells are expressing PBM marker CD206. Scale bar, 100μm. g, One week after PBM depletion using i.c.m. clodronate liposomes (CLO), mice received an i.c.m. injection of OVA and were perfused one hour later. h, Representative images of brain sections showing CD206 and i.v.-injected lectin staining. Scale bar: 200μm. i, Quantification of CD206+ cells; n = 5 mice/group; two-tailed unpaired Welch’s t-test. j, Representative images showing OVA distribution in whole brains in PBM-depleted and control mice, and corresponding quantification. Scale bar, 5mm. k, OVA coverage in brain coronal sections, and corresponding quantification. Scale bar, 2mm. For j and k: n = 6 mice/group; two-tailed unpaired Welch’s t-test. All data are presented as mean values +/− SEM.
Fig. 2:
Fig. 2:. In vivo evidence of PBMs regulating CSF flow dynamics.
a, One week after PBM depletion, mice received an i.c.m. injection of Dotarem and were placed in prone position into the MRI device for dynamic imaging. b, Representative brain coronal images showing Dotarem distribution over an hour. Scale bar, 3mm. c, Quantification of Dotarem signal fold increase over time, n = 5 mice treated with PBS, and 7 mice treated with CLO; Repeated measures 2-way ANOVA with Geisser-Greenhouse correction. d, One week after CLO or PBS containing liposome injection, the right temporal bone was exposed and mice received an i.c.m. injection of OVA. Mice were immediately imaged on their side by stereomicroscopy. e, Representative in vivo OVA imaging at low magnification 20 minutes after i.c.m. injection. Scale bar, 5mm. f, Representative images showing OVA distribution over an hour at the proximal part of the MCA. Scale bar, 1mm. g, Quantification of OVA signal fold increase over time. n = 6 mice/group; Repeated measures 2-way ANOVA with Geisser-Greenhouse correction. All data are presented as mean values +/− SEM.
Fig. 3:
Fig. 3:. PBMs regulate CSF flow dynamics through ECM remodeling and arterial motion.
a, Representative images of brain coronal sections showing Collagen-IV and DAPI staining. High magnification images showing Collagen-IV association with CD31+ blood vessels. Scale bars, 2mm and 200μm. b, Quantification of Collagen-IV coverage. c, Quantification of Laminin coverage. For b and c, n = 6 mice/group; two-tailed unpaired Welch’s t-test. d, One week after CLO or PBS treatment, brains were extracted and incubated with MMP substrate. e, Quantification of MMP activity. n = 6 mice/group; two-tailed unpaired Welch’s t-test. f, One week after CLO or PBS treatment, mice were imaged using photoacoustic microscopy. Representative images showing vessels before (left) and during (middle) 10% CO2 challenge and corresponding kymographs (right). Scale bar: 30μm. g, Quantification of vessel diameter fold increase over time. n = 7 mice treated with PBS, and 9 mice treated with CLO; Repeated measures 2-way ANOVA with Geisser-Greenhouse correction. h, Quantification of vessel diameter fold increase during CO2 challenge. n = 7 mice treated with PBS, and 9 mice treated with CLO; two-tailed unpaired Welch’s t-test. i, One week after CLO or PBS liposome injection, mice were imaged by stereomicroscopy. Representative images showing vessels before (left) and during (middle) whisker stimulation and corresponding kymographs (right). Scale bar: 30μm. j, Quantification of vessel diameter fold increase over time. n = 6 mice treated with PBS, and 8 mice treated with CLO; repeated measures 2-way ANOVA with Geisser-Greenhouse correction. k, Single-cell RNA sequencing demonstrating 5 PBM clusters. l, The RNA Magnet algorithm determined that PBM cluster 2 interacts preferentially with vascular smooth muscle cells (VSMCs) and capillary endothelial cells (cEC), while PBM clusters 0 and 1 preferentially interact with pericytes. All data are presented as mean values +/− SEM.
Fig 4.
Fig 4.. PBMs in aged mice.
a, 3-month-old (3m) and 24-month-old (24m) mice received Dotarem i.c.m. and were placed into the MRI device. b, Representative images showing Dotarem distribution over an hour. Scale bar, 3mm. c, Quantification of Dotarem signal fold increase over time, n = 5 3m mice, and 6 24m mice; repeated measures 2-way ANOVA with Geisser-Greenhouse correction. d, Representative images showing CD206, Lyve1, MHCII and DAPI staining. Scale bar, 20μm. e, Quantification of CD206+ PBMs. f, Quantification of Lyve1+CD206+ PBMs. g, Quantification of MHCII+CD206+ PBMs. For e-g: n = 5 mice/group; two-tailed unpaired Welch’s t-test. h, Representative images brain coronal sections showing Collagen-IV and DAPI staining. High magnification images showing Collagen-IV association with CD31+ blood vessels. Scale bars, 2mm and 200μm. i, Quantification of Collagen-IV coverage. j, Quantification of Laminin coverage. For i and j: n = 6 3m mice, and 4 24m mice; two-tailed unpaired Welch’s t-test. k, Six hours after i.c.m. injection of M-CSF or artificial CSF (aCSF), mice received OVA i.c.m. and were perfused one hour later. l, Representative images and quantification of OVA distribution in whole brains and m, brain coronal sections. n = 4 mice treated with aCSF, and 5 mice treated with M-CSF; two-tailed unpaired Welch’s t-test. n, Six hours after M-CSF treatment, brains were extracted and incubated with MMP substrate. o, Quantification of MMP activity. n = 6 mice treated with aCSF, and 7 mice treated with M-CSF; two-tailed unpaired Welch’s t-test. p, High magnification brain coronal sections images showing Collagen-IV and DAPI staining. Scale bar, 200μm. q, Quantification of Collagen-IV coverage. r, Quantification of Laminin coverage. For q and r: n = 4 mice treated with aCSF, and 5 mice treated with M-CSF; two-tailed unpaired Welch’s t-test. All data are presented as mean values +/− SEM.
Fig. 5:
Fig. 5:. PBMs in human Alzheimer’s disease and 5xFAD mouse model of amyloidosis.
a, Experimental schematic: 5xFAD mice received an i.c.m. injection of PBS or CLO liposomes. One month later, mice received an i.c.m. injection of OVA and brains were harvested one hour later. b, Representative brain coronal section images showing amyloid-β (Aβ) plaque load and corresponding quantification. Scale bar, 2mm; n = 7 mice treated with PBS, and 8 mice treated with CLO; two-tailed unpaired Welch’s t-test. c, Single-cell RNA sequencing of the brain cortex from 6/7-month-old 5xFAD mice and their WT littermates. n = 8 mice/group. d, Macrophage populations were isolated from the 5xFAD mice single-cell RNA sequencing. Nine clusters could be identified. e, Volcano plot corresponding to down- and up-regulated genes in PBMs comparing 5xFAD mice vs. their WT littermates. F-test with adjusted degrees of freedom based on weights calculated per gene with a zero-inflation model and Benjamini-Hochberg adjusted P values. f, Human single-nuclei RNA sequencing from familial AD and control patients. Six cell populations were used in this dataset: microglia, fibroblasts, endothelial cells, mural cells, lymphocytes and PBMs. g, Volcano plot corresponding to down- and up-regulated genes in PBMs comparing patients suffering from familial AD vs. non-AD patients. F-test with adjusted degrees of freedom based on weights calculated per gene with a zero-inflation model and Benjamini-Hochberg adjusted P values. h, Violin plots corresponding to CD163 gene expression from both human single-nuclei (left) and mouse single-cell sequencing (right). All data are presented as mean values +/− SEM.

Comment in

References

    1. Ginhoux F & Guilliams M Tissue-Resident Macrophage Ontogeny and Homeostasis. Immunity 44, 439–449 (2016). - PubMed
    1. Masuda T et al. Specification of CNS macrophage subsets occurs postnatally in defined niches. Nature 604, 740–748 (2022). - PubMed
    1. Alves de Lima K et al. Meningeal γδ T cells regulate anxiety-like behavior via IL-17a signaling in neurons. Nat Immunol 21, 1421–1429 (2020). - PMC - PubMed
    1. Filiano AJ et al. Unexpected role of interferon-γ in regulating neuronal connectivity and social behaviour. Nature 535, 425–429 (2016). - PMC - PubMed
    1. Konsman JP, Parnet P & Dantzer R Cytokine-induced sickness behaviour: mechanisms and implications. Trends in Neurosciences 25, 154–159 (2002). - PubMed

Method References:

    1. Erde J, Loo RRO & Loo JA Improving Proteome Coverage and Sample Recovery with Enhanced FASP (eFASP) for Quantitative Proteomic Experiments. Methods Mol Biol 1550, 11–18 (2017). - PMC - PubMed
    1. Lun ATL, McCarthy DJ & Marioni JC A step-by-step workflow for low-level analysis of single-cell RNA-seq data with Bioconductor. F1000Res 5, 2122 (2016). - PMC - PubMed
    1. McCarthy DJ, Campbell KR, Lun ATL & Wills QF Scater: pre-processing, quality control, normalization and visualization of single-cell RNA-seq data in R. Bioinformatics 33, 1179–1186 (2017). - PMC - PubMed
    1. Butler A, Hoffman P, Smibert P, Papalexi E & Satija R Integrating single-cell transcriptomic data across different conditions, technologies, and species. Nat Biotechnol 36, 411–420 (2018). - PMC - PubMed
    1. Van den Berge K et al. Observation weights unlock bulk RNA-seq tools for zero inflation and single-cell applications. Genome Biol 19, 24 (2018). - PMC - PubMed

Publication types