. 2022 Nov;611(7937):762-768.
doi: 10.1038/s41586-022-05407-4. Epub 2022 Nov 9.

Locomotion activates PKA through dopamine and adenosine in striatal neurons

Affiliations

Locomotion activates PKA through dopamine and adenosine in striatal neurons

Lei Ma et al. Nature. 2022 Nov.

Abstract

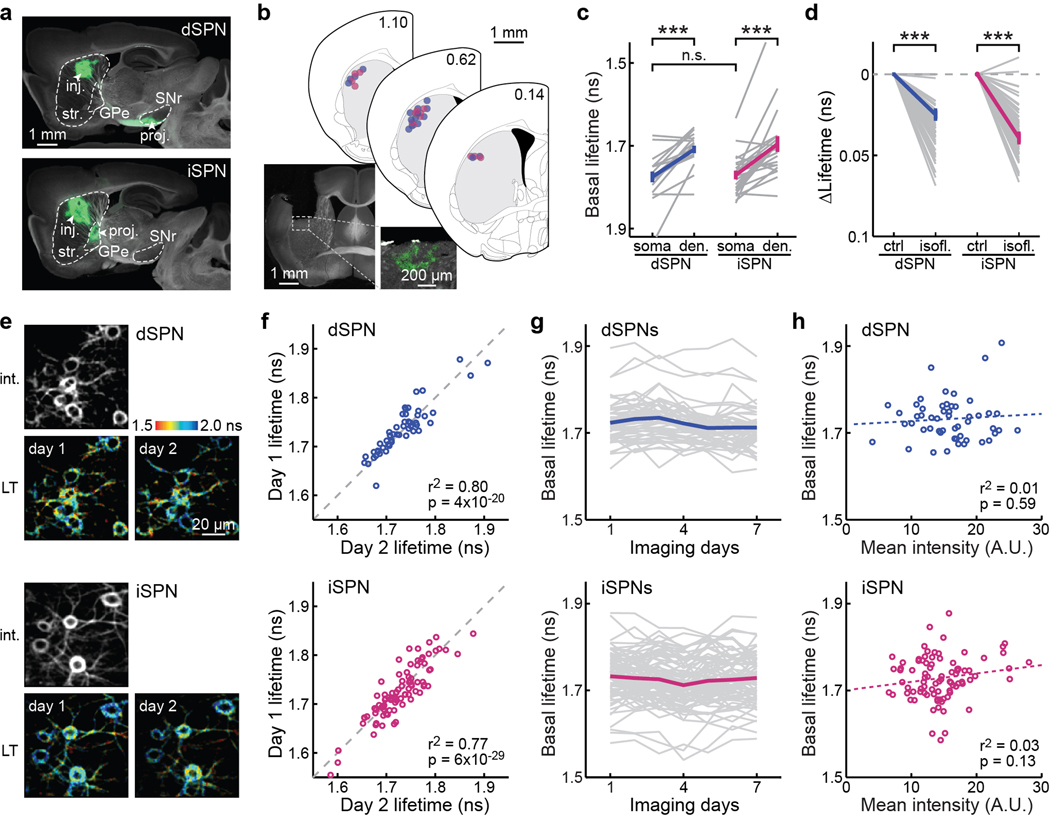
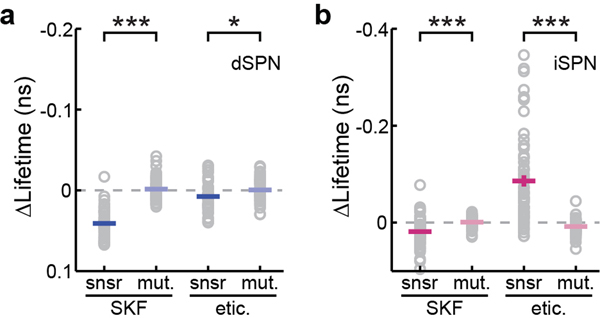
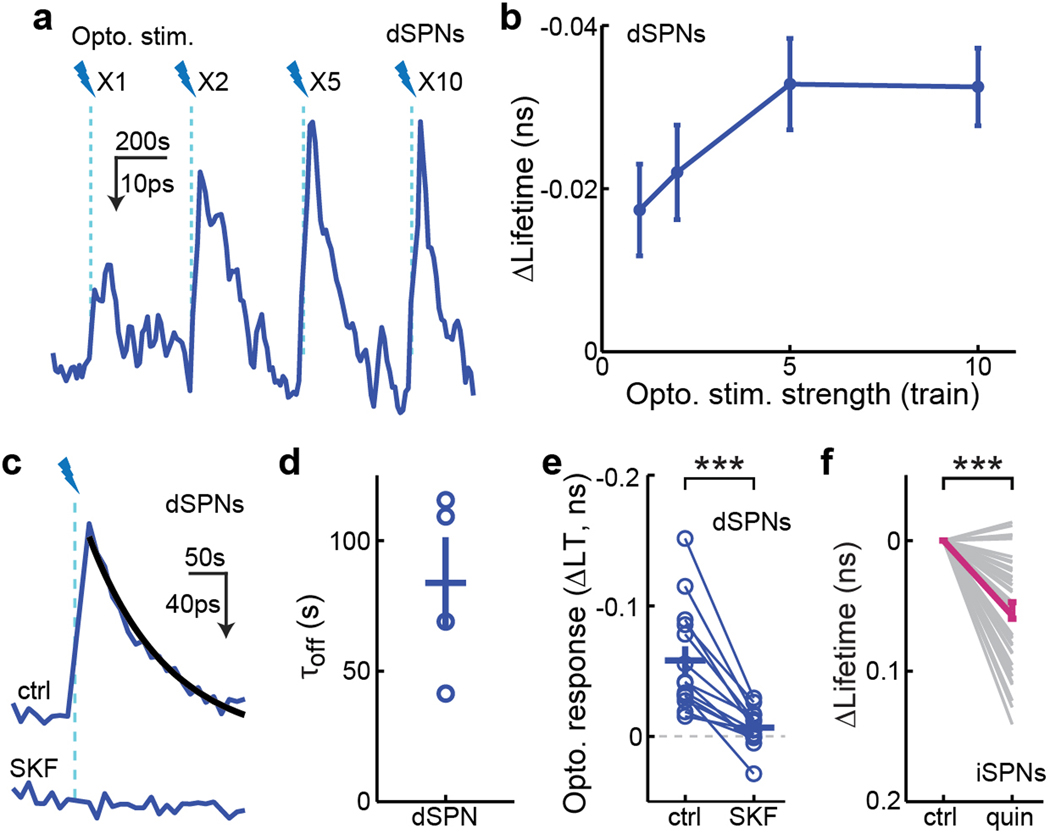
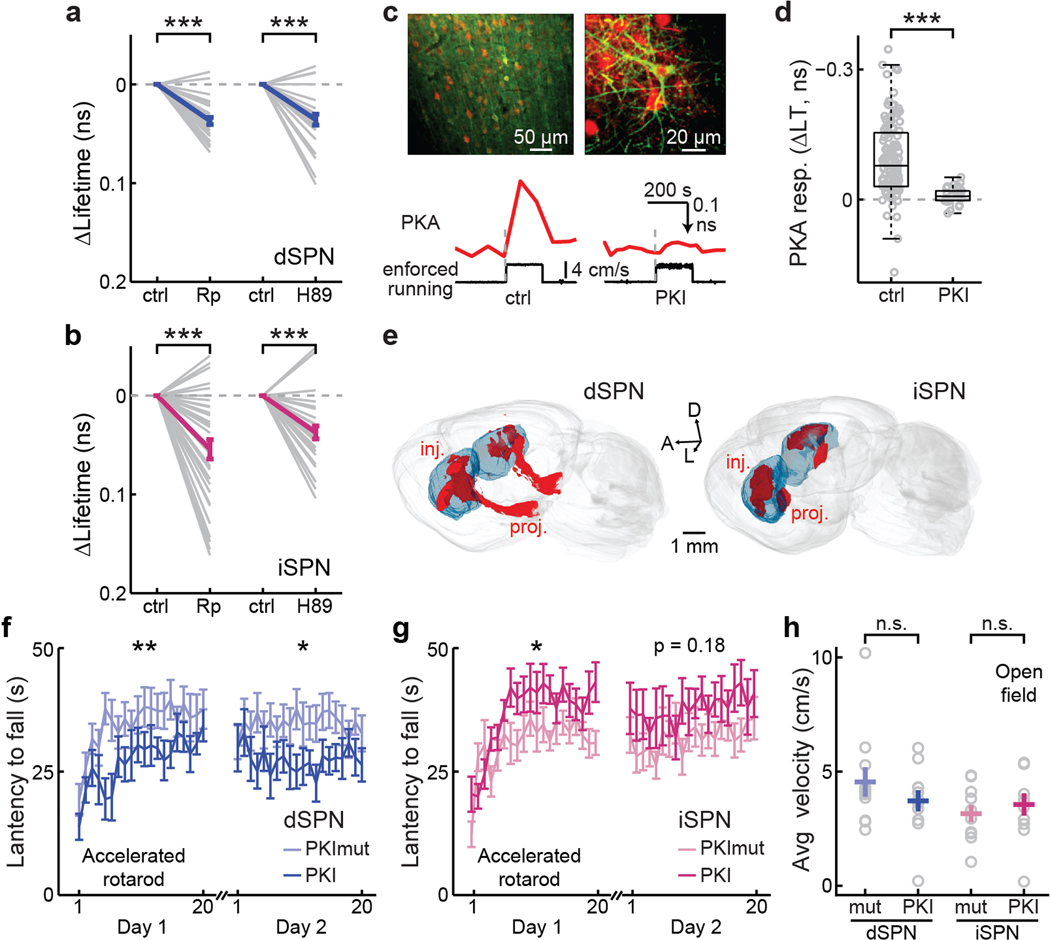
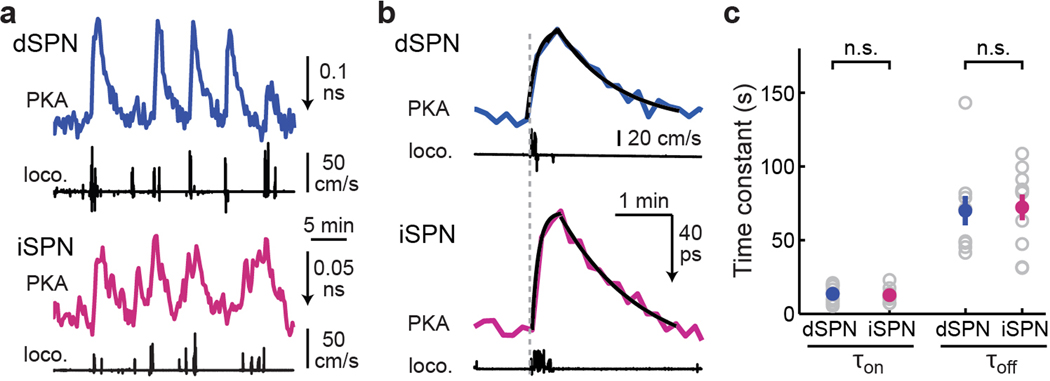
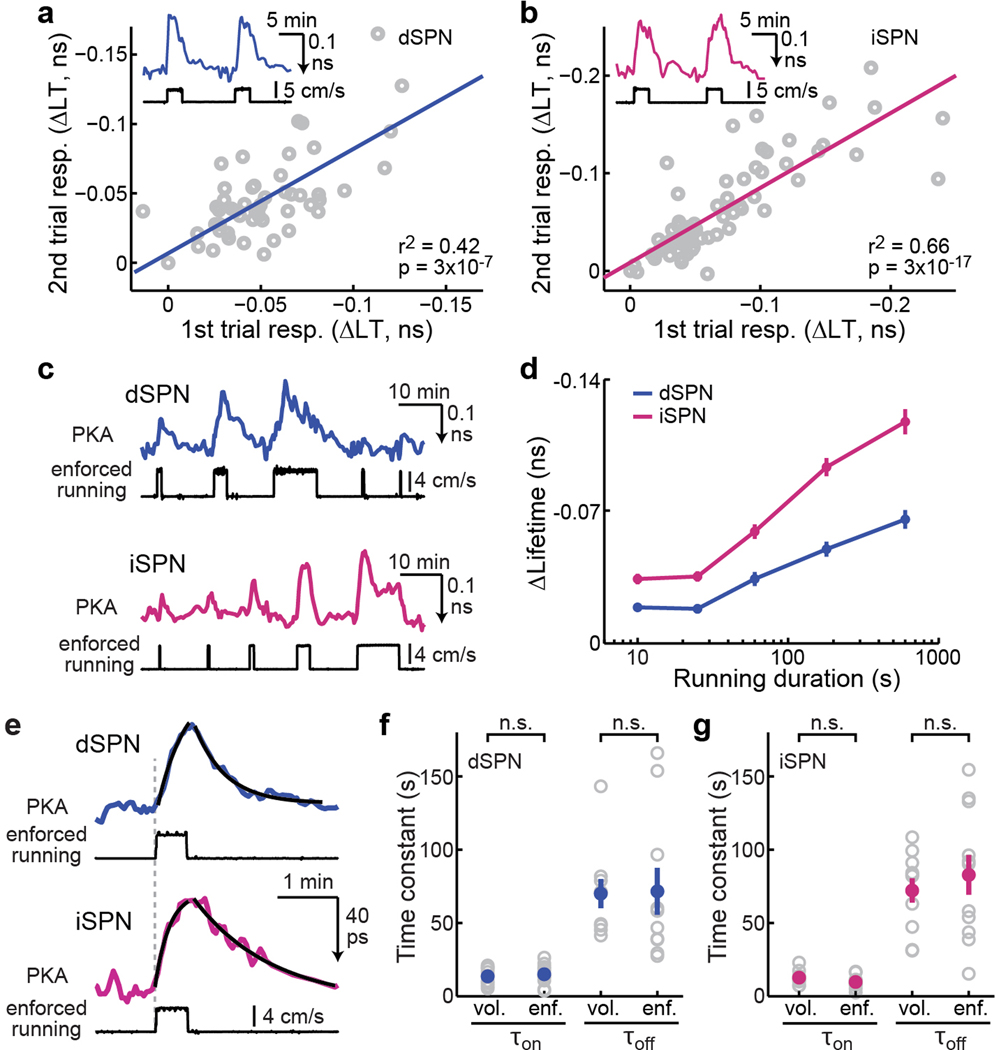
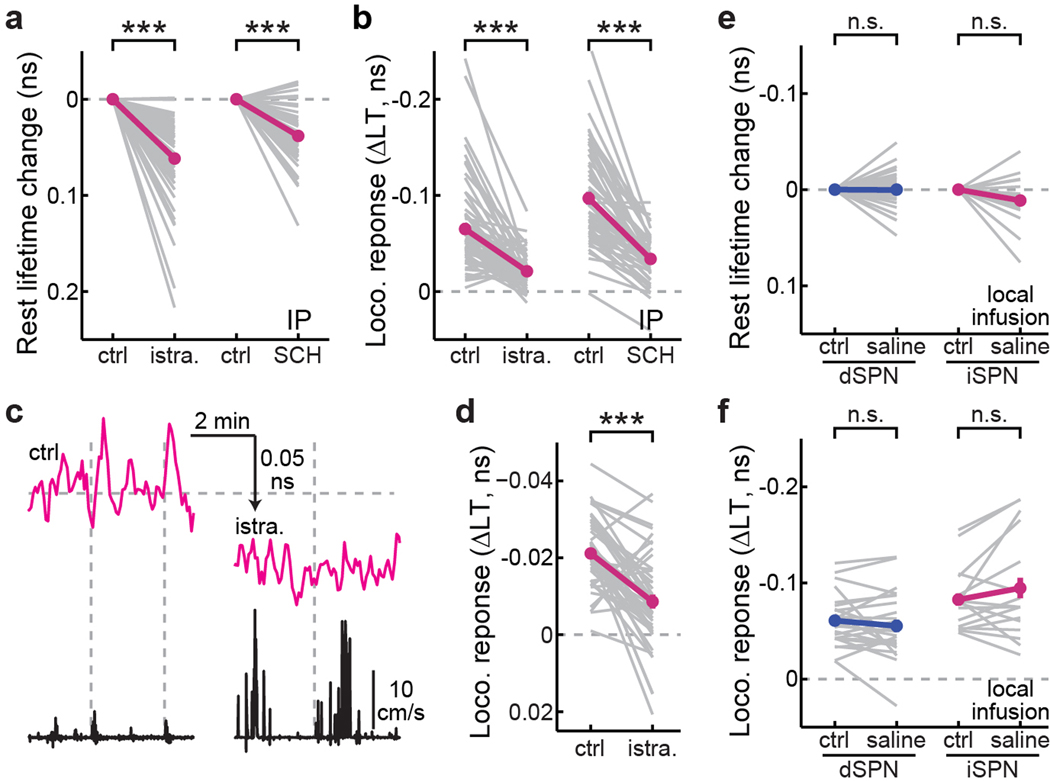
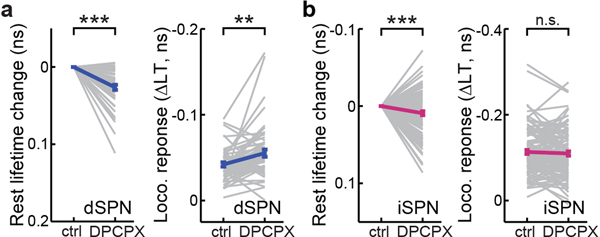
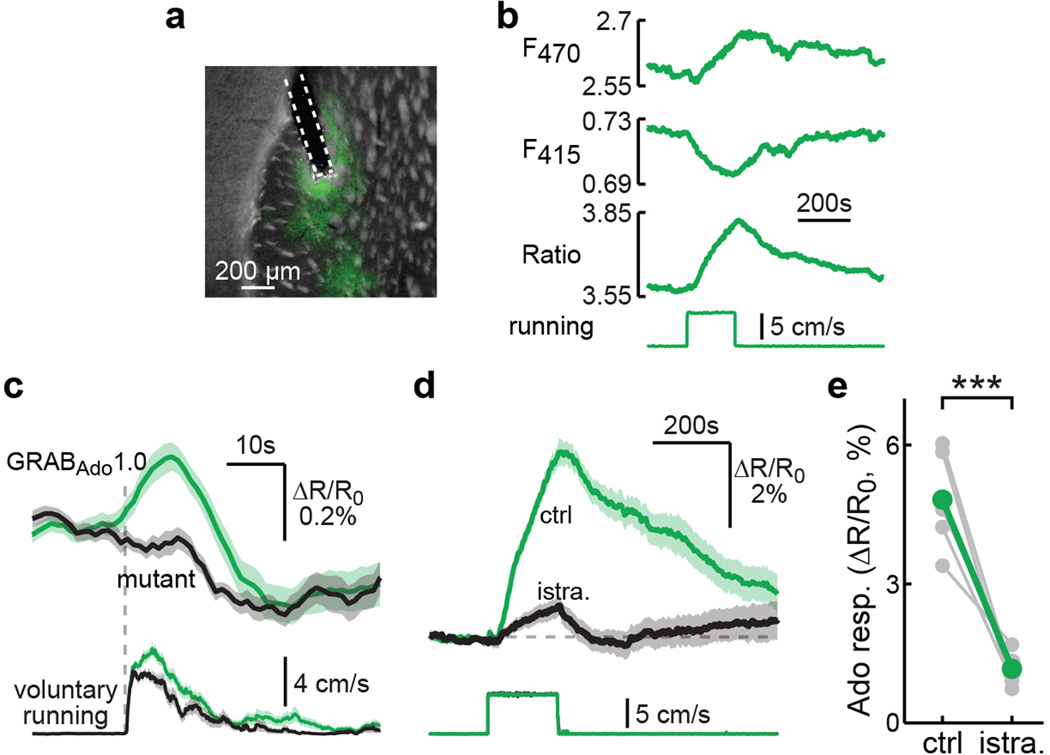
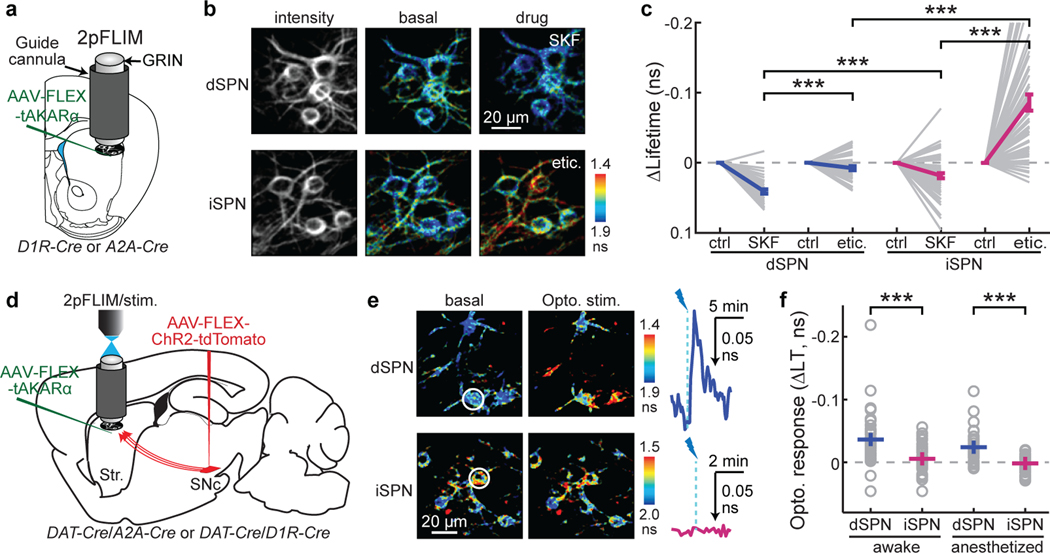
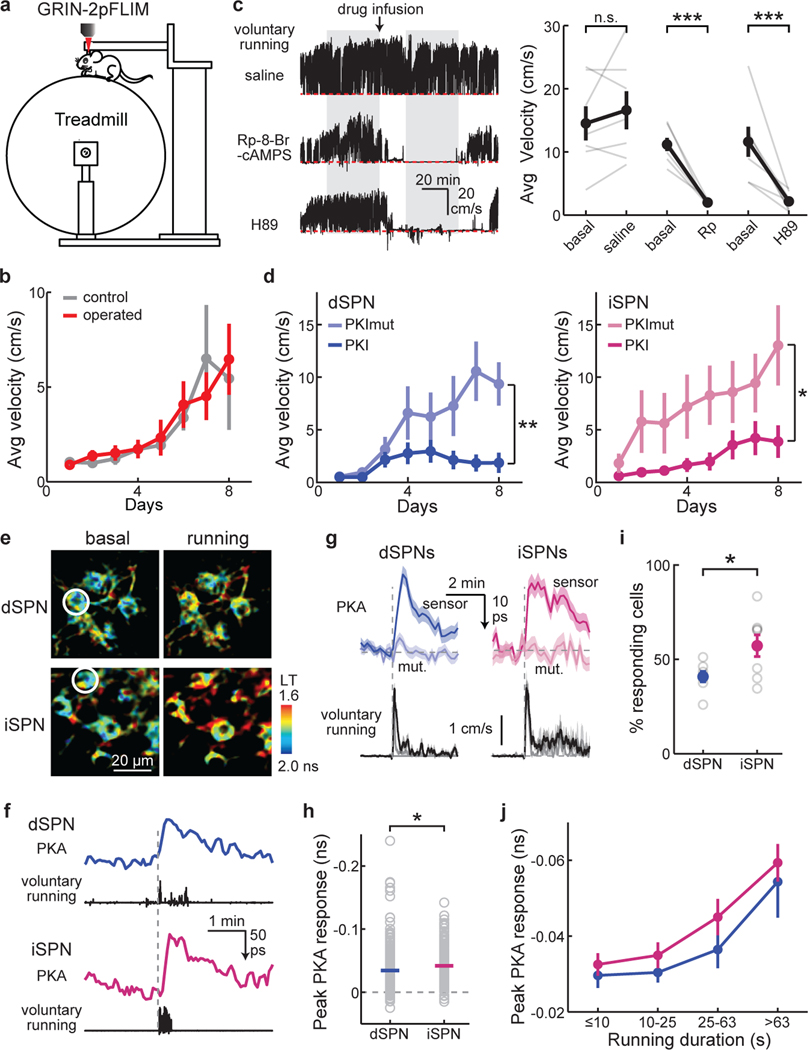
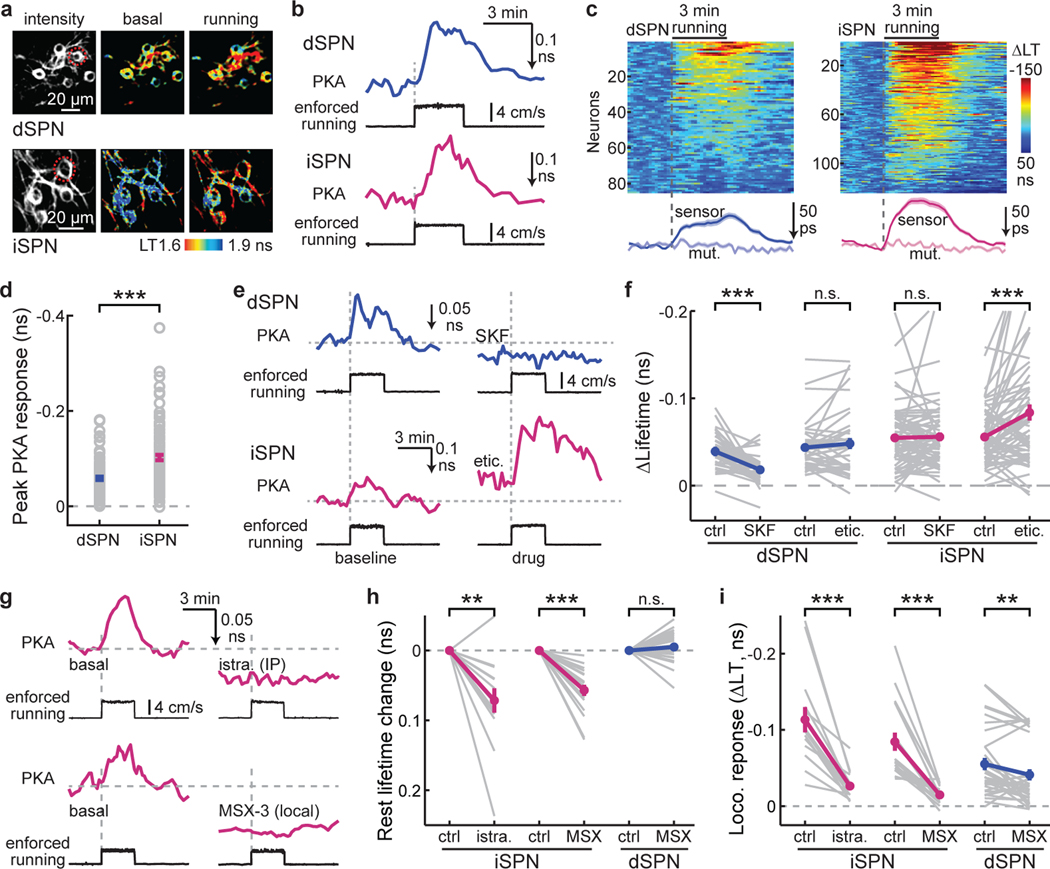
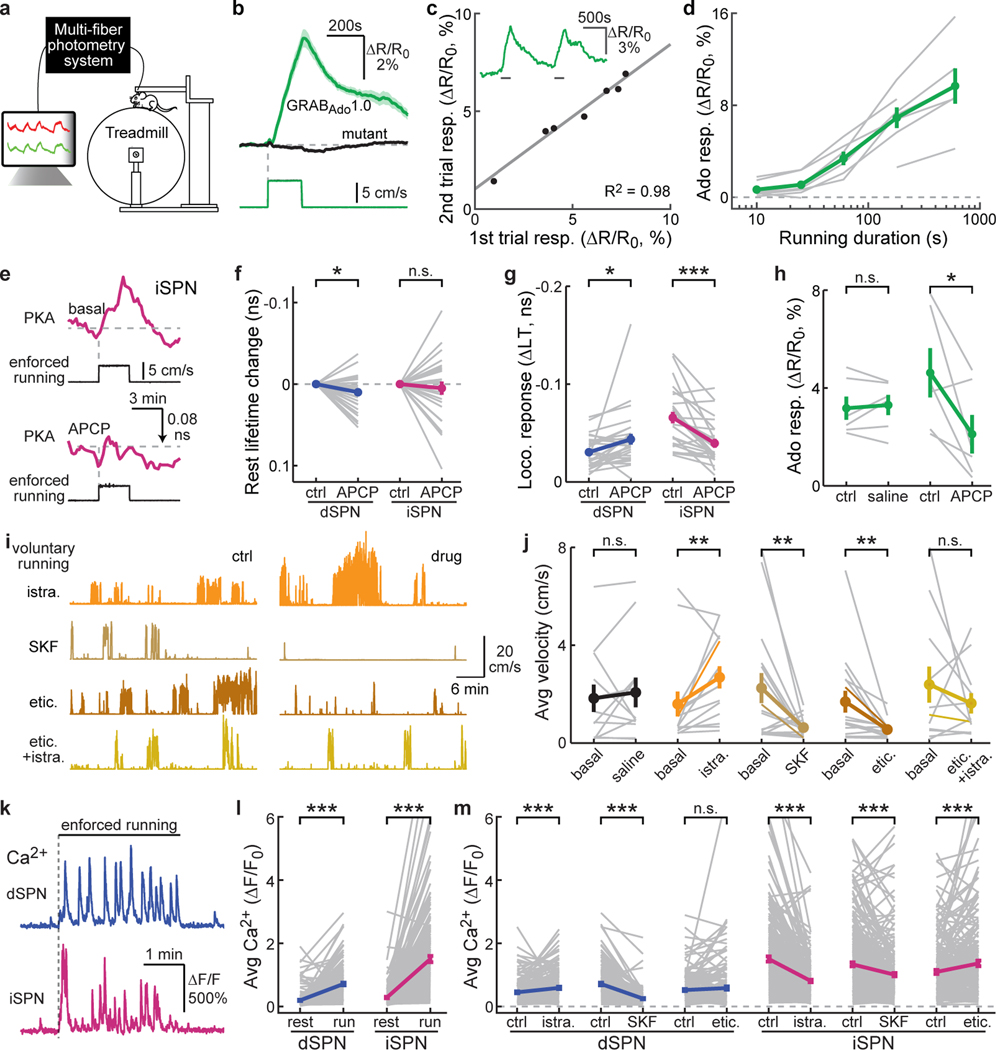
The canonical model of striatal function predicts that animal locomotion is associated with the opposing regulation of protein kinase A (PKA) in direct and indirect pathway striatal spiny projection neurons (SPNs) by dopamine1-7. However, the precise dynamics of PKA in dorsolateral SPNs during locomotion remain to be determined. It is also unclear whether other neuromodulators are involved. Here we show that PKA activity in both types of SPNs is essential for normal locomotion. Using two-photon fluorescence lifetime imaging8-10 of a PKA sensor10 through gradient index lenses, we measured PKA activity within individual SPNs of the mouse dorsolateral striatum during locomotion. Consistent with the canonical view, dopamine activated PKA activity in direct pathway SPNs during locomotion through the dopamine D1 receptor. However, indirect pathway SPNs exhibited a greater increase in PKA activity, which was largely abolished through the blockade of adenosine A2A receptors. In agreement with these results, fibre photometry measurements of an adenosine sensor11 revealed an acute increase in extracellular adenosine during locomotion. Functionally, antagonism of dopamine or adenosine receptors resulted in distinct changes in SPN PKA activity, neuronal activity and locomotion. Together, our results suggest that acute adenosine accumulation interplays with dopamine release to orchestrate PKA activity in SPNs and proper striatal function during animal locomotion.


Conflict of interest statement

Competing Interests

The authors declare no competing interests.

Figures

Extended Data Fig. 1.
Extended Data Fig. 1.. dSPNs and iSPNs exhibit cell-specific set points of basal PKA activity.
a, Example projections from dSPNs and iSPNs, as visualized by Cre-dependent GFP expression in the dorsal striatum of Drd1a-cre (5 mice) and Adora2a-cre mice (2 mice), respectively. GPe: globus pallidus, external segment; SNr: substantia nigra pars reticulata; inj: injection site; proj: projection site. b, Representative post hoc histology section of an animal with GRIN lens implanted and tAKARα expressed in iSPNs, and centers of GRIN lens implantations for dSPNs (blue, 17 mice) and iSPNs (magenta, 15 mice), as mapped onto nearby coronal sections from Franklin & Paxinos (2007). Section positions in millimeters anterior to bregma are indicated. c, Comparison of basal tAKARα lifetimes between dSPN or iSPN somata and their corresponding dendrites. n (neurons/mice) = 16/4 for dSPN and 22/6 for iSPN. Between somata and dendrites, two-tailed paired Student’s t-test, from left to right, p = 1.4×10⁻⁴ and 1.5×10⁻⁴; dF = 15 and 21; t = 5.1 and 4.6. Between somata of dSPNs and iSPNs, two-tailed unpaired Student’s t-test, p = 0.79; dF = 36; t = 0.26. d, Collective changes of basal PKA activity responding to isoflurane (isofl.) exposure (1.5%). n (neurons/mice) = 52/5 for dSPNs and 71/7 for iSPNs. Two-tailed paired Student’s t-test, from left to right, p = 5.8×10⁻²⁵ and 3.5×10⁻³²; dF = 51 and 70; t = −19.2, and −21.2. e & f, Representative intensity and corresponding lifetime (LT) images across two days (e) and correlation of basal lifetimes of the same cells (f) for dSPNs and iSPNs. The p values are from the fit. g, Basal lifetimes of the same cells across seven consecutive days. h, Correlation of basal lifetimes with the average fluorescence intensity of the corresponding cells. The p values are from the fit. For panels eh: n (neurons/fields of view [FOVs]/mice) = 52/12/5 for dSPNs and 86/19/8 for iSPNs. All error bars represent SEM and their centers represent the mean. n.s.: p > 0.05; ***: p ≤ 0.001.
Extended Data Fig. 2.
Extended Data Fig. 2.. tAKARα response to pharmacological manipulations depends on sensor phosphorylation.
a & b, Collective responses of tAKARα (snsr) and its phosphorylation-deficient mutant (mut.) to the indicated drug application in dSPNs (a) and iSPNs (b). From left to right, n (neurons/mice) = 38/6, 54/4, 38/6, and 41/4 for dSPNs, and 63/8, 57/4, 63/8, and 60/4 for iSPNs. Two-tailed unpaired Student’s t-test for both panels, from left to right, p = 1.7×10⁻²¹, 0.029, 6.0×10⁻⁶, and 2.0×10⁻¹²; dF = 90, 77, 118, and 121; t = 12.6, 2.2, 4.7, and −7.8. All error bars represent SEM and their centers represent the mean. *: p ≤ 0.05; ***: p ≤ 0.001.
Extended Data Fig. 3.
Extended Data Fig. 3.. Supporting data for PKA activity elicited by optogenetic dopamine releases.
a & b, Representative trace (a) and dose-response curve (b) of PKA response in a dSPN elicited by different numbers of trains (1 train/s of 20 Hz 10 × 1.5-ms blue light [470 nm] pulses) of optogenetic stimulation. n (neurons/mice) = 38/5. c, Representative traces of PKA responses to 10 trains of optogenetic stimulation of dopamine release before (top) and after (bottom) intraperitoneal injection of SKF83566 (SKF). Black curve shows a single-exponential fit of the decaying phase of the response. d, The collective τoff of optogenetically-induced PKA responses. To achieve a high signal-to-noise ratio for proper fitting, PKA signals from an entire field of view, which included 3–5 neurons, were integrated. n (FOVs/mice) = 4/3. e, Collective PKA responses to 10 trains of optogenetic stimulation of dopamine release before and after intraperitoneal injection of SKF83566 (SKF). n (neurons/mice) = 14/3. Two-tailed paired Student’s t-test, p = 4.8×10⁻⁵; dF = 13; t = −6.0. f, Collective basal PKA activity responses to the D2R agonist, quinpirole (quin; 1 mg/kg). n (neurons/mice) = 43/4. Two-tailed paired Student’s t-test, p = 1.0×10⁻¹⁰; dF = 42; t = −8.5. All error bars represent SEM and their centers represent the mean. ***: p ≤ 0.001.
Extended Data Fig. 4.
Extended Data Fig. 4.. Supporting experiments for manipulating PKA activities using drug administration or PKI expression.
a & b, PKA activity responses to Rp-8-Br0cAMPS (Rp) and H89 for dSPNs (a) and iSPNs (b). From left to right, n (neurons/mice) = 27/3 and 22/3 for dSPNs, and 33/4 and 24/4 for iSPNs. Two-tailed paired Student’s t-test, p = 6.9×10⁻¹⁰ and 2.7×10⁻⁵, dF = 26 and 21, t = −9.4 and −5.3 for panel a; and p = 4.0×10⁻⁶ and 6.3×10⁻⁵, dF = 32 and 23, t = −5.5 and −4.9 for panel b. c, Representative images of co-expression of PKI (red) and the PKA sensor tAKARα (green) in the same cells (top), and representative traces of enforced running-induced PKA activity in neurons of the mouse motor cortex without (bottom left) and with (bottom right) PKI expression. n (FOVs/mice) = 19/9 without PKI and 14/4 with PKI. d, Collective enforced running-induced PKA responses in neurons of mice without or with PKI expression. n (neurons/mice) = 124/9 for control and 30/4 for PKI. Boxes indicate 25th and 75th percentile, with black lines indicating median and whiskers indicating 2.7x standard deviation. Two-tailed unpaired Student’s t-test, p = 1.4×10⁻⁷; dF = 152; t = 5.5. e, Representative 3D reconstructions of PKI expression in Drd1a-cre (left) and Adora2a-cre (right) mice. Inj.: injection; proj.: projection; A: anterior; L: lateral; and D: dorsal. f & g, Accelerated rotarod training for mice with PKI or a non-functional PKI mutant (PKImut) expressed in dSPNs (f) or iSPNs (g). n (mice) = 11 for both groups for dSPNs and 10 for both groups for iSPNs. Two-tailed paired Student’s t-test, for first and second days, respectively, dF = 10 and 10, t = −3.3 and −3.2 for dSPNs; and dF = 9 and 9, t = −2.6 and −1.5 for iSPNs. h, Averaged travel velocity of mice with PKI or a non-functional PKI mutant (PKImut) expressed in dSPNs or iSPNs freely moving in an open-field box (37 × 37 cm). From left to right, n (neurons/mice) = 11, 11, 10, and 10. Two-tailed paired Student’s t-test, p = 0.03 and 0.18; dF = 10 and 9; t = 1.2 and −0.6. All error bars represent SEM and their centers represent the mean. n.s.: p > 0.05; *: p ≤ 0.05; **: p ≤ 0.01; ***: p ≤ 0.001.
Extended Data Fig. 5.
Extended Data Fig. 5.. Additional data for voluntary running-induced PKA activity.
a, Representative single-cell traces of voluntary running-induced PKA response in a dSPN (top) and iSPN (bottom). b, Representative traces of integrated PKA response within an entire FOV elicited by short-duration (<30 s) voluntary running in a dSPN (top) and iSPN (bottom) overlaid with the fit for on- and off-phases (black). The entire FOV was integrated to achieve higher photon count and thereby signal-to-noise ratio, and the imaging rate was every 3 s. c, The kinetic time constant of short-duration voluntary running-induced PKA activity in dSPNs and iSPNs. n = 9 FOVs for dSPNs and 10 for iSPNs. Two-tailed Student’s t-test, from left to right dF = 17 and 17; t = 0.34 and −0.17. All error bars represent SEM and their centers represent the mean. n.s.: p > 0.05.
Extended Data Fig. 6.
Extended Data Fig. 6.. Additional data for enforced running-induced PKA activity.
a & b, Example trace (inset) and correlation of PKA responses of dSPNs (a) and iSPNs (b) to two consecutive enforced running trials in SPNs. n (neurons/mice) = 50/5 for dSPNs and 68/8 for iSPNs. The p values are from the fit. c, Representative single-cell traces of PKA response in a dSPN (top) and iSPN (bottom) elicited by different durations of enforced running. d, Running duration–PKA response relationship of dSPNs and iSPNs. n (neurons/mice) = 85/7 for dSPNs and 121/9 for iSPNs. e, Representative traces of PKA responses in a dSPN (top) and iSPN (bottom) elicited by a short duration (25s) of enforced running overlaid with the fits (black) for on- and off-phases. The entire FOV was integrated to achieve higher photon count and thereby signal-to-noise ratio, and the imaging rate was every 3 s. f & g, Comparison of the kinetic time constants of PKA responses between short-duration voluntary running and enforced running in dSPNs (f) and iSPNs (g). From left to right, n = 9, 10, 9, and 10 in panel f; and 10, 11, 10, and 11 in panel g. The voluntary running data are the same as those in Extended Data Fig. 4c. Two-tailed unpaired Student’s t-test, from left to right, p = 0.73, 0.87,0.15, and 0.52; dF = 17, 17, 19, and 19; t = 0.35, −0.17, 1.50, and −0.65. All error bars represent SEM and their centers represent the mean. n.s.: p > 0.05.
Extended Data Fig. 7.
Extended Data Fig. 7.. A2AR antagonist blocks running-induced PKA activity.
a & b, Collective changes of basal (a) and enforced running-induced PKA activity (b) in iSPNs in response to the indicated intraperitoneal injection of two A2A receptor antagonists, istradefylline (istra.) and SCH58261 (SCH). n (neurons/mice) = 63/8, and 49/4 for SCH58261. Two-tailed paired Student’s t-test, from left to right, p = 3.1×10⁻¹⁶, 2.6×10⁻¹¹, 1.2×10⁻¹⁰, and 6.9×10⁻¹²; dF = 62, 48, 62, and 48; t = −11.0, −8.6, −7.7, and −10.3. c, Representative traces of voluntary running-induced PKA response in an iSPN before and after intraperitoneal injection of istradefylline (istra, 2 mg/kg). d, Collective voluntary running-induced PKA activity in iSPNs before and after istradefylline administration. n (neurons/mice) = 46/4. Two-tailed paired Student’s t-test, p = 1.9×10⁻⁷; dF = 45; t = −6.2. e & f, Collective changes of basal (e) and enforced running-induced PKA activity (f) in dSPNs and iSPNs in response to the local infusion of saline (1 µL). n (neurons/mice) = 27/7 for dSPNs and 16/5 for iSPNs. Two-tailed paired Student’s t-test, dF = 26, and 15, t = −0.1 and −1.7 for panel e; dF = 26 and 15 t = −1.3 and 1.4 for panel f. All error bars represent SEM and their centers represent the mean. n.s.: p > 0.05; ***: p ≤ 0.001.
Extended Data Fig. 8.
Extended Data Fig. 8.. The effect of an A1R antagonist on dSPNs and iSPNs.
a & b, Collective changes of basal and enforced running-induced PKA activity, as indicated, in dSPNs (a) and iSPNs (b) in response to the intraperitoneal injection of the A1 receptor antagonist DPCPX (2 mg/kg). n (neurons/mice) = 55/5 for dSPNs and 118/6 for iSPNs. Two-tailed paired Student’s t-test, from left to right across panels, p = 8.4×10⁻¹¹, 0.0029, 3.9×10⁻⁴, and 0.42; dF = 54, 54, 117, and 117; t = −8.0, −3.1, −3.7, and 0.8. All error bars represent SEM and their centers represent the mean. n.s.: p > 0.05; **: p ≤ 0.01; ***: p ≤ 0.001.
Extended Data Fig. 9.
Extended Data Fig. 9.. Voluntary running-induced adenosine release.
a, Representative histology section of wildtype mice (n = 9) with an optical fiber implanted and GRABAdo1.0 expressed in neurons (under a synapsin promotor) of the dorsal lateral striatum. b, Example fiber photometric recording traces, aligned to an enforced running bout. c, Average voluntary running-elicited adenosine responses (top) and the corresponding running (bottom) aligned to movement initiations. n (bouts/mice) = 86/5 for GRABAdo1.0 and 34/2 for mutant. d, Average enforced running-induced adenosine release with (black) and without (green) intraperitoneal injection of istradefylline (istra, 2 mg/kg). n (bouts/mice) = 12/6 for both control and istradefylline. e, Collective results of the experiment in panel d. n = 6 mice. Two-tailed paired Student’s t-test, p = 8.6×10⁻⁴; dF = 5; t = 7.1. All error bands represent SEM and their centers represent the mean. ***: p ≤ 0.001.
Fig. 1.
Fig. 1.. In vivo PKA activity imaging reveals cell type-specific modulation of PKA by dopamine.
a, Schematic 2pFLIM imaging of in vivo PKA activity in the striatum via a GRIN lens. b & c, Representative images (b) and quantification (c) of basal PKA activity in dSPN or iSPN somata and its response to SKF83566 (SKF, D1R antagonist) and eticlopride (etic., D2R antagonist). n (neurons/mice) = 38/6 for dSPNs and 63/8 for iSPNs. Within the same SPN type, two-tailed paired Student’s t-test with Bonferroni correction, from left to right, p = 4.5×10⁻⁸ and 4.1×10⁻¹³; dF = 37 and 62; t = 7.3 and 9.5. For the same drug across SPN types, two-tailed unpaired Student’s t-test with Bonferroni correction, from left to right, p = 1.9×10⁻⁴ and 5.3×10⁻⁸; dF = 99 and 99; t = 4.3 and 6.2. All lifetime data are plotted on inverted y-axes. d, Schematic of the experiment in panel e and f. Channelrhodopsin ChR2 was expressed in SNc dopaminergic neurons. Their projection axons in the striatum (Str.) were photostimulated through the GRIN lens during PKA imaging. Stim.: photo stimulation. e & f, Representative images and their corresponding traces in awake mice (e), and collective peak responses in both awake and anesthetized mice (f) of PKA activity in dSPNs and iSPNs elicited by optogenetic dopamine release. From left to right, Δlifetime (ns) = −0.036 ± 0.006, −0.005 ± 0.004, −0.024 ± 0.004, and 0.002 ± 0.003; n (neurons/mice) = 41/5, 36/4, 35/4, and 32/4. Two-tailed unpaired Student’s t-test, from left to right, p = 1.5×10⁻⁴ and 2.6×10⁻⁶; dF = 75 and 65; t = −4.0 and −5.2. All error bars represent SEM and their centers represent the mean. ***: p ≤ 0.001.
Fig. 2.
Fig. 2.. Locomotion requires PKA activity and increases PKA activity in both dSPNs and iSPNs.
a, Schematic of the head-fixed locomotion experimental paradigm on a treadmill during 2pFLIM imaging. b, Wildtype mice with and without GRIN lens implantation exhibited comparable running adaptation across days. n (mice) = 8 for operated, and 10 for control. c, Representative running-speed traces (left) and the collective quantification (right) of wildtype mice voluntarily running on the treadmill with the indicated local drug infusion. The measurement window (gray zones), time of drug application (arrow), and zero velocity (red dashed lines) are indicated. Rp: Rp-8-Br-cAMPS. n (mice) = 7, 7, 7 from left to right. Two-tailed paired Student’s t-test on data normalized to the baseline, from left to right, p = 0.20, 3.1×10⁻⁷, 1.8×10⁻⁵; dF = 6, 6, 6; t = −1.4, 24.4, 12.3. d, Animal velocity on the treadmill across 8 days with PKI or its mutant (PKImut) expressed in dSPNs or iSPNs. n (mice) = 8 for both groups of dSPNs, 10 for PKImut in iSPNs, and 13 for PKI in iSPNs. Two-tailed unpaired Student’s t-test on day 8 for dSPNs and iSPNs, respectively, p = 0.0052 and 0.024; dF = 14 and 21; t = −3.3 and −2.4. e & f, Representative images (e) and example response traces (f) of voluntary running-elicited PKA activity responses in dSPNs and iSPNs. g, Averaged voluntary running-induced responses (top) from tAKARα (sensor) or its mutant (mut.) and corresponding running traces (bottom) aligned at movement onset from dSPNs and iSPNs. h, Collective peak amplitudes of voluntary running-elicited PKA responses. Δlifetime (ns) = −0.034 ± 0.002 for dSPNs and −0.042 ± 0.002 for iSPNs. Two-tailed Student’s t-test, p = 0.016; dF = 431; t = −2.4. For panels eh , n (neuronal bouts/bouts/mice) = 247/46/9, 192/29/4, 186/38/7, and 70/10/4 for dSPNs, dSPN mutant sensor, iSPNs, and iSPN mutant sensor, respectively. i, Fraction of dSPNs and iSPNs that exhibited above-threshold (3x S.D. of baseline) PKA response to voluntary running. n (mice) = 7 and 8 for dSPNs and iSPNs, respectively. Two-tailed Student’s t-test, p = 0.03; dF = 13; t = −2.4. j, The dependence of PKA responses on locomotion duration, in dSPNs (blue) and iSPNs (magenta). For the curve from left to right, n (neuronal bouts) = 54, 109, 55, 29 for dSPNs from 9 mice, and 44, 60, 43, 39 for iSPNs from 7 mice. All error bars and error bands represent SEM and their centers represent the mean. n.s.: p > 0.05; *: p ≤ 0.05; **: p ≤ 0.01; ***: p ≤ 0.001.
Fig. 3.
Fig. 3.. A2AR mediates PKA activity increases in iSPNs.
a & b, Representative images (a) and example traces (b) of PKA responses to enforced running in dSPNs and iSPNs. n (FOVs/mice) = 12/7 and 19/9, respectively. c, Raster plots (top) of PKA responses and their average (bottom) of dSPNs and iSPNs triggered by enforced running. The averaged traces from the mutant PKA sensor (mut.) are also shown. d, Collective peak amplitudes of 3-min enforced running-elicited PKA responses of dSPNs and iSPNs. Δlifetime (ns) = −0.058 ± 0.004 for dSPNs and −0.102 ± 0.005 for iSPNs. For panels c & d, n (neurons/mice) = 85/7 for dSPN and 124/9 for iSPN. Two-tailed Student’s t-test, p = 1.5×10⁻⁸; dF = 207; t = 5.9. e & f, Representative trace (e) and collective changes (f) of enforced locomotion-elicited PKA response in dSPNs and iSPNs before and after intraperitoneal injection of either SKF83566 (SKF) or eticlopride (etic.). n (neurons/mice) = 38/6 for dSPNs and 63/8 for iSPNs. Two-tailed paired Student’s t-test, from left to right, p = 2.4×10⁻⁶, 0.28, 0.82, 6.4×10⁻⁴; dF = 37, 37, 62, 62; t = −5.6, 1.1, 0.2, 3.6. g, Representative traces of enforced running-induced PKA response in iSPNs before and after intraperitoneal (IP) injection of istradefylline (istra), or local infusion of MSX-3. h & i, Collective changes of basal (h) and enforced running-induced PKA activity (i) in iSPNs or dSPNs elicited by the indicated local drug infusion. For both panels from left to right, n (neurons/mice) = 14/4, 18/6, and 32/5. Two-tailed paired Student’s t-test, from left to right, p = 0.0012, 1.6×10⁻⁶, 0.18, 4.9×10⁻⁵, 9.2×10⁻⁶, 0.0061; dF = 13, 17, 31, 13, 17, and 31; t = −4.1, −7.2, 1.4, −5.9, −6.3, and −2.9. All error bars and error bands represent SEM and their centers represent the mean. n.s.: p > 0.05; **: p ≤ 0.01; ***: p ≤ 0.001.
Fig. 4.
Fig. 4.. Locomotion results in acute adenosine accumulation.
a, Schematic of fiber photometric recording while mice run on a treadmill. b, Averaged response of GRABAdo1.0 (green) and its mutant (black) elicited by enforced running. n (bouts/mice) = 33/6 for GRABAdo1.0 and 20/5 for mutant. c, Example trace (inset) and correlation of adenosine responses to two consecutive enforced running trials. n = 7 mice. d, Running duration-adenosine response relationship. From left to right time points, n = 7, 7, 6, 7, and 6. e, Representative traces of enforced running-induced PKA responses in iSPNs before and after local infusion of APCP. f & g, Collective changes of basal (f) and enforced running-induced PKA activity (g) in iSPNs and dSPNs after local infusion of APCP. From left to right, n (neurons/mice) = 28/4 and 26/6 for both panels. Two-tailed paired Student’s t-test, from left to right, p = 0.025, 0.54, 0.021, 4.9×10⁻⁵; dF = 27, 25, 27, 25; t = −2.4, −0.6, 2.5, −4.9. h, Collective changes of the GRABAdo1.0 response to 5 min enforced running before and after local infusion of saline or APCP. n (mice) = 6 for both. Two-tailed paired Student’s t-test, from left to right, p = 0.65 and 0.041; dF = 5 and 5; t = −0.48 and 2.73. i & j, Example traces (i) and collective running velocity (j) before and after intraperitoneal injection of the indicated drugs. From left to right, n (mice) = 12, 14, 16, 16, and 12. Two-tailed paired Student’s t-test on data normalized to the respective basal values on the log scale, from left to right, p = 0.42, 0.0024, 0.0086, 0.0017, 0.74; dF = 11, 13, 15, 15, 11; t = −0.8, −3.8, 3.0, 3.8, 0.3. k & l, Representative traces (k) and collective calcium responses (l) elicited by 3-min enforced running in dSPNs and iSPNs. n (neurons/mice) = 179/7 for dSPNs and 258/6 for iSPNs. Two-tailed paired Student’s t-test, from left to right, p = 2.9×10⁻²⁴ and 7.8×10−39; dF = 178 and 257; t = −11.9 and −15.5. m, Collective enforced running-elicited calcium responses before and after intraperitoneal injection of indicated drugs in dSPNs and iSPNs. From left to right, n (mice/neurons) = 171/6, 179/7, 188/6, 258/6, 290/7, and 214/6. Two-tailed paired Student’s t-test, from left to right, p = 2.9×10⁻⁵, 1.5×10⁻²⁷, 0.16, 6.2×10⁻²², 3.2×10⁻⁹, 7.1×10⁻⁴; dF = 170, 178, 187, 257, 289, 213; t = −4.3, 13.0, −1.4, 10.6, 6.1, −3.4. All error bars and error bands represent SEM and their centers represent the mean. n.s.: p > 0.05; *: p ≤ 0.05; **: p ≤ 0.01; ***: p ≤ 0.001.

References

    1. Graybiel AM, Aosaki T, Flaherty AW & Kimura M. The basal ganglia and adaptive motor control. Science (80-. ). 265, (1994). - PubMed
    1. Mink JW. The basal ganglia: Focused selection and inhibition of competing motor programs. Prog. Neurobiol. 50, (1996). - PubMed
    1. Gerfen CR & Surmeier DJ. Modulation of striatal projection systems by dopamine. Annu. Rev. Neurosci. 34, (2011). - PMC - PubMed
    1. Klaus A, Alves Da Silva J & Costa RM. What, If, and When to Move: Basal Ganglia Circuits and Self-Paced Action Initiation. Annual Review of Neuroscience vol. 42 (2019). - PubMed
    1. Gerfen CR et al. D1 and D2 dopamine receptor-regulated gene expression of striatonigral and striatopallidal neurons. Science (80-. ). 250, (1990). - PubMed

Method References

    1. Pologruto TA, Sabatini BL & Svoboda K ScanImage: Flexible software for operating laser scanning microscopes. Biomed. Eng. Online (2003) doi:10.1186/1475-925X-2-13. - DOI - PMC - PubMed
    1. Levene MJ, Dombeck DA, Kasischke KA, Molloy RP & Webb WW. In Vivo Multiphoton Microscopy of Deep Brain Tissue. J. Neurophysiol. 91, (2004). - PubMed
    1. Jung JC, Mehta AD, Aksay E, Stepnoski R & Schnitzer MJ. In vivo mammalian brain imaging using one- and two-photon fluorescence microendoscopy. J. Neurophysiol. 92, (2004). - PMC - PubMed
    1. Melander JB et al. Distinct in vivo dynamics of excitatory synapses onto cortical pyramidal neurons and parvalbumin-positive interneurons. Cell Rep. 37, 109972 (2021). - PMC - PubMed
    1. Wu Z et al. A sensitive GRAB sensor for detecting extracellular ATP in vitro and in vivo. Neuron 110, (2022). - PubMed

References for Extended Data Figures

    1. Franklin KBJ & Paxinos G The Mouse Brain in Stereotaxic Coordinates (map). Academic Press; (2007).

Publication types