. 2022 Nov;611(7936):603-613.
doi: 10.1038/s41586-022-05402-9. Epub 2022 Nov 9.

Metastatic recurrence in colorectal cancer arises from residual EMP1+ cells

Affiliations

Metastatic recurrence in colorectal cancer arises from residual EMP1+ cells

Adrià Cañellas-Socias et al. Nature. 2022 Nov.

Abstract

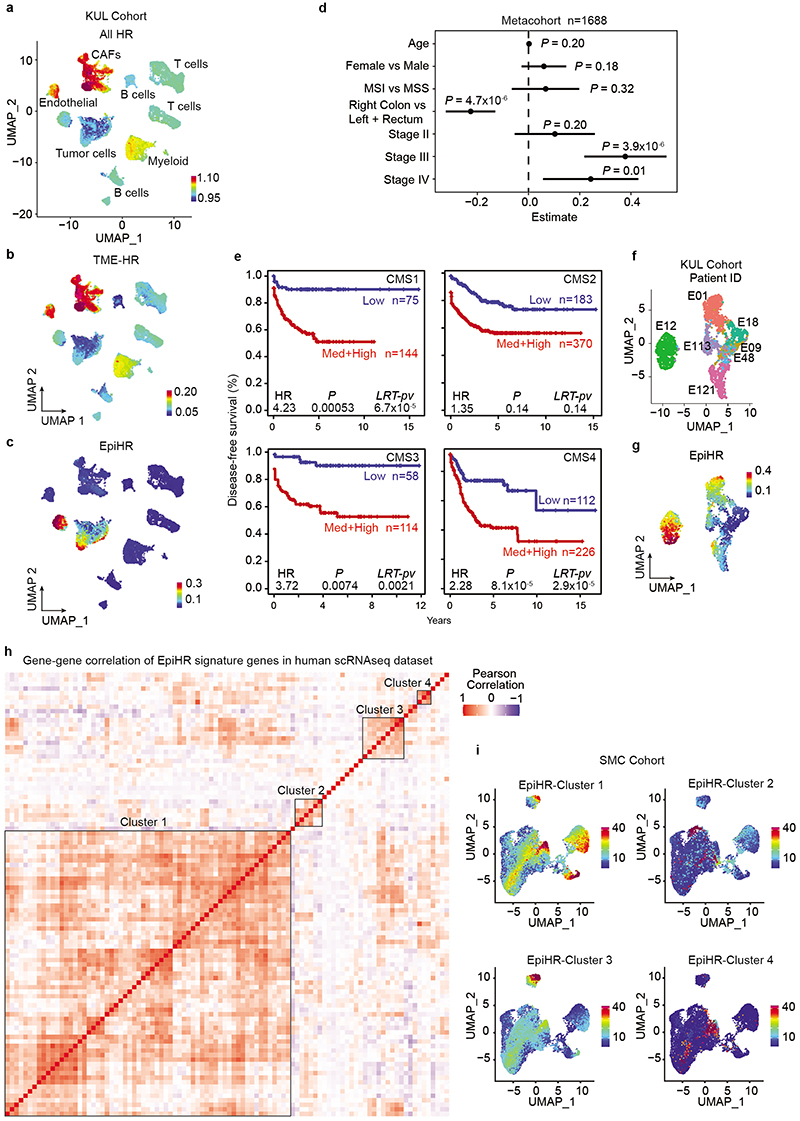
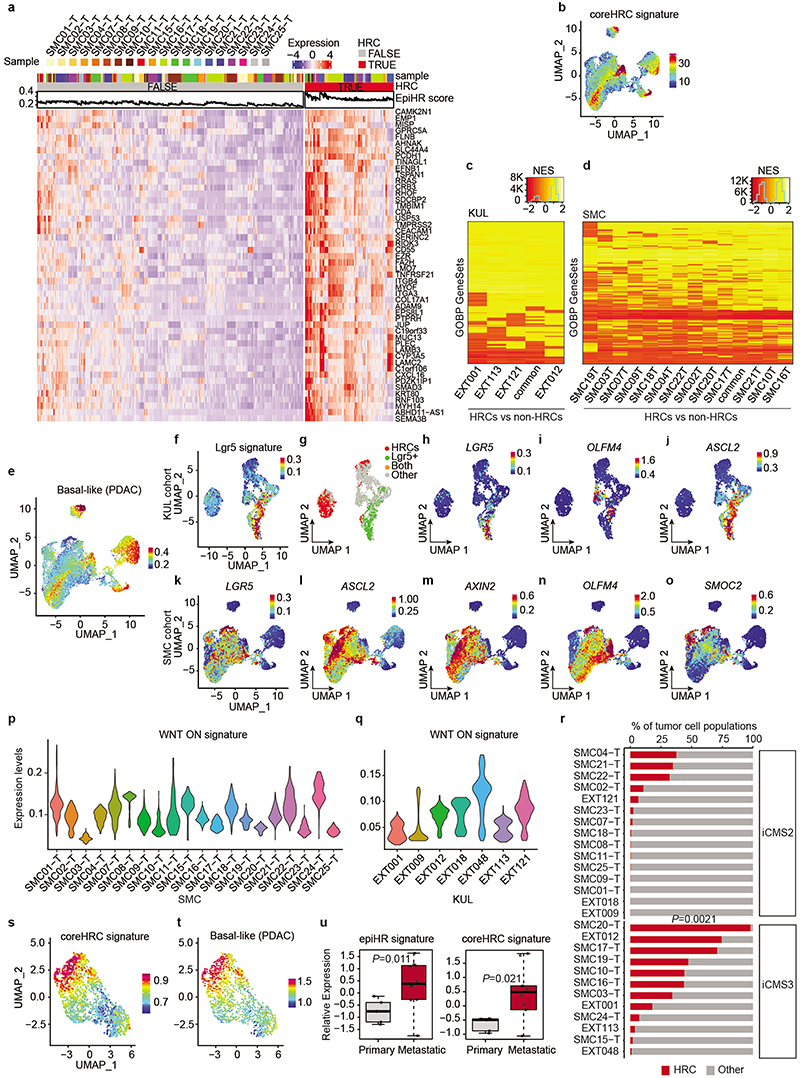
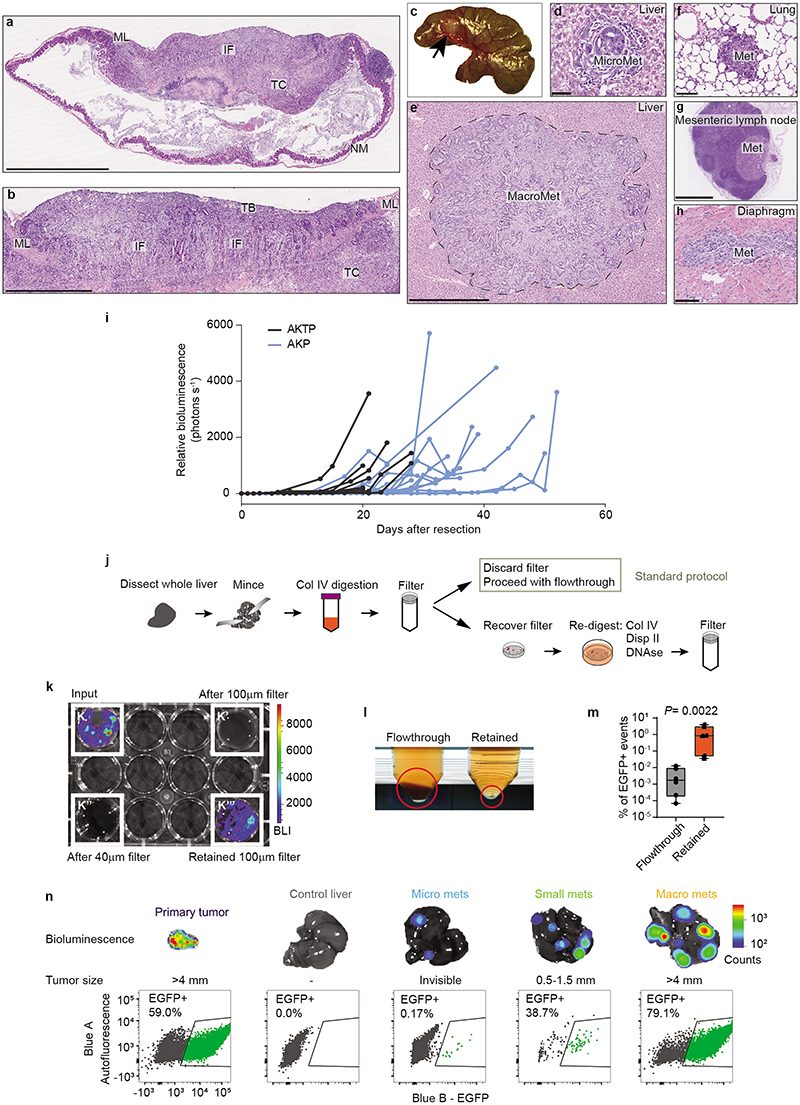
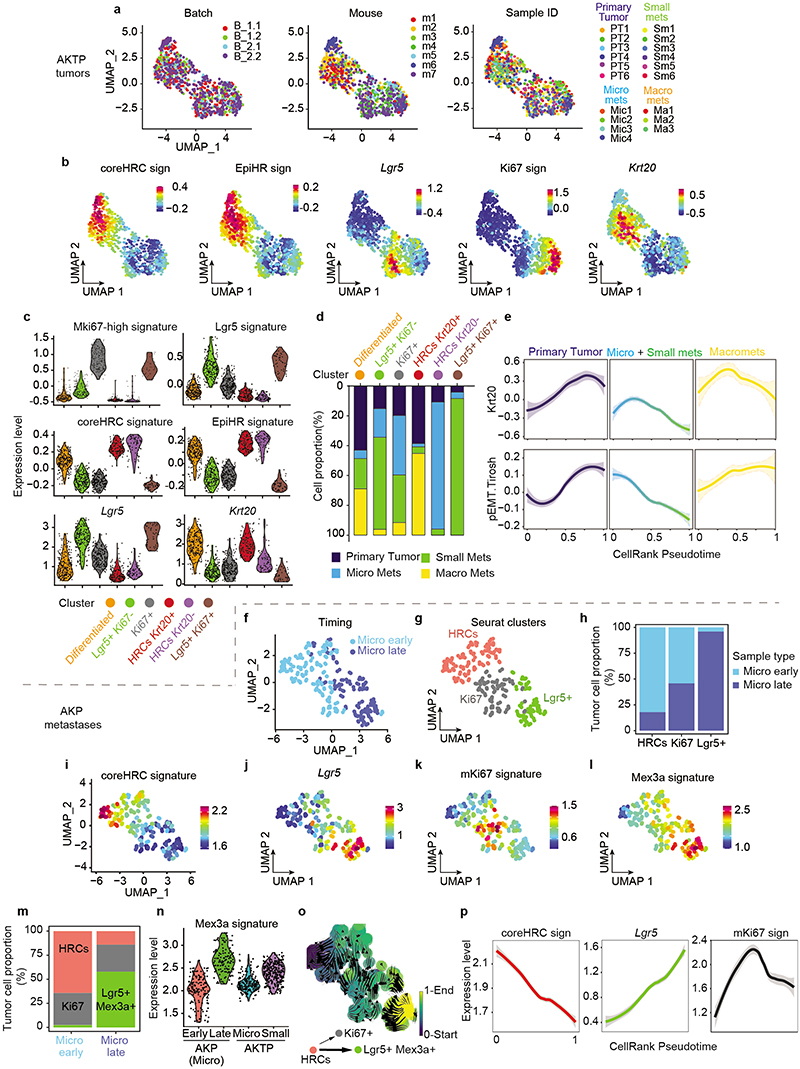
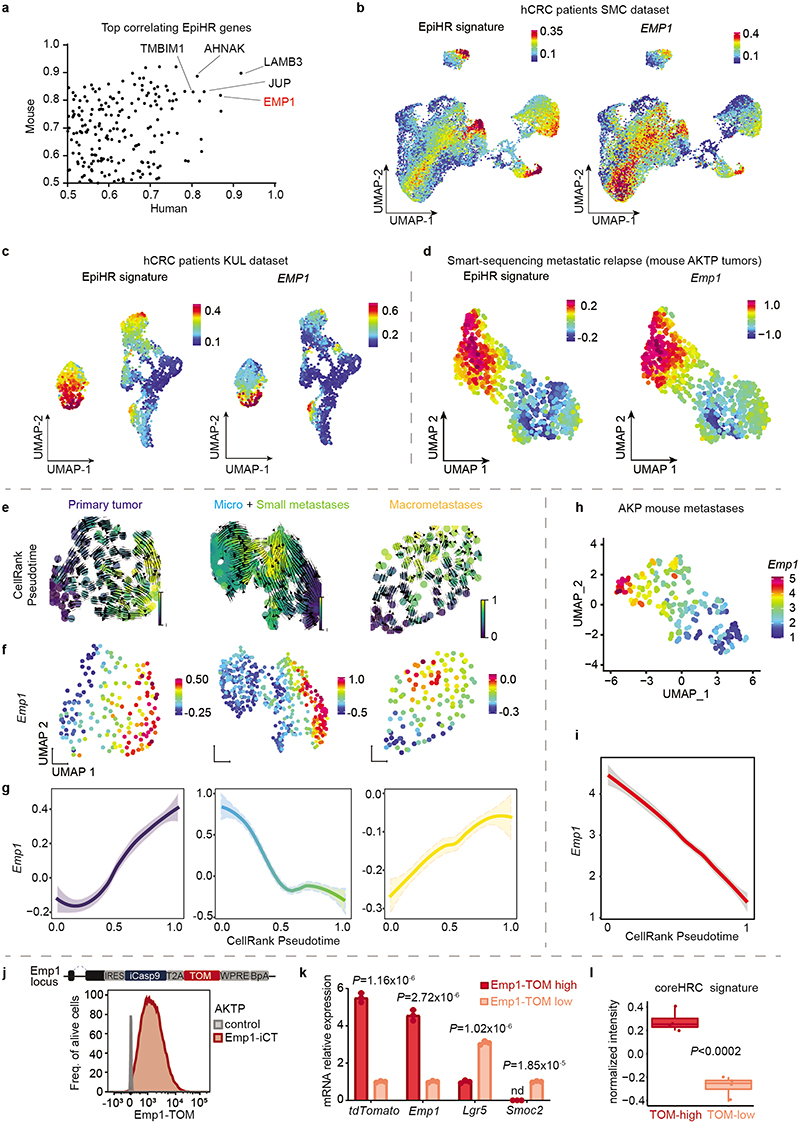
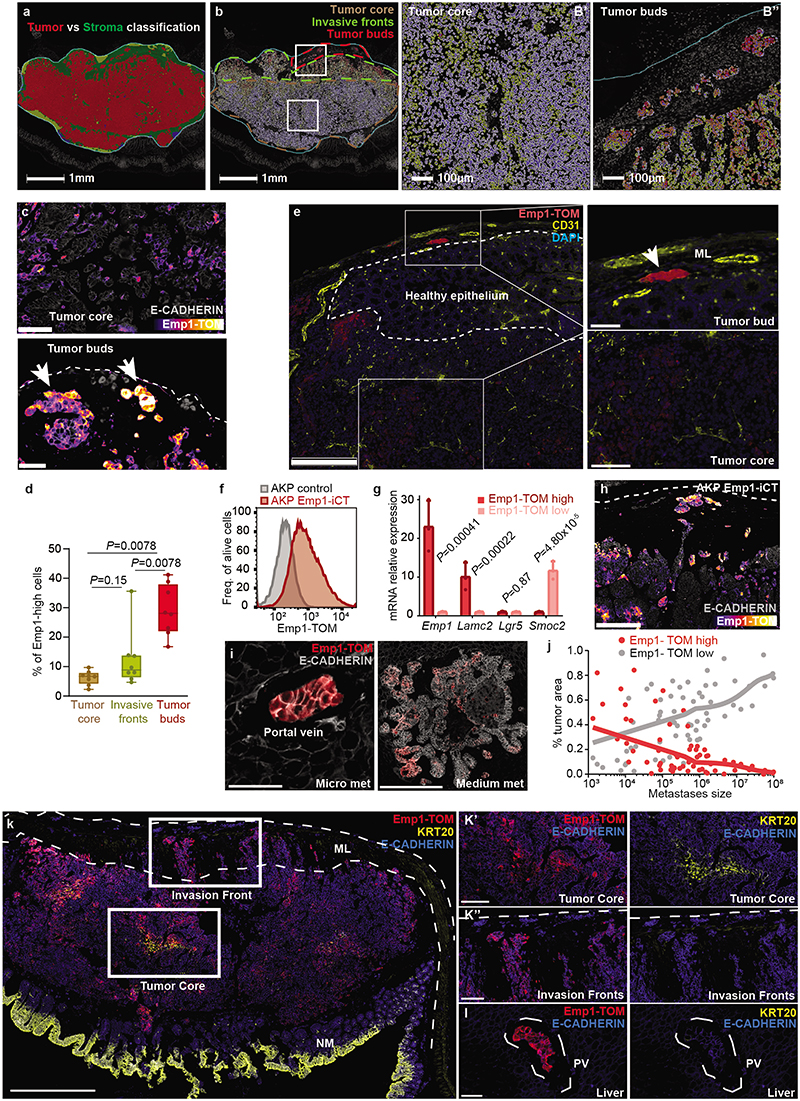
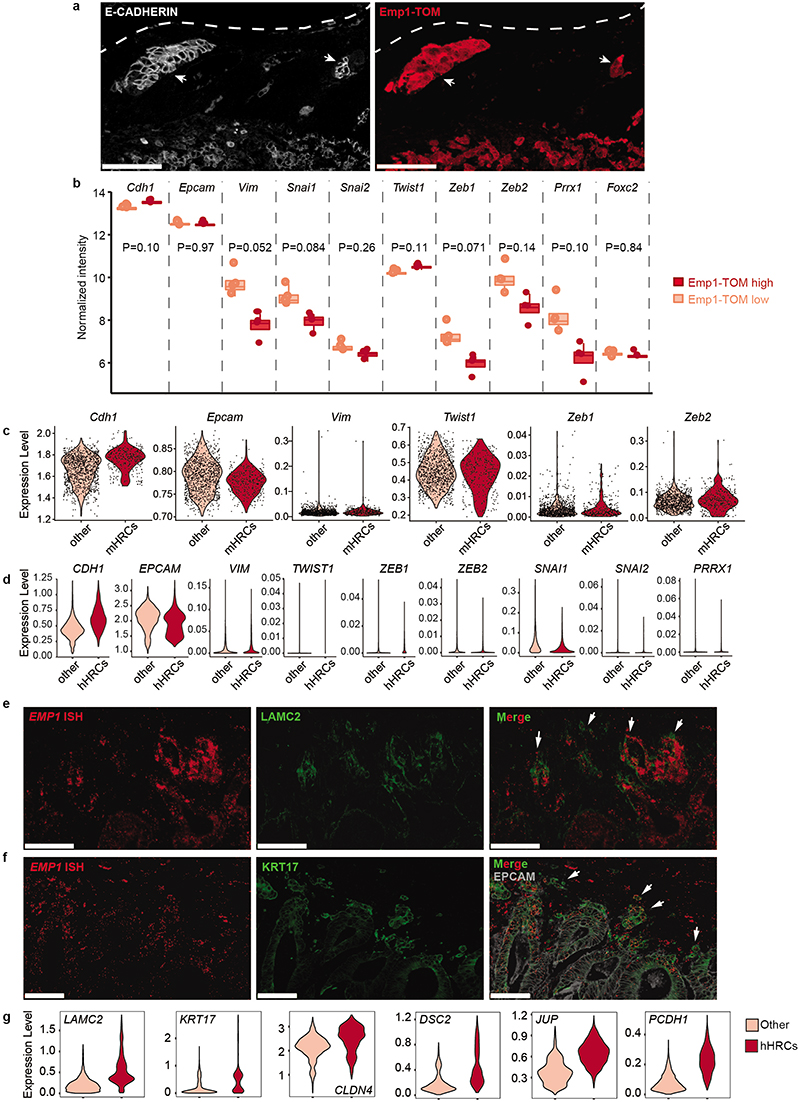
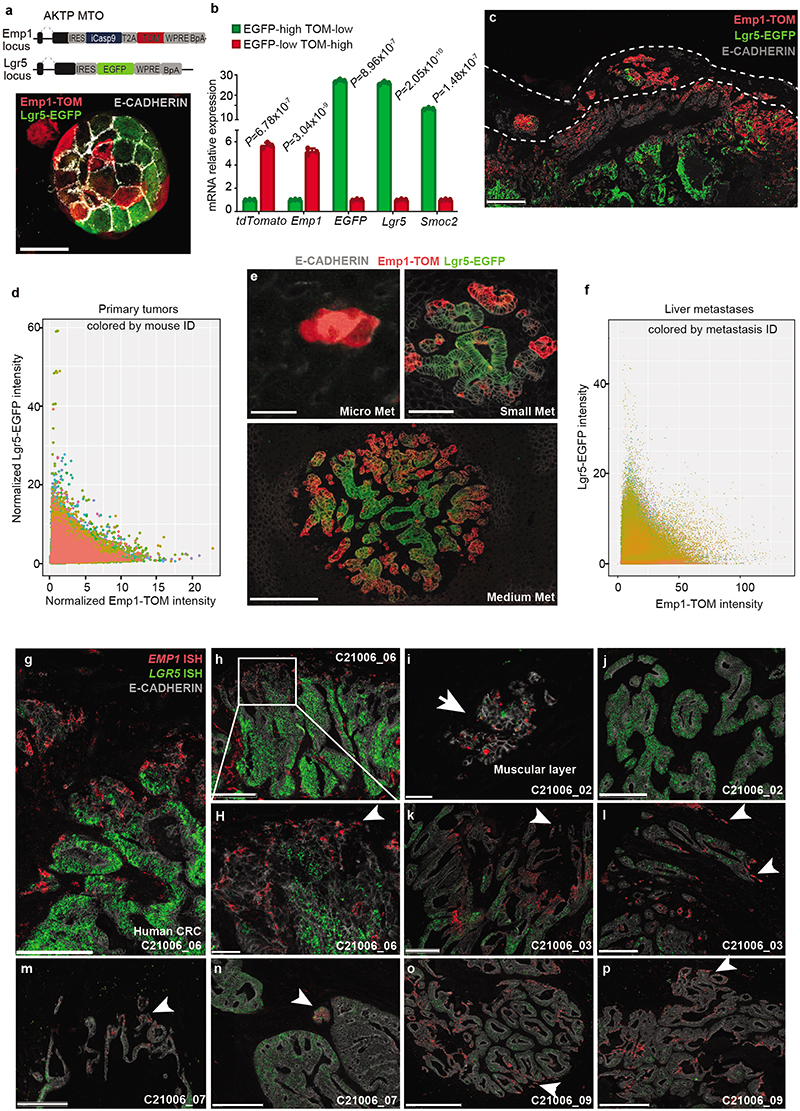
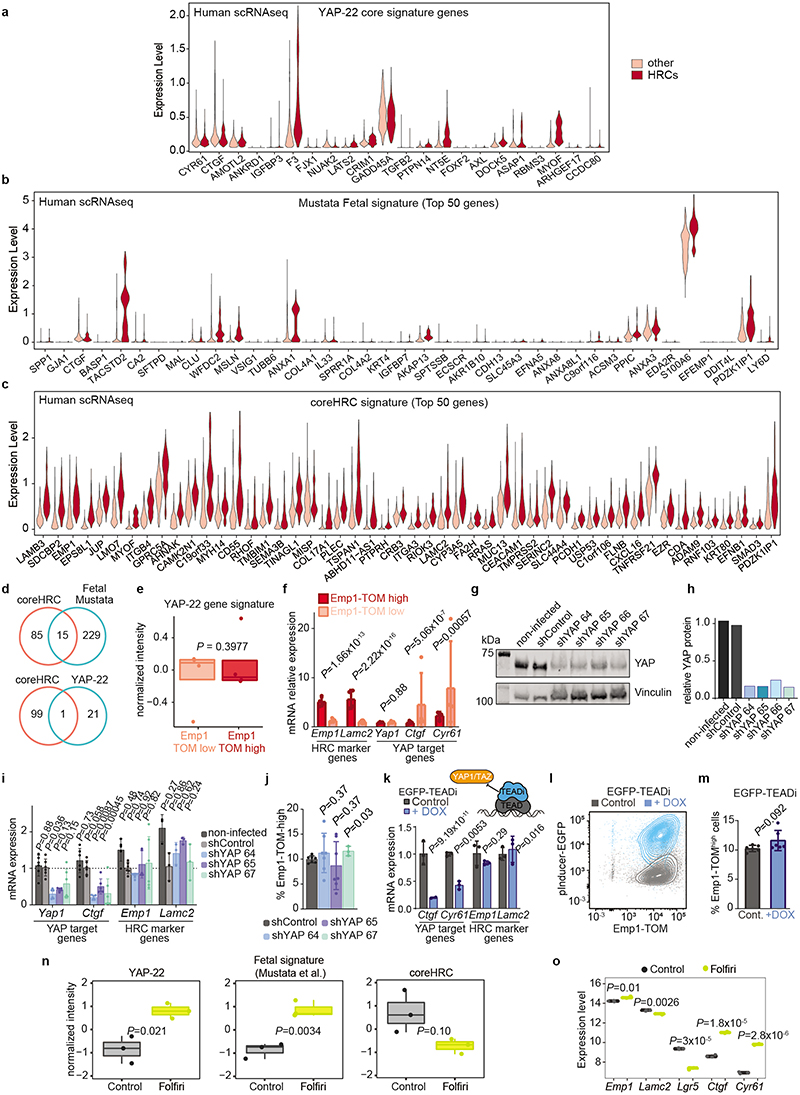
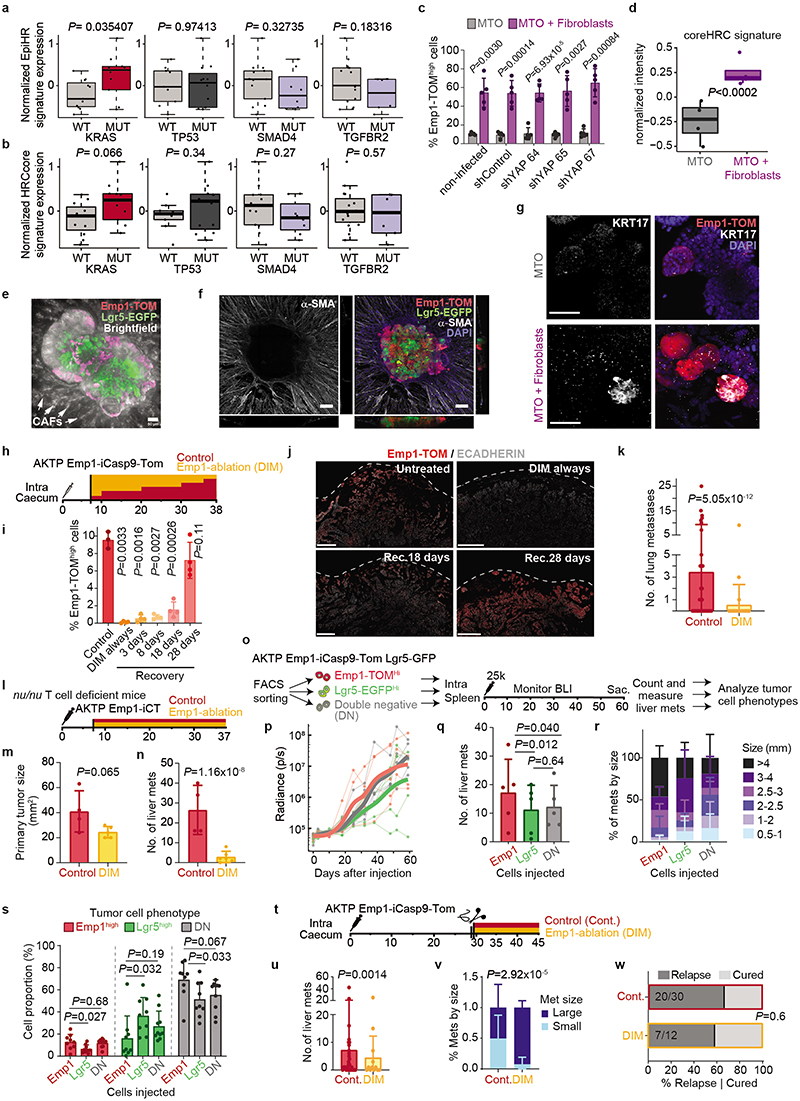
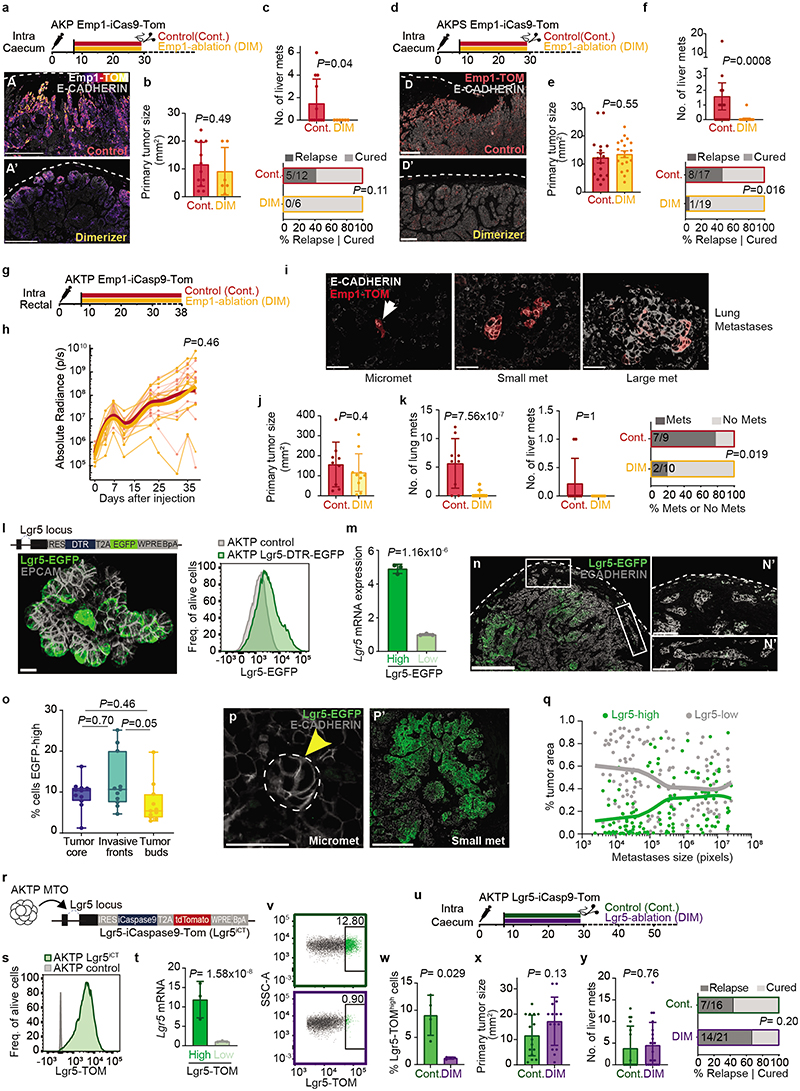
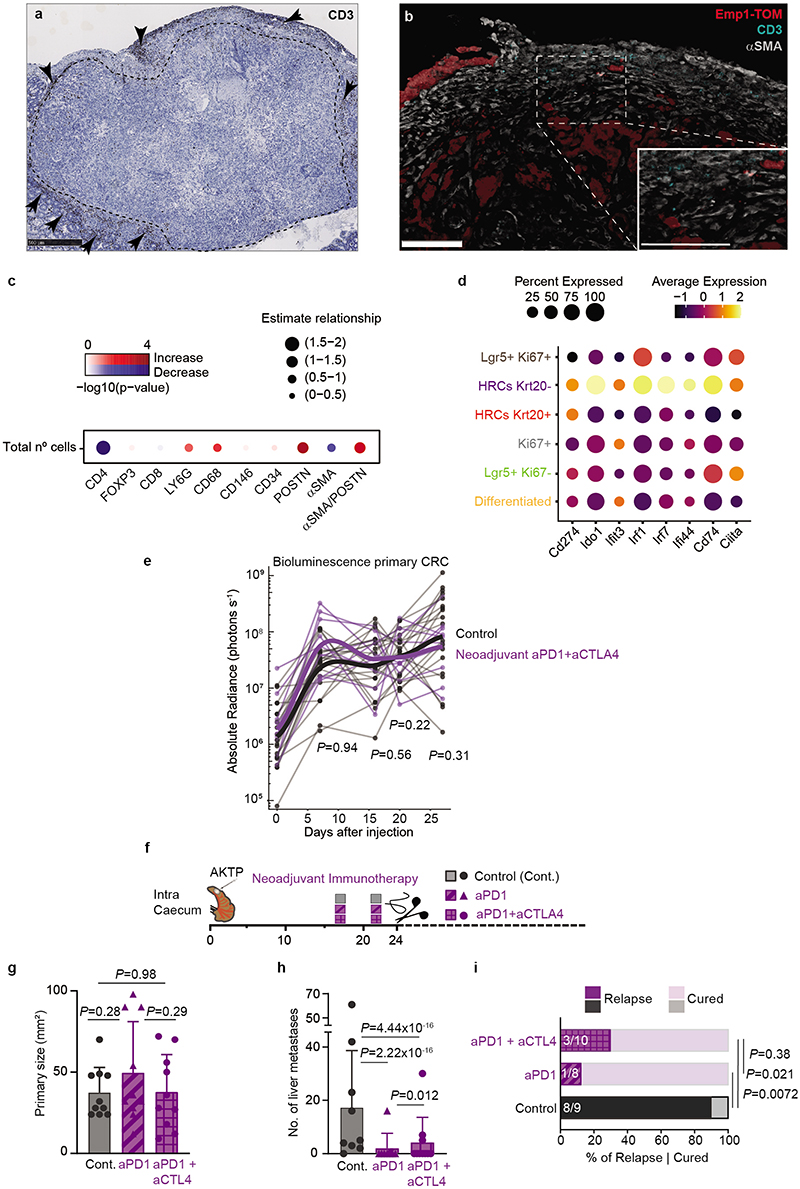
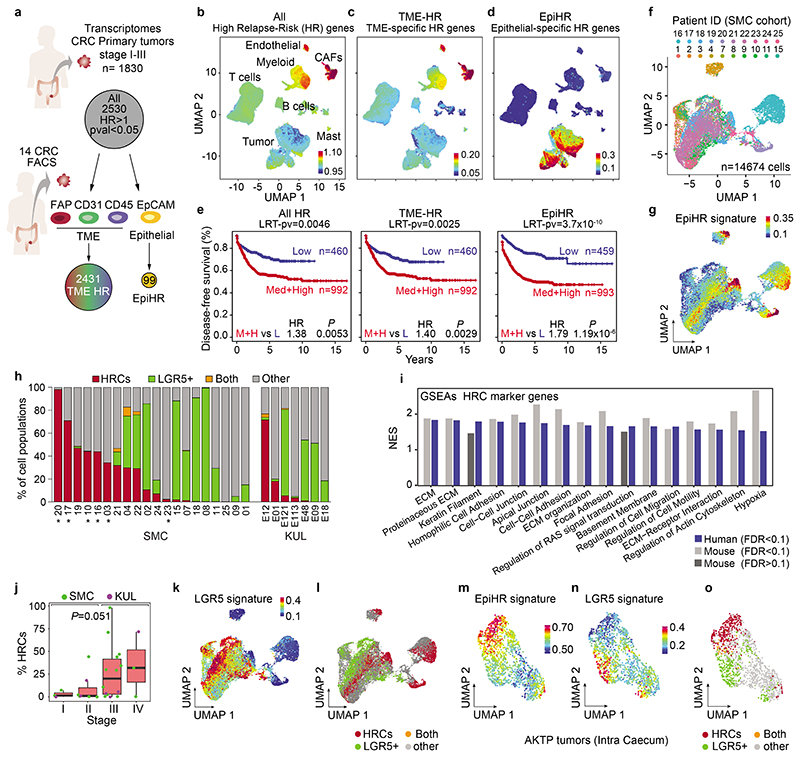
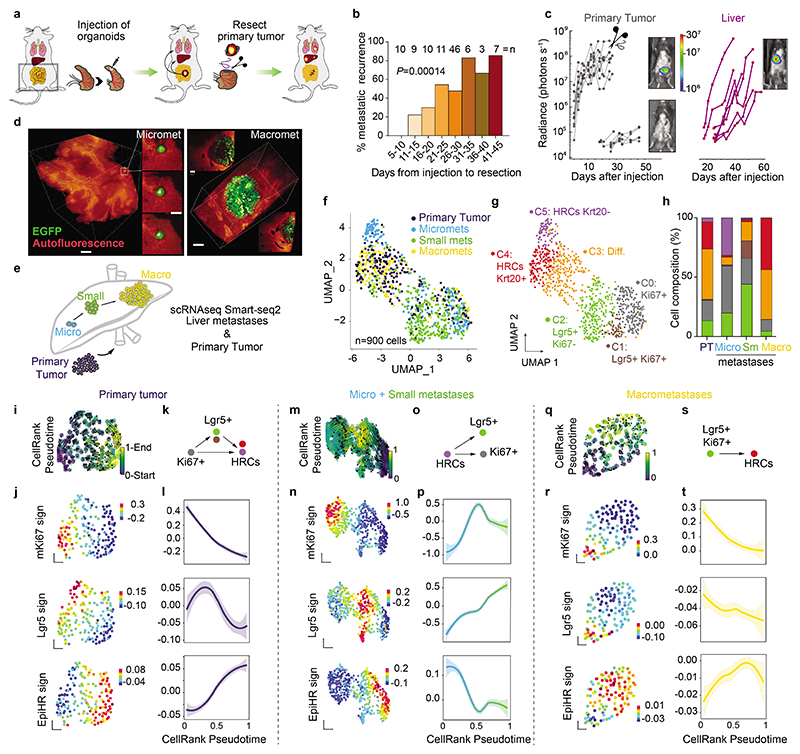
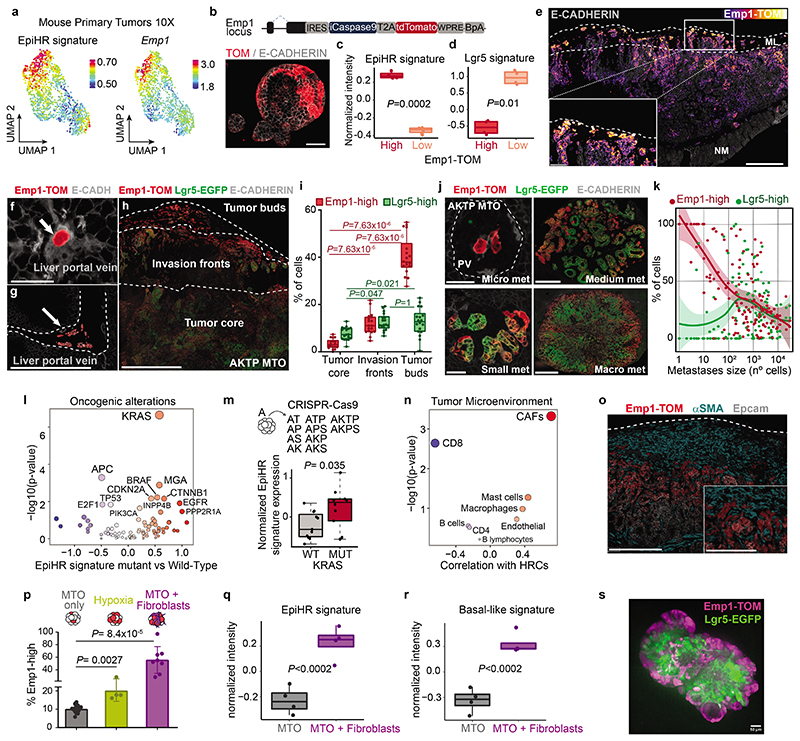
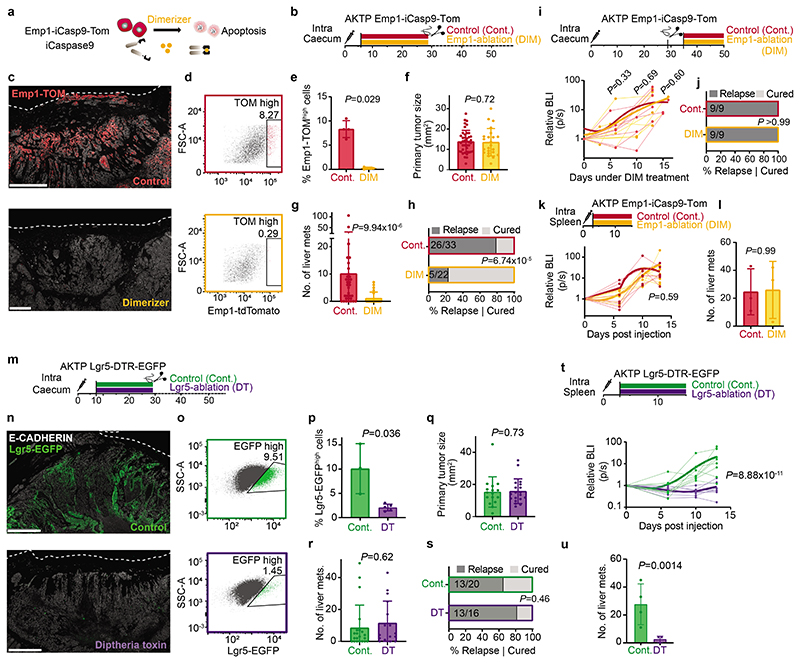
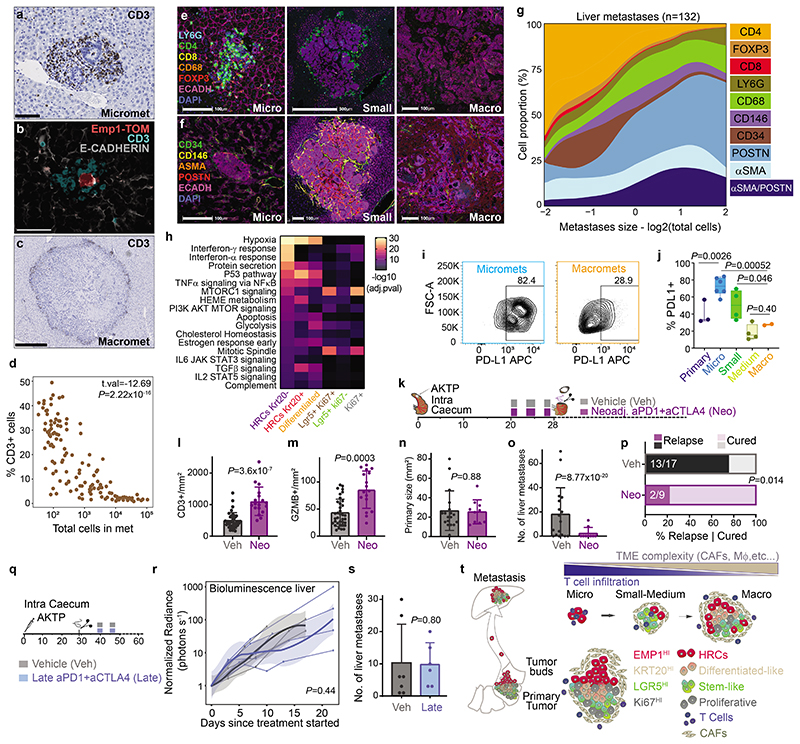
Around 30-40% of patients with colorectal cancer (CRC) undergoing curative resection of the primary tumour will develop metastases in the subsequent years1. Therapies to prevent disease relapse remain an unmet medical need. Here we uncover the identity and features of the residual tumour cells responsible for CRC relapse. An analysis of single-cell transcriptomes of samples from patients with CRC revealed that the majority of genes associated with a poor prognosis are expressed by a unique tumour cell population that we named high-relapse cells (HRCs). We established a human-like mouse model of microsatellite-stable CRC that undergoes metastatic relapse after surgical resection of the primary tumour. Residual HRCs occult in mouse livers after primary CRC surgery gave rise to multiple cell types over time, including LGR5+ stem-like tumour cells2-4, and caused overt metastatic disease. Using Emp1 (encoding epithelial membrane protein 1) as a marker gene for HRCs, we tracked and selectively eliminated this cell population. Genetic ablation of EMP1high cells prevented metastatic recurrence and mice remained disease-free after surgery. We also found that HRC-rich micrometastases were infiltrated with T cells, yet became progressively immune-excluded during outgrowth. Treatment with neoadjuvant immunotherapy eliminated residual metastatic cells and prevented mice from relapsing after surgery. Together, our findings reveal the cell-state dynamics of residual disease in CRC and anticipate that therapies targeting HRCs may help to avoid metastatic relapse.


Conflict of interest statement

Competing Interest

The authors declare no competing financial interests.

Figures

Extended Data Fig. 1 |
Extended Data Fig. 1 |. The EpiHR geneset marks a defined tumor cell population across CRCs.
a-c, UMAP layout of whole tumors (stroma + epithelium cells) from 7 CRC patients in the KUL dataset. Colored by (a) gene expression of all high hazard ratio genes (AllHR), (b) tumor microenvironment-specific HR genes (TME-HR), and (c) epithelial-specific HR genes (EpiHR). d, Association between clinical variables and the EpiHR signature in the CRC meta cohort was assessed by fitting a linear model for each variable independently. Technical factors (dataset and center, as described in extended methods) were included as covariates. Lines show the left and right confidence intervals. n= 1688 patients. e. Kaplan-Meier survival curves indicating relapse-free survival according to EpiHR gene signature expression for CRC patients classified by CMS. Two-sided Wald test. f-g, UMAP layout of 2718 CRC tumor cells from the KUL cohort colored by f) patient ID and g) expression of the EpiHR signature. h, Heatmap showing Pearson correlation scores in gene expression among EpiHR signature genes in patients from the SMC cohort. Note that most genes belong to one coherent subset (Cluster 1). Gene lists are detailed in Supplementary Table 2. i, UMAP layout of human CRC tumor cells colored by the expression of genes belonging to Clusters 1, 2, 3 and 4 identified in (h).
Extended Data Fig. 2 |
Extended Data Fig. 2 |. Characterization of HRC features.
a, Heatmap showing scaled expression of the top 50 most correlated genes with the EpiHR signature across SMC patients. Tumor cells are divided as non-HRCs (left, FALSE) and HRCs (right, TRUE). The EpiHR signature score for each individual cell is plotted above the heatmap. b, UMAP layout of CRC tumor cells colored by the expression of the coreHRC signature. The coreHRC signature is defined as the top 100 genes with better correlation with the EpiHR signature. c-d, Heatmap showing Normalized Enrichment Scores (NES) for Genesets in Gene Ontology Biological Processes (GOBP) in HRCs from different patients in the KUL (c) and SMC (d) cohorts. Only GOBP genesets with NES scores above 0.5 are shown. Genesets and patients are ordered by hierarchical clustering. e, UMAP layout of human CRC tumor cells in the SMC cohort painted with the Basal cell state signature in Pancreatic Ductal Adenocarcinoma (PDAC) by Raghavan et al. f, UMAP layout of tumor cells from the KUL cohort showing the expression of the Lgr5 signature. g, UMAP of same tumor cells labelled according to their classification into HRCs, Lgr5+, double positive or other cells. h-j, UMAP layout of same tumor cells showing gene expression levels of canonical intestinal stem cell genes LGR5, OLFM4 and ASCL2. k-o, UMAPs of tumor cells in the SMC dataset showing gene expression levels of canonical intestinal stem cell genes LGR5, ASCL2, AXIN2, OLFM4, and SMOC2. p,q, Violin plots showing WNT-ON signature expression levels in epithelial tumor cells from patients in the SMC (p) and KUL (q) cohorts. r, Barplot quantifying the HRC composition of each patient (combined SMC and KUL datasets). Patients are classified as iCMS2 or iCMS3 according to Joanito et al. Two-sided Kruskal-Wallis test. s,t, UMAPs of mouse CRC AKTP tumor cells colored according to (s) the coreHRC signature and (t) the Basal cell state signature in Pancreatic cancer by Raghavan et al. u, Gene expression levels of EpiHR (left) and coreHRC (right) signatures in MTOs derived from primary tumors or from liver metastases. Boxes represent the first, second (median) and third quartiles. Whiskers indicate maximum and minimum values. Welch two-sided t-test. n= 5 (primary) 10 (metastatic).
Extended Data Fig. 3 |
Extended Data Fig. 3 |. Analysis of the CRC relapse mouse models and purification of DTCs.
a, Representative micrograph of hematoxylin- and eosin (HE)-stained adenocarcinoma with subserosal invasion (T4) generated by injection of an AKTP MTO in the mouse caecum. Tumor center (TC), invasive fronts (IF), muscle layer (ML) and normal mucosa (NM) are indicated. Scale bar, 2.5 mm. b, Representative image of a different T4 tumor penetrating the muscle layer (ML) and reaching the serosa layer. TB: Tumor buds. Scale bar, 1mm. c, Picture of a caecum 21 days after injection and imaged at the time of surgery showing a primary tumor (arrow) in the distal part. d-e, Haematoxilin-Eosin (HE) staining of micrometastases and large metastases observed in the liver of orthotopic isografted mouse. Scale bars, 50 μm and 1 mm, respectively. In e, tumoral tissue is surrounded by dashed lines. f-h, HE staining of lung, lymph node and diaphragm metastases from orthotopic isografted mice. Scale bars, 100 μm (f and h) 1 mm (g). i, Graph showing liver longitudinal BLI measurements (photons per second), normalized to the day of primary tumor resection. Points and lines represent individual mice. n= 9 (AKTP), 24 (AKP) mice. j, Schematic representation of a novel tissue-dissociation strategy that enables recovery of DTCs from livers. Whole livers are dissected and minced thoroughly. After a mild collagenase IV digestion, samples are filtered through 100 μm meshes. The filter retained sample is highly enriched in tumor cells. Remaining tissue in the filter is re-digested with a stronger enzymatic cocktail to fully digest it, and then re-filtered. k, Representative bioluminescent image of a whole liver sample containing luciferase+ tumor cells before enzymatic digestion (B, input), after filtering through 100 μm (B’) and 40 μm (B”) meshes (previous protocol), and after recovering and redigesting tissue retained in the 100 μm filter (B”’). l, Image showing the large cell pellet containing liver cells after 1 mild digestion and the small pellet in the retained and re-digested sample enriched in DTCs. m, Percentage of GFP+ cells measured by flow cytometry in samples with 1 round of digestion compared to re-digested samples. Boxes represent the first, second (median) and third quartiles. Whiskers indicate maximum and minimum values. Paired two-sided Wilcoxon test on percentages. n=6 independent paired samples examined in 2 independent experiments. n, Representative bioluminescent images, tumor burden and flow-cytometry plots of the 4 different stages analyzed by single-cell Smart-sequencing described in Fig. 2. Micrometastases samples were DTCs collected from livers with absent or low bioluminescence in which metastases were not visible. For small metastases samples, metastatic nodules were visible but small in size (<1.5mm). Macrometastases samples were metastatic nodules larger than 4mm.
Extended Data Fig. 4 |
Extended Data Fig. 4 |. Additional description of residual AKTP and AKP metastatic cells.
a, UMAPs of colorectal primary tumors and liver metastases at different stages (micro, small and large) colored according to sequencing batch, mouse ID, and sample ID. b, UMAPs showing the expression levels of coreHRC, EpiHR, and mKi67 gene signatures and Lgr5 and Krt20 genes. c, Violin plots showing expression of relevant genes used to define the 6 different Seurat clusters. d, Fraction of cells (y axis) from each Seurat cluster (x axis) present in the different sample types: Primary Tumor, micro-, small- and macro- metastases according to the indicated color code. Note the “HRCs Krt20-” are mostly exclusive from micro metastases samples, whereas Lgr5+ cells are highly enriched in small metastases samples. e, Smoothed Krt20 gene and partial EMT gene signature expression trends fitted with Generalized Additive Models as a function of pseudotime in primary tumors, micro+small and large metastases. f,g, UMAP of AKP liver micrometastases colored according to timing of profiling and Seurat clusters. h, Barplot showing proportion of different Seurat tumor cell types captured in AKP early vs late micrometastases. i-l, UMAPs showing the expression levels of the coreHRC, mKi67 and Mex3a gene signatures and Lgr5 mRNA in AKP metastases. m, Barplot showing Seurat cluster distribution across AKP early and late micrometastases. n. Violin plots showing expression levels of the Mex3a signature in AKP early and late micrometastases versus AKTP micro and small metastases. o, Vector fields representing RNA velocity projected on UMAPs of AKP micrometastases. Colored by the pseudotime estimated for each cell with scVelo. p, Smoothed coreHRC, mKi67, and Lgr5 gene signature expression trends in the early and late AKP micrometastasis dataset fitted with Generalized Additive Models as a function of CellRank pseudotime.
Extended Data Fig. 5 |
Extended Data Fig. 5 |. Epithelial membrane protein 1 (EMP1) marks HRCs.
a, Scatter plot showing the correlation value between individual genes in the human SMC cohort (x axis) and in mouse primary tumors (y axis) with the EpiHR signature. Genes with correlation scores higher than 0.8 in both datasets are highlighted. b, UMAP of tumor cells from CRC patients in the SMC dataset colored according to the expression of EpiHR signature (left) and of EMP1 gene (right). c, As in b, for CRC tumor cells from the KUL datasets. d, UMAP representation of Smart-sequencing single cell data of AKTP mouse tumor cells along metastatic relapse sequence colored by the EpiHR signature (left) and Emp1 gene (right). e, Vector fields representing RNA velocity projected on AKTP primary CRC, micro+small and macro metastases UMAPs, colored by the pseudotime estimated for each cell with scVelo. f, AKTP tumor cell UMAPs colored by Emp1 gene expression. g, Smoothed Emp1 gene expression trends fitted with Generalized Additive Models as a function of pseudotime in AKTP primary tumor, micro+small and macro metastases samples. h, UMAP representation of AKP micrometastases colored by Emp1 gene expression. i, Smoothed Emp1 gene expression trends fitted with Generalized Additive Models as a function of pseudotime in AKP micrometastases samples. j, Representative flow cytometry plot of TOM expression in wild-type and Emp1-iCT AKTP MTOs. k, Relative mRNA expression in Emp1-TOMhigh and Emp1- TOMlow sorted cell populations from Emp1-iCT AKTP MTOs in vitro. Two-sided t-test after normalizing by Ppia. n=3 technical replicates. Mean +/- SD. l, Boxplot showing normalized intensity of coreHRC signature expression in Emp1-TOMhigh and Emp1-TOMlow cells dissociated from primary tumors 4 weeks post-implantation. Box plots have whiskers of maximum 1.5 times the interquartile range; boxes represent first, second (median) and third quartiles. n=4 mice per condition. ROAST-GSA adjusted p-values are shown.
Extended Data Fig. 6 |
Extended Data Fig. 6 |. HRCs are enriched in invasion fronts and micrometastases.
a, Primary tumor outlined by cyan line and colored in 4 different regions identified with HALO image analysis classifier (tumor-red, stroma-green, background-yellow, necrosis-blue). Scale bar, 1mm. b, TOM cell intensity analysis in the tumor area after segmentation into individual cells. B’ and B” show magnified regions corresponding to tumor core (B’) and invasion fronts + tumor buds (B”). Scale bars, 1mm (B), 100 μm (B’ and B”). c, Representative immunostaining of TOM and E-CADH in the tumor core and in tumor buds of primary tumors derived from Emp1-iCT MTOs 4 weeks post implantation in the caecum. TOM fluorescence is shown with mpl-inferno LUT. The dashed line delimits the caecum edge. Arrows point to tumor buds. Scale bars, 100 μm (tumor core) 50 μm (tumor buds). d, Quantification of Emp1-TOMhigh (defined as cells in percentile 90 for TOM expression) in the tumor core (submucosal area), invasion fronts (inside muscular layer) and isolated glands (over muscular layer). Boxes represent the first, second (median) and third quartiles. Whiskers indicate maximum and minimum values. Two-sided Wilcoxon test on percentages. n= 8 mice. e, Immunofluorescence of TOM, CD31 and DAPI in primary tumors. Amplified insets show the tumor core and invasive glands intermingled in mucosal layers (ML) next to blood vessels. Dashed lines outline healthy intestinal epithelium. Scale bars, 250 μm, 100 μm (tumor core) and 50 μm (tumor buds). f, Representative flow cytometry plot of TOM expression in wild-type and Emp1-iCT AKP MTOs. g, Relative mRNA expression in Emp1-TOMhigh and Emp1-TOMlow sorted cell populations from Emp1-iCT AKP MTOs. Two-sided t-test after normalizing by Ppia. n=3 technical replicates. Mean +/- SD. h, Representative immunostaining for TOM and E-CADHERIN in Emp1-iCT AKP tumors implanted in the caecum 4 weeks post-implantation. Emp1-TOM fluorescence is shown with an mpl-inferno LUT. Dashed lines delimit the edge of the caecum. Scale bar: 250 μm. i, Representative images of TOM and E-CADHERIN staining in micro (left) and medium (right) size metastases. Scale bars: 50 μm and 250 μm. j, Percentage of tumor area containing TOM-high and low fluorescent pixels versus metastases size (in pixels). Each dot represents an individual metastasis. k, TOM, KRT20 and E- CADHERIN staining in primary tumors generated by Emp1-iCasp9-tdTomato AKTP MTOs. Dashed lines encompass invasion fronts and tumor buds. KRT20 staining is observed in normal mucosa (NM) and to a lesser extent in the tumor core. Tumor cell clusters invading the muscular layer (ML) express high levels of TOM and no KRT20. Amplified insets show an example of tumor core (K’) and invasion fronts (K”) with TOM (left) and KRT20 (right) stainings. Scale bars, 500 μm (k) and 100 μm (K’ and K”). l, Immunofluorescence of TOM and E-CADHERIN (left) and KRT20 and E-CADHERIN (right) in a cluster of tumor cells that enter the liver through a portal vein (PV, delimited with dashed lines). Scale bar, 50 μm.
Extended Data Fig. 7 |
Extended Data Fig. 7 |. HRCs retain an epithelial phenotype.
a, Immunostaining of E-CADHERIN and TOM in Emp1-iCT primary tumors 4 weeks post-implantation of MTOs. Arrows point at examples of E-CADHERIN+ invasion fronts and tumor buds. Dashed lines show the caecum edge. Scale bars, 100 μm. b, Boxplot showing normalized expression of genes related to EMT in Emp1-TOMhigh versus Emp1- TOMlow cells. Box plots have whiskers of maximum 1.5 times the interquartile range; Boxes represent first, second (median) and third quartiles. P-value for differential expression with Linear Model for Microarray Analysis (limma). n=4 biological replicates. c-d, Violin plots showing expression of selected EMT-related genes in HRCs versus the rest of other cells in mouse epithelial primary tumor cells (c) and human tumor cells from the SMC cohort (d). Genes present in b not shown (Snai1 and Snai2) were undetected in (c). e, Representative example of EMP1 mRNA FISH combined with LAMC2 immunofluorescence on human primary CRC tissue section showing an overlapping pattern of expression of EMP1 and LAMC2 in invasion fronts and tumor buds (arrows). Scale bar, 100 μm. f, Representative example of EMP1 mRNA FISH combined with KRT17 and EPCAM immunofluorescence on human primary CRC tissue sections showing an overlapping pattern of expression of EMP1 and KRT17 in invading fronts and tumor cell clusters (arrows). Scale bars, 100 μm. g, Violin plots showing enrichment of LAMC2, KRT17 and several cell-to-cell adhesion genes in HRCs (SMC cohort).
Extended Data Fig. 8 |
Extended Data Fig. 8 |. Emp1 and Lgr5 mark distinct tumor cell populations.
a, Emp1-iCasp9-tdTomato and Lgr5-EGFP alleles introduced in AKTP MTOs. Confocal imaging of TOM, EGFP and E-CADHERIN immunostaining in edited MTOs. Single z-plane. Scale bar, 10 μm. b, Relative mRNA expression in EGFP-high/TOM-low and EGFP-low/TOM-high sorted cells dissociated from subcutaneous AKTP Emp1-iCT Lgr5-EGFP tumors. Two-sided t-test after normalizing by PPIA. Mean +/- SD. n= 3 technical replicates. c, Immunostaining of TOM, EGFP and E-CADHERIN in Emp1-iCT Lgr5-EGFP primary tumors 4 weeks post-implantation of MTOs in the caecum. Dashed lines encompass tumor buds. Scale bar, 250 μm. d, Scatter plot showing normalized Emp1-TOM intensity versus normalized Lgr5-EGFP intensity in 855,330 cells from 18 different primary tumors. Note the absence of double positive cells (TOM and EGFP high). e, Representative immunofluorescence staining of TOM, EGFP and E-CADHERIN in liver metastases of increasing size (micro, small, medium) generated from the mouse CRC relapse model. Scale bars, 25 μm (micro) 100 μm (small) 250 μm (medium). f, Scatter plot showing TOM intensity versus EGFP intensity in 318,276 cells from 137 different liver metastases. Note the absence of double positive cells (TOM and EGFP high). g-p, Examples of dual EMP1 and LGR5 mRNA ISH combined with E-CADHERIN immunofluorescence on human primary CRC tissue sections demonstrating a mutually exclusive pattern of expression of EMP1 and LGR5. Note that EMP1 expression is elevated in invasion fronts and tumor cell buds (white arrows). Scale bars, 500 μm (l, p) 250 μm (g, h, i, j, m, n, o) 50 μm (H’, k).
Extended Data Fig. 9 |
Extended Data Fig. 9 |. YAP/TAZ signaling is not required for HRC specification.
a-c, Violin plots comparing the expression of genes belonging to the YAP-22 core signature (a), the top 50 genes from the Fetal intestine progenitor signature (b) and the top 50 genes of the coreHRC signature (c) in HRCs vs other cells in the SMC scRNAseq cohort. d, Venn Diagram showing genes that overlap between the coreHRC signature and YAP-22 or Fetal intestine progenitor signatures. e. Boxplot showing normalized intensity of YAP-22 signature expression in Emp1-TOMhigh and Emp1-TOMlow cells dissociated from primary tumors 4 weeks post-implantation. Box plots have whiskers of maximum 1.5 times the interquartile range; boxes represent first, second (median) and third quartiles. n=4 mice per condition. ROAST-GSA adjusted p-values are shown. f. Relative mRNA expression measured by RT-qPCR in Emp1-TOMhigh and Emp1-TOMlow sorted cell populations from AKTP Emp1-iCT primary CRCs. Two-sided t-test after normalizing by PPIA. n=4 biological replicates. Mean +/- SD. g, Western blot for YAP and VINCULIN in non-infected, shControl and shYap infected AKTP organoids. h, Western blot quantification of YAP normalized by Vinculin. i, Relative mRNA expression (mean ± SD) in MTOs infected with shControl plasmid compared to uninfected MTOs and MTOs infected with three different shYAP plasmids. Analyzed with a mixed effects linear model after normalizing by PPIA housekeeping gene. n= 2 biological replicates with 3 technical replicates. j, Percentage (mean ± SD) of Emp1-TOMhigh cells in organoids infected with shControl or shYAP plasmids. Two-sided Wilcoxon t-test. n= 3 (sh67) 7 (all other) measurements examined over 4 independent experiments. k, Relative mRNA expression (mean ± SD) in MTOs infected with pInducer GFP-TEADi plasmid treated or untreated with doxycycline (DOX). GFP+ cells were sorted in DOX treated organoids, whereas alive cells were sorted in untreated MTOs. n= 3 technical replicates. Analyzed with a mixed effects linear model after normalizing by PPIA housekeeping gene. l, Representative flow cytometry plot showing Emp1-TOM fluorescence versus pInducer GFP-TEADi fluorescence in TEADi MTOs untreated or treated with DOX. m, Quantification (mean ± SD) of Emp1-TOMhigh in TEADi MTOs untreated or treated with DOX for 5 days. Two-sided Wilcoxon t-test. n= 2 biological replicates with 3 technical replicates. n, Boxplot showing expression levels (normalized intensity) of YAP-22, Fetal and coreHRC signature genes in control MTOs versus MTOs treated with chemotherapy (folfiri) for 4 days. Boxes represent the first, second (median) and third quartiles. Whiskers indicate maximum and minimum values. n=3 biological replicates per condition. Two-sided t-test. o, Boxplot showing the expression levels of relevant genes in control MTOs versus MTOs treated with chemotherapy (folfiri) for 4 days. Boxes represent the first, second (median) and third quartiles. Whiskers indicate maximum and minimum values. n=3 biological replicates per condition. Two-sided t-test.
Extended Data Fig. 10 |
Extended Data Fig. 10 |. KRAS mutations and CAFs specify the HRC population.
a-b, Normalized intensity of EpiHR and coreHRC signature expression in CTOs grouped by gain of function mutation in Kras g12d and loss of function mutations in p53, Smad4 and Tgfbr2. Box plots have whiskers of maximum and minimum values; boxes represent first, second (median) and third quartiles. n= 6 (WT) 5 (MUT) CTOs; 2 technical replicates. P-values for two-sided T-tests. c, Percentage of Emp1high tumor cells (defined as the top 10% of the TOM population in control MTOs, mean ± SD) in parental (non-infected), control shRNA or shRNAs targeting YAP1. n=5 biological replicates. P-value for two-sided t-test. d, Normalized intensity of the coreHRC signature expression in control MTOs versus MTOs co-cultured with colon fibroblasts. Box plots have whiskers of maximum 1.5 times the interquartile range; boxes represent first, second (median) and third quartiles. n= 4 biological replicates. ROAST-GSA adjusted p-value is shown. e, Representative images of MTOs Emp1-iCT Lgr5-EGFP co-cultured with colon fibroblasts. Maximum intensity projection of confocal stacks, step 4 μm, z stack 120 μm. Scale bar, 50 μm. f, Immunostaining of α-SMA Emp1-iCT Lgr5-EGFP MTOs co-cultured with colon fibroblasts for 2 days. Scale bars, 100 μm. g, Immunostaining of KRT17 in 4-days grown MTO Emp1-iCT organoids: fibroblast co-cultures and organoids alone control cultures. Scale bars, 50 μm. h, Ablation by dimerizer (DIM) treatment and surgery schedule of mice with AKTP Emp1-iCT primary tumors to assess the recovery of HRCs upon treatment cessation. i, Percentage (mean ± SD) of Emp1-TOMhigh cells (defined as top 10% in control animals) in untreated mice versus mice treated with DIM, with treatment discontinued at various timepoints post-injection. Two-sided T-test. n= 3 (control) 4 (rest) mice. j, Representative immunostainings showing effective Emp1-TOMhigh cell ablation in DIM-treated primary tumors and recovery upon treatment cessation. Dashed lines delimitate the caecum edge. Scale bars, 250 μm. k, Lung metastases (mean ± SD) generated by MTO Emp1-iCT up to one month after primary tumor resection, treated with vehicle or DIM as in Fig. 4a. Each dot is a mouse; n= 34 (control) 29 (DIM). P-value for generalized linear model with negative binomial family. l, Inducible ablation schedule of nude mice (nu/nu) implanted with AKTP Emp1-iCT primary tumors. Resection was not possible due to local spreading of tumors to neighboring tissue. m, Primary tumor area (mean ± SD) measured at sacrifice. Each dot is a mouse; n= 4 (control), 5 (DIM) mice. P-value for linear model. n, Liver metastases (mean ± SD) generated by MTO Emp1-iCT. Each dot is a mouse; n= 4 (control), 6 (DIM) mice. P-value for generalized linear model. o, Schematics of an experiment to analyze the potential of Emp1+, Lgr5+ or double negative (DN) cells to colonize the liver and generate metastases. 25,000 FACS-sorted Emp1-TOM-high, Lgr5-EGFP-high or double negative cells were injected intrasplenically. p, Metastatic growth measured by BLI. q, Liver metastases (mean ± SD) generated by Emp1-high, Lgr5-high or double negative cells. Each dot is a mouse; n= 5 mice. P-value for generalized linear model. r, Distribution of liver metastasis diameters (mean ± SD). n=5 mice per condition. s, Percentage (mean ± SD) of Emp1-TOMhigh, Lgr5-EGFPhigh and double negative tumor cells in metastases generated by the injection of Emp1-TOMhigh, Lgr5-EGFPhigh and double negative cells, n= 9 (Emp1 and Lgr5) and 10 (DN) mice. Two-sided t-test. t, Experimental setup showing inducible HRC ablation after surgery of primary AKPT CRCs. u, Liver metastases (mean ± SD) generated by MTO Emp1-iCT in mice treated with vehicle or DIM 1 day after primary tumor resection and until experimental endpoints. Each dot is a mouse; n=30 (control) 12 (DIM) mice P-value for generalized linear model. v, Percentage (mean ± SD) of small (diameter equal or smaller than 1 mm2) and big metastases (bigger than 1 mm2) in mice treated with vehicle or DIM 1 day after primary tumor resection and until experimental endpoints. Mixed effects linear model after boxcox transformation with mouse as random effect, n= 20 (control) and 7 (DIM) mice. w, Percentage of mice that developed liver metastases in control and Emp1-ablated mice. Analyzed with a generalized linear model.
Extended Data Fig. 11 |
Extended Data Fig. 11 |. Metastatic relapse in different mouse CRC models arises from HRCs.
a, Inducible ablation and surgery schedule of mice with AKP Emp1-iCT primary tumors. Panels A and A’ show immunostaining of TOM and E-CADHERIN demonstrating effective ablation of Emp1-high cells in primary CRCs. Dashed lines delimitate the caecum edge. Scale bars, 500 μm. b, Primary tumor area (mean ± SD) measured after resection. Each dot is a mouse, n= 12 (control) and 6 (DIM) mice. P-value for linear model after boxcox transformation. c, Liver metastases (mean ± SD) generated by MTO AKP Emp1-iCT up to one month after primary tumor resection. Each dot is a mouse, n= 12 (control) and 6 (DIM) mice. P-value for generalized linear model with negative binomial family. Bottom panel indicates the percentage of mice that developed liver metastases in the same experiment. Analyzed with a two-sided fisher test. d, Inducible ablation and surgery schedule of mice with AKPS Emp1-iCT primary tumors. Panels D and D’ show immunostaining of TOM demonstrating effective ablation of Emp1-TOMhigh cells in DIM-treated primary tumors. Dashed lines delimitate the caecum edge. Scale bars, 250 μm. e, Primary tumor area (mean ± SD) measured after resection. Each dot is a mouse, n= 17 (control) and 19 (DIM) mice. P-value for linear model after boxcox transformation. f, Liver metastases (mean ± SD) generated by MTO AKPS Emp1-iCT up to one month after primary tumor resection. Each dot is a mouse, n as in panel e. P-value for generalized linear model with negative binomial family. Bottom panel indicate the percentage of mice that developed liver metastases in the same experiment. Analyzed with a two-sided fisher test. g, Inducible ablation schedule of mice implanted with AKTP Emp1-iCT MTOs in the rectum. h, Longitudinal intravital BLI quantification of AKTP MTOs implanted in the rectum. i, Representative TOM and E-CADHERIN immunostainings of lungs from mice bearing AKTP rectal tumors. Lung metastases of increasing size are shown. Note that TOM expression is higher in micrometastases and progressively reduced. Scale bars, 50 μm. j, Primary rectal tumor area (mean ± SD) measured at sacrifice. Each dot is a mouse, n= 9 (control) and 10 (DIM) mice. P-value for linear model after boxcox transformation. k, Lung (left panel) and liver (middle panel) metastases (mean ± SD) generated by MTO Emp1-iCT injected in the rectum. Each dot is a mouse, n as in panel j. P-value for generalized linear model with Poisson family. Right panel shows the percentage of mice that developed metastases in the same experiment. Analyzed with a two-sided fisher test. l, CRISPR-Cas9 targeting strategy to introduce an DTR-GFP cassette into the Lgr5 locus of MTOs. Confocal imaging of immunostaining for EGFP and EPCAM in Lgr5-DTR-EGFP organoids. Scale bar, 30μm. Right panel shows a representative flow cytometry plot of EGFP expression in wild-type and Lgr5-EGFP organoids. m, Relative Lgr5 mRNA expression (mean ± SD) of Lgr5-EGFPhigh versus -low cells isolated from Lgr5-DTR-EGFP subcutaneous tumors. n=3 biological replicates. Two-sided t-test normalizing to B2M. n, Immunofluorescence showing EGFP and E-CADHERIN in primary tumors. Insets (N’ and N”) correspond to invasion fronts and tumor buds lacking EGFP expression at higher magnification. Scale bars, 500 μm (D) and 100 μm (D’ and D”). o, Quantification of Lgr5-EGFPhigh cells (defined as cells in percentile 90 for EGFP expression) in the tumor core, invasion fronts and tumor buds. Boxes represent the first, second (median) and third quartiles. Whiskers indicate maximum and minimum values. Paired two-sided Wilcoxon test on percentages. n= 11 mice. p, Representative images of Lgr5-EGFP staining in micro (P) and small (P’) metastases. Dashed lines and the yellow arrow surround a micrometastasis. Scale bars: (F) 50 μm; (F’) 250 μm. q, Percentage of tumor area containing Lgr5-EGFPhigh and Lgr5-EGFPlow cells versus metastases size. Each dot represents an individual metastasis. r, CRISPR-Cas9 targeting strategy to introduce an iCaspase-9-TOM cassette into the LGR5 locus of AKTP MTOs. s, Representative flow cytometry plot of TOM expression in Lgr5-iCasp9-tdTomato organoids. t, Quantification of Lgr5 mRNA (mean ± SD) by RT-qPCR in Lgr5-TOMhigh and Lgr5-TOMlow cells dissociated from primary tumors grown for 4 weeks. n=3 primary tumors. Analyzed with a mixed effects linear model. u, Timing of inducible ablation and surgery in mice implanted with AKTP Lgr5-iCasp9-TOM primary tumors. v, Representative flow cytometry plot of Lgr5-TOM fluorescence in controls versus dimerizer-treated mice. DAPI-/EPCAM+ cells are shown. w, Percentage (mean ± SD) of Lgr5high tumor cells (defined as the top 10% of the TOM+ population) in control and treated mice. n=4 mice each group. Two-sided Wilcoxon test. x, Primary tumor area measured after resection. n= 15 mice each group. Mean with SD, p-value of linear model after boxcox transformation. y, Liver metastases counted at experimental endpoints after primary tumor resection. n= 16 (control) and 21 (Lgr5-ablation) mice. Mean ± SD. Analyzed with a linear model with negative binomial family. Left panel show the percentage of mice that developed liver metastases in control and Lgr5-ablated tumors in the same experiment. Two-sided Fisher test.
Extended Data Fig. 12 |
Extended Data Fig. 12 |. Immune checkpoint immunotherapies prevent metastatic relapse.
a, Representative image of CD3+ cell distribution in primary AKTP CRC showing T cell exclusion. Arrows point to T cells located at the tumor periphery. b, Representative immunostaining of Emp1-TOM, CD3 and α-SMA in primary tumors. Scale bars, 100 μm. c, Dotplot summarizing regression models applied to multiplex immunofluorescence data. Effects of the total number of cells on the composition of every cell population are represented by different point sizes (defining the magnitude of the effect) and colors (showing both the sign of the effect in blue(-)/red(+) and the statistical significance by color intensity). d, Dotplot showing examples of interferon response genes across 6 tumor scRNAseq cell clusters as defined in Fig. 2g. e, Bioluminescence monitoring of the effect of the neoadjuvant immunotherapy regime used in Fig. 5k on primary tumor growth. Points and lines represent individual mice, trend lines (bold) show a LOESS model. n= 19 (control) 10 (PD1+CTLA4) mice. Mixed effects linear model with data normalized to time 0 and mouse as random effect. f, Schematics of an experiment comparing metastatic relapse in untreated mice and mice treated with neoadjuvant treatment with anti-PD1 monotherapy or anti-PD1+/anti-CTLA4 combined therapy. g, Primary tumor area (mean ± SD) measured after resection in the experiment described in f. Each dot is an individual mice. n= 10 mice each group. Linear model. h, Liver metastases (mean ± SD) generated by AKTP primary tumors up to one month after primary tumor resection in the experiment described in f. Each dot is an individual mice. n= 9 (control), 8 (PD1), 10 (PD1/CTLA4). Generalized linear model of Poisson family. i, Percentage of mice that developed liver metastases or remained metastases-free at experimental endpoints (4 weeks after resection) in control and immunotherapy-treated tumors. n= 9 (control), 8 (PD1), 10 (PD1/CTLA4). Generalized linear model with beta-binomial distribution.
Fig. 1 |
Fig. 1 |. Identification of poor prognosis epithelial CRC cells
a, Identification of TME-HR and EpiHR signatures in a metacohort of 7 pooled human stage I-III CRC datasets (n= 1830 patients, Supplementary Table 1). b-d, UMAP layout of whole tumors (stroma + epithelium cells) belonging to the SMC dataset, colored by AllHR (b), TME-HR (c) and epithelial-specific HR genes (d). e, Kaplan-Meier survival curves indicating relapse-free survival. Two-sided Wald test. Likelihood Ratio Test p-values (LRT-pv) are specified. f,g, UMAP layout of 14674 CRC tumor cells (SMC cohort) colored by patient ID (f) and expression of the EpiHR signature (g). h, Barplot quantifying the sub-population composition of each patient in the SMC (left) and KUL (right) datasets. Patient ID is detailed. Patients with low WNT signature scores are marked with an “*”. i, Selected Hallmarks, GOSLIM and KEGG gene signatures enriched in HRCs compared to the rest of tumor cells in human and mouse CRC samples. j, Boxplot representing the proportion of HRCs in each clinical stage. Box plots have whiskers of maximum 1.5 times the interquartile range. Boxes represent first, second (median) and third quartiles. n= 3, 7, 14, 3, patients from left to right. Two-sided Kruskal-Wallis test. k, UMAP of tumor cells colored by expression of the LGR5 signature. l, UMAP of tumor cells labelled according to their classification as HRCs, LGR5+, double positive or other cells. m-o, Primary tumors were generated in the caecum of c57BL/6J mice by injecting syngeneic AKTP MTOs. UMAPs depicting GFP+ tumor cells dissociated from primary tumors colored by expression levels of (m) EpiHR signature, (n) Lgr5 signature and (o) their classification as HRCs, Lgr5+, double positive or other cells.
Fig. 2 |
Fig. 2 |. Spatiotemporal dynamics of CRC metastases resolved by scRNAseq
a, Schematic representation of the mouse model of CRC metastatic relapse developed herein. b, Percentage of metastatic recurrence depending on time to primary tumor resection. Number of mice are detailed above the barplot. P-value for generalized linear model. c, Intravital bioluminescence imaging (BLI) quantification (photons s-1) of a representative experiment. Grey points and lines represent bioluminescence in the lower thorax of individual mice and purple points in the liver. Representative images of bioluminescence in the same mouse before, after surgery and upon liver metastases formation are shown. d, Representative images of whole livers containing GFP-expressing tumor cells obtained using lightsheet microscopy. Scale bars, left image (300 μm on Maximum Intensity Projections (MIP, and selected single plane insets 50 μm); right (100 μm on MIP and single plane insets 50 μm). e, Illustration of the longitudinal single cell RNA-expression analysis of tumor cells along the metastatic cascade. f, g, UMAP layout of 900 tumor cells isolated from 7 different mice colored by (f) metastatic stage and (g) Seurat clusters. h, Barplot showing Seurat cluster composition by sample stage. i, m, q, Vector fields representing RNA velocity projected on UMAPs of primary tumors (i), micro + small metastases (m) and macrometastases (q). Colored by the pseudotime estimated for each cell with scVelo. j, n, r, UMAPs with cells separated in primary tumors (j), micro+small metastases (n) and macrometastases (r) and colored by gene expression of mKi67, Lgr5 and EpiHR gene signatures. k, o, s, Schematics showing distinct hierarchical behavior during the different stages of metastasis formation. l, p, t, Smoothed mKi67, Lgr5 and EpiHR gene signature expression trends fitted with Generalized Additive Models as a function of pseudotime in primary tumors (l), micro+small (p) and large metastases (t).
Fig. 3 |
Fig. 3 |. Emp1 marks cells enriched in invasion fronts and micrometastases.
a, UMAP depicting EpiHR and Emp1 levels. b, TOM and E-CADH immunostaining in Emp1-iCasp9-tdTomato AKTP MTOs. Scale bar, 50 μm. c-d, Expression (normalized intensity) of EpiHR (c) and Lgr5 (d) signatures in Emp1-high and Emp1-low cells 4 weeks post-implantation. n=4 mice per condition. ROAST-GSA adjusted p-values. e-h, Representative images of Emp1-TOM+ and/or Lgr5-GFP+ cells in primary CRCs (e,h) and liver metastases (f,g). Dashed lines in panels e,h encompass tumor buds and invasion fronts or label the portal vein in g. NM: Normal Mucosa; ML: Muscle Layer. Scale bars, 500 μm (e,g, h); 100 μm (e, inset); 50 μm (f). i, Percentage of Lgr5-GFPhigh and Emp1-TOMhigh cells in different CRC regions. Whiskers are maximum and minimum values; n= 855,330 cells from 18 mice. Two-sided Paired Wilcoxon test. j, Examples of liver metastases of increasing size. Scale bars, 50 μm (micro and small), 250 μm (medium), 500 μm (macro). k, Percentage of Emp1-TOMhigh and Lgr5-GFPhigh cells per metastasis size. n= 318276 cells from 137 liver metastases from 17 different mice. LOESS model with a 95% confidence interval. l, EpiHR levels versus driver mutations. Difference of medians (x axis) versus p-value of Wilcoxon test (y axis) are shown. m, Normalized intensity of EpiHR signature expression in CTOs of different genotypes. n= 6 (WT) and 5 (Kras G12D) CTOs; 2 technical replicates per genotype. P-value for two-sided T-test. n, Association between HRC frequency and TME cell populations in SMC patients. Pearson correlation coefficients and p-values are shown. o, Representative patterns of TOM, α-SMA and EPCAM in primary CRCs. Dashed lines delimit the caecum. Scale bar: 250 μm; 125 μm (inset). p, Percentage of Emp1-TOMhigh cells (mean ± SD) in the indicated conditions; n=17 (control), 4 (hypoxia) and 8 (fibroblast co-culture). Two-sided Wilcoxon test. q-r, Expression (normalized intensity) of EpiHR or basal-like signatures. n=4 biological replicates. ROAST-GSA adjusted p-values. s, Representative confocal images of AKTP MTOs co-cultured with colon fibroblasts. Scale bar, 50 μm. Boxes in panels c, d, i, m, q and r indicate first, second (median) and third quartiles. Whiskers in panels m,q and r indicate maximum of 1.5 times the interquartile range.
Fig. 4 |
Fig. 4 |. Emp1-high cells are the origin of metastatic relapse.
a, Emp1-iCaspase9-mediated cell ablation. b, Experimental timeline detailing inducible Emp1+cell ablation and surgery. c, Emp1-TOM+ cells in primary tumors after ablation. Lines mark the caecum borders. Scale bars, 500 μm (C), 250 μm (C’). d, Representative flow cytometry plot of TOM fluorescence in EPCAM+ cells. e, Percentage of Emp1-TOMhigh tumor cells (mean ± SD) at the time of surgery. Every dot is a mouse, n=4 in both groups. Two-sided Wilcoxon test. f, Primary tumor area (mean ± SD) after resection. Each dot is a mouse, n= 33 (control) and 22 (DIM) mice. P-value for linear model after boxcox transformation. g, Liver metastases (mean ± SD) at experimental endpoints. Each dot is a mouse, n as in panel f. h, Percentage of mice that relapse with liver metastases. Two-sided fisher test. i, Experimental timeline detailing late ablation of Emp1+ cells and metastatic growth by BLI monitoring. n=9 mice per each group. j, Percentage of mice that relapse with liver metastases. Two-sided fisher test. k, Metastatic growth by BLI monitoring upon ablation of Emp1 cells 3 days after intrasplenic inoculation of Emp1-iCasp9-Tom organoids, n= 3 mice per each group. l, Number of liver metastases in k. Mean ± SD. n= 3 mice per group. m, Experimental timeline. n, Representative stainings of Lgr5-DTR-EGFP+ cells in primary CRCs. Dashed lines outline the serosa. Scale bars, 100 μm. o, Representative flow cytometry plot of Lgr5-EGFP fluorescence. p, Percentage of Lgr5-GFPhigh tumor cells (mean ± SD). n=3 (Cont.) and 5 (DT) mice respectively. P-value for generalized linear model. q, Primary tumor area (mean ± SD) measured after resection. n=20 mice in control and 16 in DT. Two-sided Wilcoxon test. r, Liver metastases (mean ± SD) at experimental endpoints. Each dot is a mouse, n as in (r). s, Percentage of mice that relapse with liver metastases. Two-sided fisher test. t, Liver metastasis growth monitored by BLI after intrasplenic inoculation of MTOs. u, Number of liver metastases (Mean ± SD) in (t). n=7 mice in control and n=8 in DT treated in (t,u). Points and lines of BLI measurements in panels i, k and t, represent individual mice, trend lines (bold) show a LOESS model and P-values were calculated with mixed effects linear model. P-values comparing in panels g, r, l and u were calculated using generalized linear model.
Fig. 5 |
Fig. 5 |. Neoadjuvant immunotherapy prevents metastatic relapse in CRC.
a-c, Representative images of T cell distribution (CD3+) in liver micrometastasis (a,b) and macrometastases (c) present in the AKTP CRC relapse model. Scale bars, 100 μm (a), 50 μm (b) and 500 μm (c). d, Percentage of CD3+ T Cells (referred to total TME cells) versus metastases size. n=12 mice, 133 metastases. Linear model with mouse as fixed effect. e-f, Representative examples of multiplex immunofluorescence of immune (e) and stromal (f) markers in metastases. Scale bars, 100 μm (micro and macro), 500 μm (small). g, Proportional stacked area graph showing TME cell types in metastasis of different sizes; n= 132 metastasis of 20 mice. h, Heatmap showing Hallmark GSEA in cell populations described in Fig. 2g. i, Representative flow cytometry contour plot showing PD-L1 expression in tumor cells of micro- and macro-metastases. j, Percentage of PD-L1+ tumor cells by flow cytometry. Whiskers encompass the smallest and largest value. Boxes represent first, second (median) and third quartiles. n= 3 (primary), 6 (micro), 4 (small and medium), 2 (macro). Wilcoxon t-test. k, Experimental timeline for neoadjuvant immunotherapy treatment. l-m, CD3+ (l) and GZMB+ (m) cell densities in primary CRCs (means ± SD); n= 19 (control), 10 (neoadjuvant). Mixed effects linear model. n, Primary CRC area (mean ± SD) after resection. Each dot is a mouse; n= 18 (control), 10 (treated). P-value for linear model. o, Liver metastases (mean ± SD) at experimental endpoints. Each dot is a mouse; n= 17 (control), 9 (treated). P-value for generalized linear model. p, Percentage of mice that developed liver metastases at experimental endpoints; n as in o. P-value for generalized linear model. q, Experimental timeline for late immunotherapy. r, Liver metastasis growth measured by normalized BLI. Points and lines represent individual mice, trend lines show a LOESS model. n= 4 (control), 5 (late immunotherapy). Analyzed with a linear model. s, Liver metastases (mean ± SD) generated by AKTP primary tumors. Dots are an individual mouse. n= 7 (control), 6 (late immunotherapy). P-value for generalized linear model. t, Proposed model for metastatic dissemination of CRC and TME co-evolution.

References

    1. AJCC Cancer Staging Manual. 2017. AJCC Cancer Staging Manual. - DOI
    1. Shimokawa M, et al. Visualization and targeting of LGR5 + human colon cancer stem cells. Nature. 2017;545:187–192. - PubMed
    1. de Sousa e Melo F, et al. A distinct role for Lgr5+ stem cells in primary and metastatic colon cancer. Nature. 2017;543:676–680. - PubMed
    1. Cortina C, et al. A genome editing approach to study cancer stem cells in human tumors. EMBO Mol Med. 2017;9:869–879. doi: 10.15252/emmm.201707550. - DOI - PMC - PubMed
    1. Calon A, et al. Dependency of Colorectal Cancer on a TGF-β-Driven Program in Stromal Cells for Metastasis Initiation. Cancer Cell. 2012;22:571–584. doi: 10.1016/j.ccr.2012.08.013. - DOI - PMC - PubMed

Publication types

MeSH terms

Substances