. 2022 Oct 31;2(1):136.
doi: 10.1038/s43856-022-00191-8.

National and subnational short-term forecasting of COVID-19 in Germany and Poland during early 2021

Affiliations

National and subnational short-term forecasting of COVID-19 in Germany and Poland during early 2021

Johannes Bracher et al. Commun Med (Lond). .

Abstract

Background: During the COVID-19 pandemic there has been a strong interest in forecasts of the short-term development of epidemiological indicators to inform decision makers. In this study we evaluate probabilistic real-time predictions of confirmed cases and deaths from COVID-19 in Germany and Poland for the period from January through April 2021.

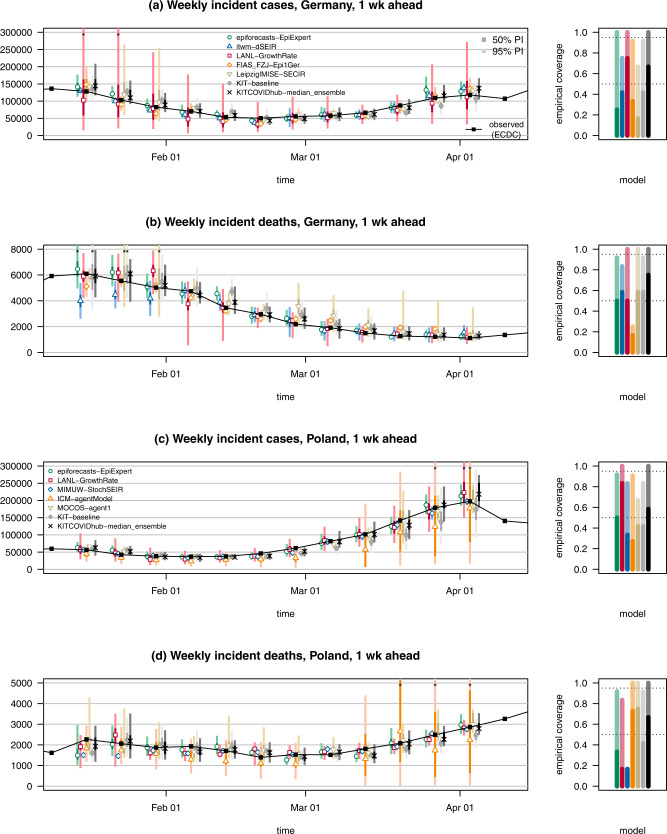
Methods: We evaluate probabilistic real-time predictions of confirmed cases and deaths from COVID-19 in Germany and Poland. These were issued by 15 different forecasting models, run by independent research teams. Moreover, we study the performance of combined ensemble forecasts. Evaluation of probabilistic forecasts is based on proper scoring rules, along with interval coverage proportions to assess calibration. The presented work is part of a pre-registered evaluation study.

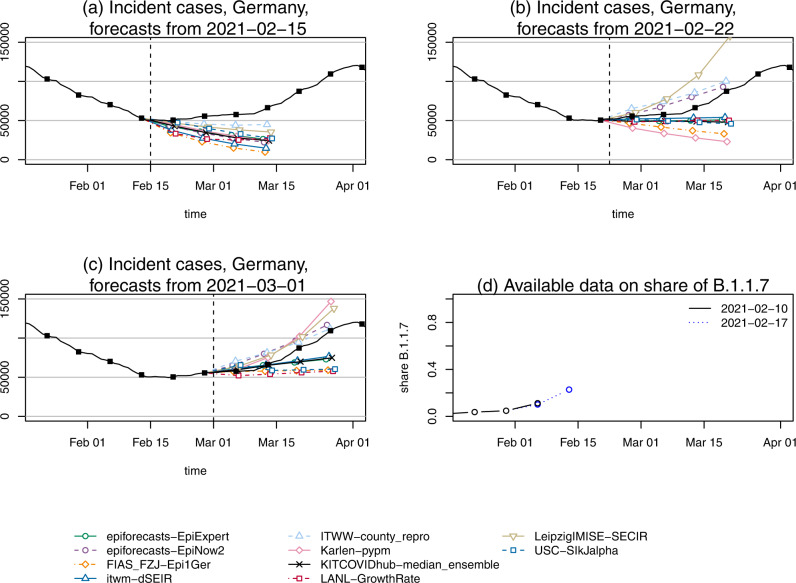
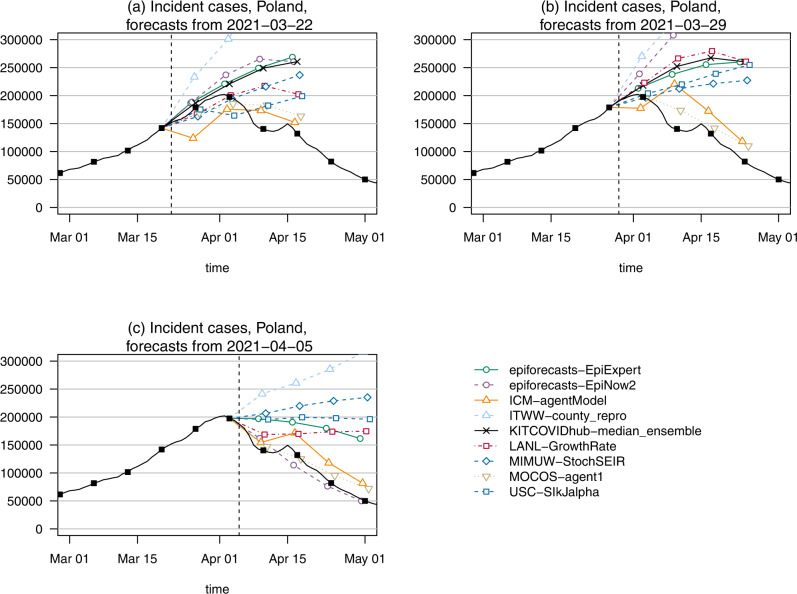
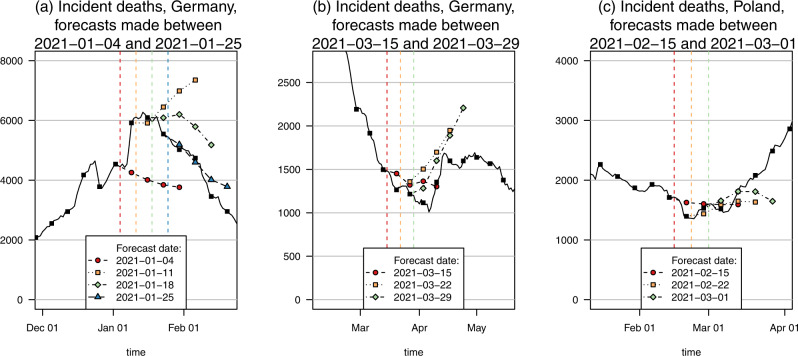
Results: We find that many, though not all, models outperform a simple baseline model up to four weeks ahead for the considered targets. Ensemble methods show very good relative performance. The addressed time period is characterized by rather stable non-pharmaceutical interventions in both countries, making short-term predictions more straightforward than in previous periods. However, major trend changes in reported cases, like the rebound in cases due to the rise of the B.1.1.7 (Alpha) variant in March 2021, prove challenging to predict.

Conclusions: Multi-model approaches can help to improve the performance of epidemiological forecasts. However, while death numbers can be predicted with some success based on current case and hospitalization data, predictability of case numbers remains low beyond quite short time horizons. Additional data sources including sequencing and mobility data, which were not extensively used in the present study, may help to improve performance.

Plain language summary

We compare forecasts of weekly case and death numbers for COVID-19 in Germany and Poland based on 15 different modelling approaches. These cover the period from January to April 2021 and address numbers of cases and deaths one and two weeks into the future, along with the respective uncertainties. We find that combining different forecasts into one forecast can enable better predictions. However, case numbers over longer periods were challenging to predict. Additional data sources, such as information about different versions of the SARS-CoV-2 virus present in the population, might improve forecasts in the future.


Conflict of interest statement

The authors declare no competing interests.

Figures

Fig. 1
Fig. 1. Overview of relevant epidemiological time series.
Reported cases (a) and deaths (b) per seven days in Germany (black) and Poland (red) according to Robert Koch Institute, the Polish Ministry of Health (MZ; solid lines), and Johns Hopkins CSSE (dashed). Additional panels show c the share of cases due to the B.1.1.7 (Alpha) variant, d the proportion of all performed PCR tests which turned out positive, e the overall level of non-pharmaceutical interventions as measured by the Oxford Coronavirus Government Response Tracker (OxCGRT) Stringency Index, and f the population shares having received at least one vaccination dose (dotted) and complete vaccination (solid). The dark gray area indicates the period addressed in the present manuscript, and the light gray area is the one from Bracher et al..
Fig. 2
Fig. 2. One-week-ahead forecasts of cases and deaths from COVID-19 in Germany and Poland.
One-week-ahead forecasts of confirmed cases and deaths from COVID-19 in Germany (a, b) and Poland (c, d). It shows forecasts from a baseline model, the median ensemble of all submissions, and a subset of submitted models with above-average performance. The black line shows observed data. Colored points represent predictive medians and dark and light bars show 50 and 95% prediction intervals, respectively. Asterisks mark intervals exceeding the upper plot limit. The remaining submitted models are displayed in Supplementary Fig. 1. The right column shows the empirical coverage rates of the different models. The dark and light bars represent the proportion of cases where the 50 and 95% prediction intervals, respectively, contained the observed values. The dotted lines show the desired nominal levels of 0.5 and 0.95.
Fig. 3
Fig. 3. Two-week-ahead forecasts of cases and deaths from COVID-19 in Germany and Poland.
Two-week-ahead forecasts of confirmed cases and deaths from COVID-19 in Germany (a, b) and Poland (c, d). It shows forecasts from a baseline model, the median ensemble of all submissions, and a subset of submitted models. The remaining submitted models are displayed in Supplementary Fig. 2. The black line shows observed data. Colored points represent predictive medians, and dark and light bars show 50 and 95% prediction intervals, respectively. The right column shows the empirical coverage rates of the different models. See the caption of Fig. 2 for a detailed explanation of plot elements.
Fig. 4
Fig. 4. Formal evaluation results in terms of mean weighted interval scores.
Average weighted interval scores (bars) and absolute errors (diamonds) achieved by models in Germany (a, b) and Poland (c, d) per target and forecast horizon (12 weekly forecasts). The bottom end of the gray area represents the mean WIS of the baseline model KIT-baseline, and the gray horizontal line is its mean absolute error. Values are shown on a square-root scale to enhance readability. Only models covering all four horizons are shown.
Fig. 5
Fig. 5. Case forecasts in Germany preceding the upward trend change in March 2022.
Point forecasts of cases in Germany, as issued on a 15 February, b 22 February, and c 1 March 2021. These dates, shown as vertical dashed lines, mark the start of a renewed increase in overall case counts due to the new variant of concern B.1.1.7. d Data by RKI on the share of the B.1.1.7 variant as available on the different forecast dates (the next data release by RKI occurred on 3 March). The models Karlen-pypm and LeipzigIMISE-SECIR accounted for the presence of multiple variants from 1 March onwards.
Fig. 6
Fig. 6. Case forecasts in Poland surrounding the peak in April 2022.
Point forecasts of cases in Poland from a 22 March, b 29 March, and c 5 April 2021, surrounding the peak week. In each panel, the date at which forecasts were created is marked by a dashed vertical line. The models ICM-agentModel and MOCOC-agent1 anticipated the trend change correctly, while the remaining models show more or less pronounced overshoot.
Fig. 7
Fig. 7. Death forecasts preceding trend changes.
Point forecasts of the median ensemble during changing trends in deaths. a Downward turn in Germany, January 2021. b Upward turn in Germany, March 2021. c Upward turn in Poland, February/March 2021. Different colors and point/line shapes represent forecasts made at distinct time points (marked by dashed vertical lines).

References

    1. Ray, E. L. et al. Ensemble forecasts of coronavirus disease 2019 (COVID-19) in the U.S. Preprint at medRxivhttps://www.medrxiv.org/content/early/2020/08/22/2020.08.19.20177493 (2020).
    1. Cramer EY, et al. Evaluation of individual and ensemble probabilistic forecasts of COVID-19 mortality in the United States. Proc. Natl Acad. Sci. USA. 2022;119:e2113561119. doi: 10.1073/pnas.2113561119. - DOI - PMC - PubMed
    1. Borchering RK, et al. Modeling of future COVID-19 cases, hospitalizations, and deaths, by vaccination rates and nonpharmaceutical intervention scenarios – United States, April–September 2021. Morb. Mortal. Wkly. Rep. 2021;70:719–724. doi: 10.15585/mmwr.mm7019e3. - DOI - PMC - PubMed
    1. Sherratt, K. et al. Predictive performance of multi-model ensemble forecasts of COVID-19 across European nations. Preprint at medRxivhttps://www.medrxiv.org/content/early/2022/06/16/2022.06.16.22276024 (2022). - PMC - PubMed
    1. McGowan CJ, et al. Collaborative efforts to forecast seasonal influenza in the United States, 2015–2016. Sci. Rep. 2019;9:683. doi: 10.1038/s41598-018-36361-9. - DOI - PMC - PubMed