. 2022 Nov 9;22(1):290.
doi: 10.1186/s12874-022-01773-9.

Modelling multiple time-scales with flexible parametric survival models

Affiliations

Modelling multiple time-scales with flexible parametric survival models

Nurgul Batyrbekova et al. BMC Med Res Methodol. .

Abstract

Background: There are situations when we need to model multiple time-scales in survival analysis. A usual approach in this setting would involve fitting Cox or Poisson models to a time-split dataset. However, this leads to large datasets and can be computationally intensive when model fitting, especially if interest lies in displaying how the estimated hazard rate or survival change along multiple time-scales continuously.

Methods: We propose to use flexible parametric survival models on the log hazard scale as an alternative method when modelling data with multiple time-scales. By choosing one of the time-scales as reference, and rewriting other time-scales as a function of this reference time-scale, users can avoid time-splitting of the data.

Result: Through case-studies we demonstrate the usefulness of this method and provide examples of graphical representations of estimated hazard rates and survival proportions. The model gives nearly identical results to using a Poisson model, without requiring time-splitting.

Conclusion: Flexible parametric survival models are a powerful tool for modelling multiple time-scales. This method does not require splitting the data into small time-intervals, and therefore saves time, helps avoid technological limitations and reduces room for error.

Keywords: Cohort studies; Epidemiological methods; Flexible parametric survival models; Matched cohort; Multiple time-scales; Time-varying covariate.


Conflict of interest statement

NB and RS are employed by SDS Life Science and their time within this project was funded by SDS Life Science, however, SDS Life Science had no involvement in the study. TA, HB, PCL, PD, ARL, MH declare that they have no conflict of interest.

Figures

Fig. 1
Fig. 1
Based on Rotterdam Breast Cancer data, estimated mortality rates per 1000 person-years for breast cancer patients who were aged 50 at primary surgery and were treated with hormonal therapy (solid lines) and without hormonal therapy (dotted lines). Left panel shows the mortality rates over time since surgery (time-scale t1) for patients having relapse or metastasis (RM) at different time-points since surgery as well as for non-RM patients. Right panel shows the mortality rates for RM patients along the time since RM (time-scale t2)
Fig. 2
Fig. 2
Estimated mortality rate ratio and 95% confidence interval for breast cancer patients in the Rotterdam Breast Cancer data, experiencing relapse or metastasis (RM) after primary surgery versus patients without RM, over time since RM
Fig. 3
Fig. 3
Predicted survival proportions for breast cancer patients in the Rotterdam Breast Cancer data, who were aged 50 at primary surgery and were treated with hormonal therapy (solid lines) and without hormonal therapy (dotted lines). Panel (A) shows the survival proportions over time since surgery (time-scale t1) for patients having relapse or metastasis (RM) at different time-points since surgery as well as for non-RM patients. Panel (B) shows the survival proportions since RM (time-scale t2) for patients having RM at different time-points. Panel (C) shows 1-, 3- and 5-year survival proportions since RM across time since surgery
Fig. 4
Fig. 4
Estimated mortality rates per 1000 person-years for Swedish MPN patients and matched comparators where solid lines are for men and dotted lines are for women. Left panel shows the mortality rates over attained age (time-scale t1) for patients with different ages at diagnosis and for comparators. Right panel shows the mortality rates for MPN patients along the time since diagnosis (time-scale t2)
Fig. 5
Fig. 5
Estimated mortality rate ratio and 95% confidence interval over time since diagnosis for Swedish MPN patients in comparison to matched comparators without MPN
Fig. 6
Fig. 6
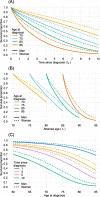
Predicted survival proportions for Swedish MPN patients where solid lines are for men and dotted lines are for women. Panel (A) shows the survival proportions over time since diagnosis (time-scale t2). Panel (B) shows the survival proportions over attained age (time-scale t1) for different ages at diagnosis. Panel (C) shows 1-, 3-, 5- and 10-year survival proportions across age at diagnosis

References

    1. Efron B. Logistic Regression, Survival Analysis, and the Kaplan-Meier Curve. J Am Stat Assoc. 1988;83(402):414–425. doi: 10.2307/2288857. - DOI
    1. Cox DR. Regression Models and Life Tables. J R Stat Soc. 1972;B(34):187–202.
    1. Royston P, Altman DG. Regression Using Fractional Polynomials of Continuous Covariates: Parsimonious Parametric Modelling. J R Stat Soc Ser C (Appl Stat). 1994;43(3):429–467.
    1. Herndon JE, II, Harrell FE., Jr The restricted cubic spline hazard model. Commun Stat Theory Methods. 1990;19(2):639–663. doi: 10.1080/03610929008830224. - DOI
    1. Royston P, Parmar MKB. Flexible Parametric Proportional-Hazards and Proportional-Odds Models for Censored Survival Data, with Application to Prognostic Modelling and Estimation of Treatment Effects. Statistics in Medicine. 2002;21(15):2175–2197. doi: 10.1002/sim.1203. - DOI - PubMed

Publication types

LinkOut - more resources