. 2022 Nov 9;20(1):252.
doi: 10.1186/s12915-022-01450-9.

Temporal change in chromatin accessibility predicts regulators of nodulation in Medicago truncatula

Affiliations

Temporal change in chromatin accessibility predicts regulators of nodulation in Medicago truncatula

Sara A Knaack et al. BMC Biol. .

Abstract

Background: Symbiotic associations between bacteria and leguminous plants lead to the formation of root nodules that fix nitrogen needed for sustainable agricultural systems. Symbiosis triggers extensive genome and transcriptome remodeling in the plant, yet an integrated understanding of the extent of chromatin changes and transcriptional networks that functionally regulate gene expression associated with symbiosis remains poorly understood. In particular, analyses of early temporal events driving this symbiosis have only captured correlative relationships between regulators and targets at mRNA level. Here, we characterize changes in transcriptome and chromatin accessibility in the model legume Medicago truncatula, in response to rhizobial signals that trigger the formation of root nodules.

Results: We profiled the temporal chromatin accessibility (ATAC-seq) and transcriptome (RNA-seq) dynamics of M. truncatula roots treated with bacterial small molecules called lipo-chitooligosaccharides that trigger host symbiotic pathways of nodule development. Using a novel approach, dynamic regulatory module networks, we integrated ATAC-seq and RNA-seq time courses to predict cis-regulatory elements and transcription factors that most significantly contribute to transcriptomic changes associated with symbiosis. Regulators involved in auxin (IAA4-5, SHY2), ethylene (EIN3, ERF1), and abscisic acid (ABI5) hormone response, as well as histone and DNA methylation (IBM1), emerged among those most predictive of transcriptome dynamics. RNAi-based knockdown of EIN3 and ERF1 reduced nodule number in M. truncatula validating the role of these predicted regulators in symbiosis between legumes and rhizobia.

Conclusions: Our transcriptomic and chromatin accessibility datasets provide a valuable resource to understand the gene regulatory programs controlling the early stages of the dynamic process of symbiosis. The regulators identified provide potential targets for future experimental validation, and the engineering of nodulation in species is unable to establish that symbiosis naturally.

Keywords: Chromatin accessibility; Cis-regulatory elements; Gene regulatory network; Machine learning; Medicago; Nitrogen fixation; Nodulation; Symbiosis; Transcriptome and chromatin dynamics.


Conflict of interest statement

The authors declare no competing interests.

Figures

Fig. 1
Fig. 1
Overview of study. A Medicago roots were subjected to LCO treatment, followed by time course profiling of ATAC-seq and RNA-seq measurements. The data were analyzed using computational tools for differential gene expression analysis (DE analysis), time course gene expression analysis (ESCAROLE), and integrative analysis of RNA-seq and ATAC-seq time course (DRMN). Outputs from these tools were used to find gene modules, transitioning genes, TF-target interactions, and prioritize regulators. B Principal component analysis (PCA) of expression time course showing grouping and ordering of the (3) biological replicates per time point. Principal components 1, 2, and 3 explain ~50% of the variation. C Similarity scores (F-score) between the differentially expressed genes (DEG) set obtained in this study (LCO treatment) and DEG sets identified from previously published time-course data under rhizobium treatment from Larrainzar et al. For the latter data, DEGs were called with respect to control for each time course (rows and columns corresponding to WT, nfp, lyk3, skl) and with respect to WT at each time point for each mutant strain (rows and columns with “vs. WT” labels). D Expression patterns of known nodulation and symbiosis genes (NIN, CRE1, ENOD11, RPG, and ERN1) in our dataset (LCO treatment) and in the four rhizobia treatment time courses from Larrainzar et al. (WT, nfp, lyk3, skl). The systematic names for the shown genes are MtrunA17Chr5g0448621 (NIN), MtrunA17Chr8g0392301 (CRE1), MtrunA17Chr3g0082991 (ENOD11), MtrunA17Chr1g0197491 (RPG), and MtrunA17Chr7g0253421 (RPG)
Fig. 2
Fig. 2
Transcriptome dynamics in response to LCOs. A ESCAROLE results for seven modules, based on transcript abundance data. Each heatmap includes genes assigned to that module at that time point, and the height of each heatmap corresponds to the number of genes (inset numbers). B The module assignment heatmap depicting typical gene expression trends obtained by hierarchical clustering of gene module profiles into transitioning gene sets. Shown are the mean module assignments, number of genes in each set, and expression levels at each time point for each cluster. Arrows indicate two example trends of expression change. C Examples of transitioning gene sets showing gene expression upregulation or downregulation, enriched for genes implicated in nodulation such as defense response to bacterium (cluster 293) and meristem growth (cluster 186)
Fig. 3
Fig. 3
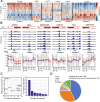
Chromatin accessibility data exploratory analysis. A Clustering of promoter accessibility profiles in the LCO treatment time course. B IGV track and profiles of coverage for the promoter regions (± 2 kbp of TSS) of genes involved in root nodulation, representative of each cluster (upper panel). Gene annotation track (top) denotes the gene of interest (black) and neighboring genes (gray). C PCA results for the same promoter accessibility data. D Distribution of genomic regions for the universal ATAC-seq peaks
Fig. 4
Fig. 4
Correlation between chromatin accessibility and gene expression. A Histogram of Pearson’s correlation of all (blue) and significantly correlated (orange) promoter accessibility and gene expression pairs. The number of pairs are indicated with inset numbers. B Clusters of promoter accessibility and gene expression for significant (P<0.05) (i) positive and (ii) negative correlation relative to random. C Histograms of correlation for all (blue) and significantly correlated peak and gene pairs (orange) and associated statistics. The upper histogram includes all mapped peak-gene pairs, while the lower includes only the maximally correlated peak for each gene (below). D Clustered peak accessibility and corresponding expression profiles for significantly positively (i) or negatively (ii) correlated gene-peak mappings
Fig. 5
Fig. 5
Dynamic regulatory module network (DRMN) analysis. A Heatmap of DRMN inferred expression modules across the time course. Each heatmap corresponds to an expression module for each time point, the size of the heatmap indicating the number of genes assigned to that module (listed on top). B Scatter plots of actual and predicted expression values. F-score similarity of DRMN modules across time points. D DRMN transitioning gene sets. Shown are the mean DRMN module assignment, number of genes, mean expression levels, and mean promoter accessibility levels for each transitioning gene set (rows) across time (columns)
Fig. 6
Fig. 6
Regulator prioritization results. A DRMN regulator regression weights that meet a T-test criterion of significant change (P < 0.05) between 0–1 h and 2–24 h. CisBP motif IDs mapped to > = 3 common names (*) are summarized separately (bottom center). B Regulators prioritized based on the frequency with which they are selected across modules with the T-test criteria. Labels of motifs mapped to IBM1, EDN3, MTF1, and EIN3 discussed in the text are in bold in both panels
Fig. 7
Fig. 7
Multi-task group LASSO (MTG-LASSO) to predict regulators of transitioning genes. A MTG-LASSO was applied to infer significant regulatory features for each transitioning gene set. Shown is a model of predicting expression (Y) for a set of genes using the predictor features (X) of the genes and coefficients (B). Each gene (column of Y) is a task and each row of B corresponds to the regression of a predictor for all genes. MTG-LASSO picks the same regulators for all genes in a set but allows for different regression weights. The regression weights for a regulator (row) is a group. B Visualization of the top 1000 predicted TF-gene network edges, ranked by regression weight magnitude from MTG-LASSO. C Example transitioning gene sets showing corresponding gene expression and motif accessibility profiles for regulators of interest (IBM1, MTF1, EIN3, EDN3). For each cluster, we show genes with significant change in accessibility between 0–2 and 4–24 h (T-test P-value < 0.05) for at least one regulatory feature per cluster. D Ranking of all regulators selected in the MTG-LASSO-based regulatory network. Regulators are ranked by the number of predicted targets. The motifs that were mapped to a common name are shown. The ranking highlights regulators identified at the DRMN module level (Fig. 6) and additional regulators like TIFY and CYCLOPS
Fig. 8
Fig. 8
RNAi knockdown of EIN3 and ERF1 reduced the number of nodules on M. truncatula plants. A Data for empty vector control, and EIN3 and ERF1 knock down roots (n = 20, 16, and 13 replicates respectively) were analyzed by ANOVA followed by Tukey’s HSD test for multiple comparisons. Box plots not connected by the same letter are significantly different (P < 0.05). One extreme outlier (29 nodules) was excluded in the MtrunA17Chrg0186741 (ERF1) experiment. B Images of nodules on subtending root supporting the effectiveness of RNAi. Blue color (top) indicates the rhizobial infection (S. meliloti constitutively expressing lacZ), and the red fluorescence marker (bottom) identifies transgenic roots (white scale bar = 1 mm)

Similar articles

Cited by

References

    1. Roy S, Liu W, Nandety RS, Crook A, Mysore KS, Pislariu CI, et al. Celebrating 20 years of genetic discoveries in legume nodulation and symbiotic nitrogen fixation. Plant Cell. 2020;32(1):15–41. - PMC - PubMed
    1. Smil V. Nitrogen in crop production: an account of global flows. Glob Biogeochem Cycles. 1999;13(2):647–662.
    1. Genre A, Russo G. Does a common pathway transduce symbiotic signals in plant microbe interactions? Front Plant Sci. 2016;7(96):96. 10.3389/fpls.2016.00096. - PMC - PubMed
    1. Limpens E, Franken C, Smit P, Willemse J, Bisseling T, Geurts R. LysM domain receptor kinases regulating rhizobial Nod factor-induced infection. Science. 2003;302(5645):630–633. - PubMed
    1. Arrighi JF, Barre A, Ben Amor B, Bersoult A, Soriano LC, Mirabella R, et al. The Medicago truncatula lysine motif-receptor-like kinase gene family includes NFP and new nodule-expressed genes. Plant Physiol. 2006;142(1):265–79. - PMC - PubMed

Publication types

MeSH terms

LinkOut - more resources