. 2022 Nov 9;20(1):253.
doi: 10.1186/s12915-022-01451-8.

An integrated in silico-in vitro approach for identifying therapeutic targets against osteoarthritis

Affiliations

An integrated in silico-in vitro approach for identifying therapeutic targets against osteoarthritis

Raphaëlle Lesage et al. BMC Biol. .

Abstract

Background: Without the availability of disease-modifying drugs, there is an unmet therapeutic need for osteoarthritic patients. During osteoarthritis, the homeostasis of articular chondrocytes is dysregulated and a phenotypical transition called hypertrophy occurs, leading to cartilage degeneration. Targeting this phenotypic transition has emerged as a potential therapeutic strategy. Chondrocyte phenotype maintenance and switch are controlled by an intricate network of intracellular factors, each influenced by a myriad of feedback mechanisms, making it challenging to intuitively predict treatment outcomes, while in silico modeling can help unravel that complexity. In this study, we aim to develop a virtual articular chondrocyte to guide experiments in order to rationalize the identification of potential drug targets via screening of combination therapies through computational modeling and simulations.

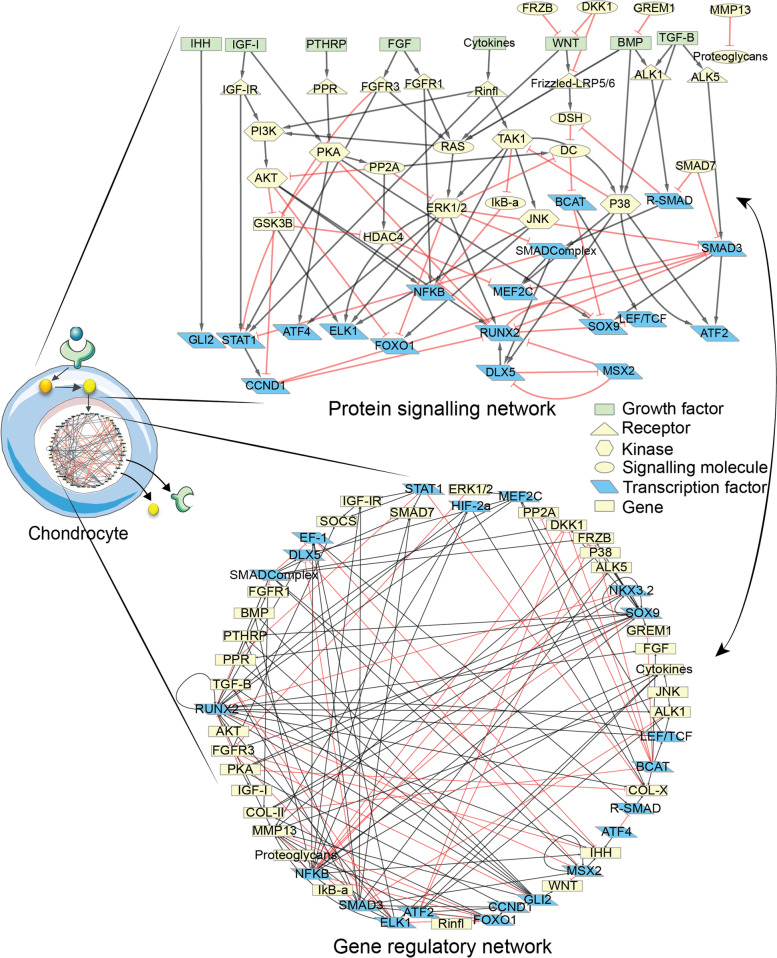
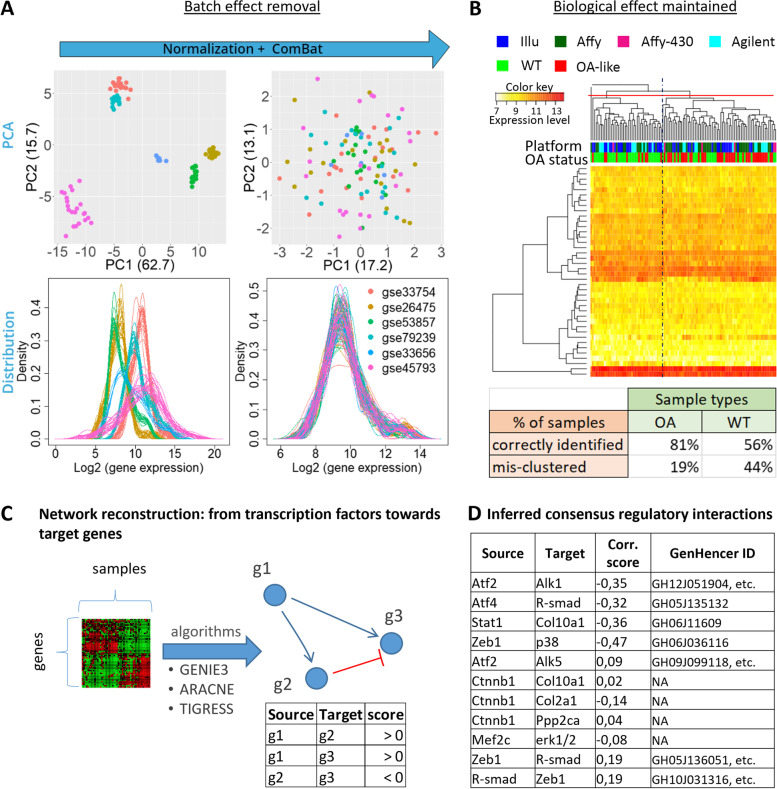
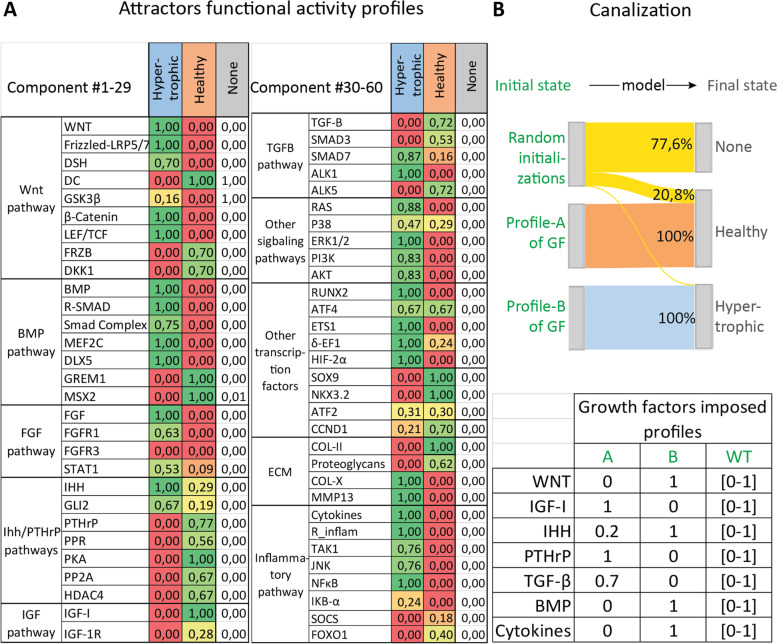
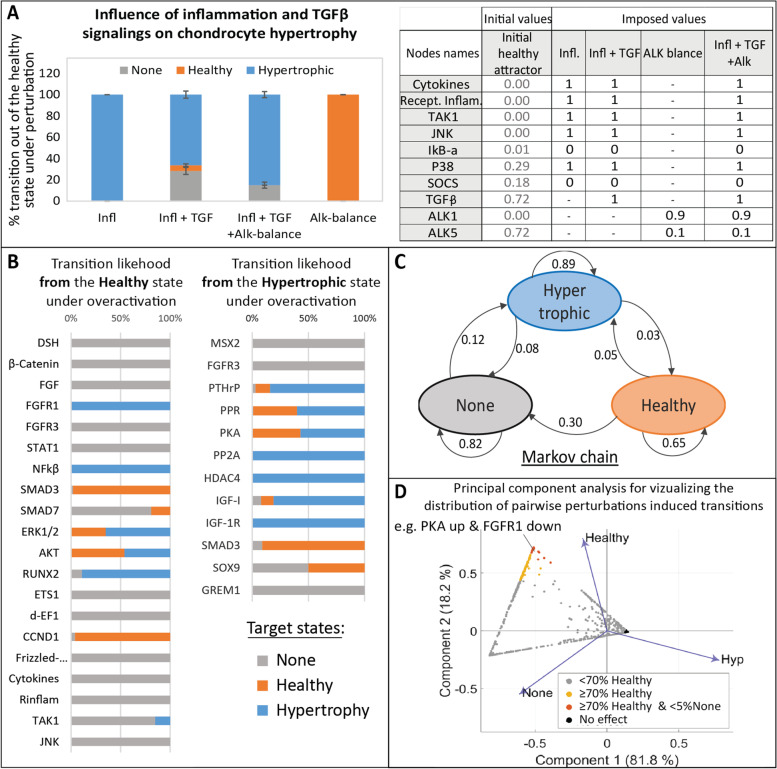
Results: We developed a signal transduction network model using knowledge-based and data-driven (machine learning) modeling technologies. The in silico high-throughput screening of (pairwise) perturbations operated with that network model highlighted conditions potentially affecting the hypertrophic switch. A selection of promising combinations was further tested in a murine cell line and primary human chondrocytes, which notably highlighted a previously unreported synergistic effect between the protein kinase A and the fibroblast growth factor receptor 1.

Conclusions: Here, we provide a virtual articular chondrocyte in the form of a signal transduction interactive knowledge base and of an executable computational model. Our in silico-in vitro strategy opens new routes for developing osteoarthritis targeting therapies by refining the early stages of drug target discovery.

Keywords: Chondrocyte hypertrophy; Computational modeling; Drug targets; In vitro validation; Network of signal transduction; Osteoarthritis; Regulatory network inference; Virtual cell.


Conflict of interest statement

The authors declare that they have no conflicts of interest.

Figures

Fig. 1
Fig. 1
Influence map of the signaling and gene regulatory networks (GRN) implemented in the model. Red, T-ended arrows represent inhibitory influences and black arrows represent activating influences. On the signaling side, growth factors and pro-inflammatory cytokines are represented by green rectangular nodes, receptors are yellow triangles, kinase proteins are yellow hexagons and other signaling proteins are yellow ellipses. Transcription factors (TFs) are represented in blue both in the signaling network and the GRN. In addition, target genes are represented by yellow rectangles in the GRN, and TFs might also be targets of other TFs in the GRN. In this image, each biological component is represented by a gene in the GRN and a protein in the signaling network, except for the ones that are not involved in one of the subnetworks (e.g., NKX3.2 only plays a role in the GRN while COL-II and COL-X do not have upstream and downstream influences in the protein signaling network). Network images were designed with Cell Designer
Fig. 2
Fig. 2
Microarray integration for GRN inference. A Assembling and correcting the microarray sub-datasets. PCA plots and gene expression distributions of the assembled dataset colored by arrays (GSE-number), before and after quantile normalization and batch effect correction with ComBat. B Unsupervised clustering with the Euclidian complete method highlights that the samples do not cluster according to the technological platform but rather according to the OA status of the samples. When splitting the hierarchical tree into three branches, a mostly OA group and a mostly WT group stand out. The table summarizes the percentage of true OA (resp. WT) samples correctly grouped in the “OA-group” (resp. “WT-group”) highlighting a clustering accuracy in line with what is obtained for the individual sets before correction. C the algorithms compute possible regulatory interactions and output a list of possible transcriptional interactions from a transcription factor to another gene. “g1,” “g2,” and “g3” denote gene1, 2, and 3. D List of interactions inferred with the merged OA dataset and integrated into the mechanistic model (11 predictions in total). Inference was run with three algorithms, solely interactions that were present in the results of the three algorithms were reported and integrated. An interaction was considered present for one algorithm if its score was higher than a threshold defined as the difference between the mean and standard deviation of all scores (Additional file 6, Data S2). Corr.score is the Spearman correlation coefficient, computed solely to define the interaction sign (activation if positive, inhibition if negative). The validity of inferred interactions was supported by looking for binding sites of the source gene in the enhancer region of the target with using the GeneHancer database embedded in GeneCards [26]. GeneHancer IDs are reported, when found. ‘etc.’ in indicated when more than one was found. The queried gene IDs and the full list of GeneHancer IDs are reported in Additional file 7, Table S3
Fig. 3
Fig. 3
Predicted chondrocyte profiles and canalization for the three emerging states during Monte Carlo analyses. The Monte Carlo analyses consist in sampling 10.000 random initial states for the variables, with the possibility to impose constraints (similar to external biological cues). A The Monte Carlo analysis without constraints highlights the existence of three final states (i.e., attractors) with different activity profiles (in columns). The global activity of a protein is presented in this table as the product of the predicted gene expression and the protein activation level. The table only reports the global activity; a complete table including the gene expression and protein activation levels is available in Data file S2. Rows represent the variables of the model and are grouped by pathways or functional groups. B Specific activity profiles were imposed to the growth factors, as reported in the table, while variables other than growth factors were initialized randomly. Profile A represents a possible healthy environment. Profile B represents a more pathological environment. The ‘Random’ column indicates the case without constraints in which initial activities were randomly sampled within the interval [0,1]. In the Sankey diagram, initial states are on the left and final states on the right. Strips indicate the percentage of initializations (among the 10.000) that reached each of the possible attractors during the Monte Carlo without constraints (“Random initializations”). That percentage is also reported for the Monte Carlo with constraints (profile A and B)
Fig. 4
Fig. 4
Study of the virtual chondrocyte state transition and in silico screening of target perturbations. A Relation between Inflammation and TGFβ and influence on the chondrocyte state. Perturbations are applied on the healthy attractor, bar height gives the average percentage of transitions towards one of the target states, error bar denotes standard deviation. “Infl.” refers to imposed inflammation, “TGF” refers to TGFβ over-activation, and “Alk balance” to the modification of the ratio between TGFβ receptors (ALK1 and ALK5). Conditions were mimicked as described in the table. “−” denotes no modification of the initial value. A transition from “healthy” to “healthy” means no transition. B All single node perturbations triggering a state transition from the Healthy (resp. Hypertrophic) state. (C) Markov chain providing the overall probability of transition from one state to another, under single node perturbations. Arrows indicate transitions from an initial state towards a target state with the associated probability. Thus, the total probability of outgoing arrows for any state is 1.0. D PCA visualizing the results of the systematic screening of all possible combinatorial perturbations on a hypertrophic-like chondrocyte. Each dot represents one of the 7080 screened conditions. Principal components are computed based on the percentage of transitions towards the 3 attractors, reported as eigenvalues (blue arrows). Dot colors correspond to threshold in the percentage of transitions towards the healthy state for potential OA therapies. The details of the predicted conditions leading to 70% and up to 100% of transitions towards the healthy state are available in Additional file 9, Data S4, the ones that were selected for experimental validation are further described below.
Fig. 5
Fig. 5
In vitro validation of in silico predictions on chondrocyte phenotype changes. A Concept of in silico identification of potential drug targets. B Secreted ALP activity, relative to DNA quantity, positively linearly correlates with Col10a1 gene expression during hypertrophic differentiation with and without Ihh treatment. Results of one representative experiment. Each point is the average of 3 replicates and bars denote standard deviation. C Effect of PKA or SMAD3 activation as measured in silico and in vitro in ATDC5 (N = 3 replicates, histograms show average fold change in ALP activity relative to control and bars are standard deviations, p-values are computed with one-tailed t-test and Welch’s correction) and human chondrocytes from OA donors (N= 4 donors with 3 replicates each, p-value is computed with one-tailed linear mixed effect model). In silico activation was performed by setting the variables to their maximum value (1.0), in vitro PKA (resp. SMAD3) activation was performed with Forskolin 1μM (resp. Activin 100ng/ml) for 24h. D Single and combinatorial drug screening in ATDC5 with selected conditions based on in silico predictions. Boxplot of the series of conditions across independent replicates (z-scores of ALP activity fold change) with control conditions in purple. Conditions significantly lower than the control (combined p-value < 0.05) have dark grey borders and dots (Wilcoxon rank-sum test with BH correction and combined probabilities over independent runs). For each condition, dots are the average of biological triplicates, summary statistics are represented by a horizontal line for the median of independent experimental repetitions and a box for the interquartile range. The whiskers extend to the most extreme data point that is not >1.5 times the length of the box away from the box. Blue labels indicate potent conditions predicted by the in silico model, gray labeled conditions are added to the experimental set-up for information. CM stands for ‘control medium’, medium1 has 0.02% of DMSO and medium 2 0.035%. * Indicates in silico predicted conditions without significant decrease of ALP activity in vitro
Fig. 6
Fig. 6
In-silico vs. In-vitro dose-response effect of PKA activation with FGFR1 inhibition. The most potent condition from the screening is investigated further for a potential dose effect. A Fold change (FC) in ALP activity, with respect to control, due to PKA activator (Forskolin, 1μM) or FGFR1 inhibitor (PD161560, 125nM, and 625 nM) or the combination of both. B A range of values for PKA and FGFR1 imposed activities is screened in silico with 0 meaning no activity and 1 being the max possible activity. The percentage of transitions remaining in the hypertrophic state or transitioning towards the healthy state is reported in the upper panels, the rest of the transitions go to the “None” state. In the middle panels, fold change (resp. inverse of fold change) in DNA-normalized ALP activity with respect to control DMSO in ATDC5 is reported for a range of Forskolin and PD161570 concentrations. The in-vitro situation without drugs (yellow rectangle) would correspond to the basal level of PKA and FGFR1 in in-silico hypertrophy but there is no one-to-one correspondence between the in silico and in vitro ranges. All in vitro results represent n=9 (3 bio-replicates in 3 independent experiments), p-values are computed on log-transformed data with a linear mixed-effect model, user-defined contrasts (only combination versus corresponding single doses were compared), one-sided test and adjustment for multiple comparisons with the Holm’s method. The combinatorial treatment effects were greater than the ones for either of the single treatment both in silico and in vitro, for all concentrations in the gradient of dose relationships investigated

Similar articles

Cited by

References

    1. Karsdal MA, Michaelis M, Ladel C, Siebuhr AS, Bihlet AR, Andersen JR, et al. Disease-modifying treatments for osteoarthritis (DMOADs) of the knee and hip: lessons learned from failures and opportunities for the future. Osteoarthr Cartil. 2016;24:2013–2021. - PubMed
    1. Raman S, FitzGerald U, Murphy JM. Interplay of inflammatory mediators with epigenetics and cartilage modifications in osteoarthritis. Front Bioeng Biotechnol. 2018;6:22. - PMC - PubMed
    1. Ji Q, Zheng Y, Zhang G, Hu Y, Fan X, Hou Y, et al. Single-cell RNA-seq analysis reveals the progression of human osteoarthritis. Ann Rheum Dis. 2019;78:100–110. - PMC - PubMed
    1. Von Der Mark K, Kirsch T, Nerlich A, Kuss A, Weseloh G, Glückert K, et al. Type x collagen synthesis in human osteoarthritic cartilage. indication of chondrocyte hypertrophy. Arthritis Rheum. 1992;35:806–811. - PubMed
    1. Tchetina EV, Poole AR, Zaitseva EM, Sharapova EP, Kashevarova NG, Taskina EA, et al. Differences in Mammalian Target of Rapamycin Gene Expression in the Peripheral Blood and Articular Cartilages of Osteoarthritic Patients and Disease Activity. Arthritis. 2013;2013:46148. - PMC - PubMed

Publication types