

Learning at your brain's rhythm: individualized entrainment boosts learning for perceptual decisions
- PMID: 36352510
- PMCID: PMC10152088
- DOI: 10.1093/cercor/bhac426
Learning at your brain's rhythm: individualized entrainment boosts learning for perceptual decisions
Abstract
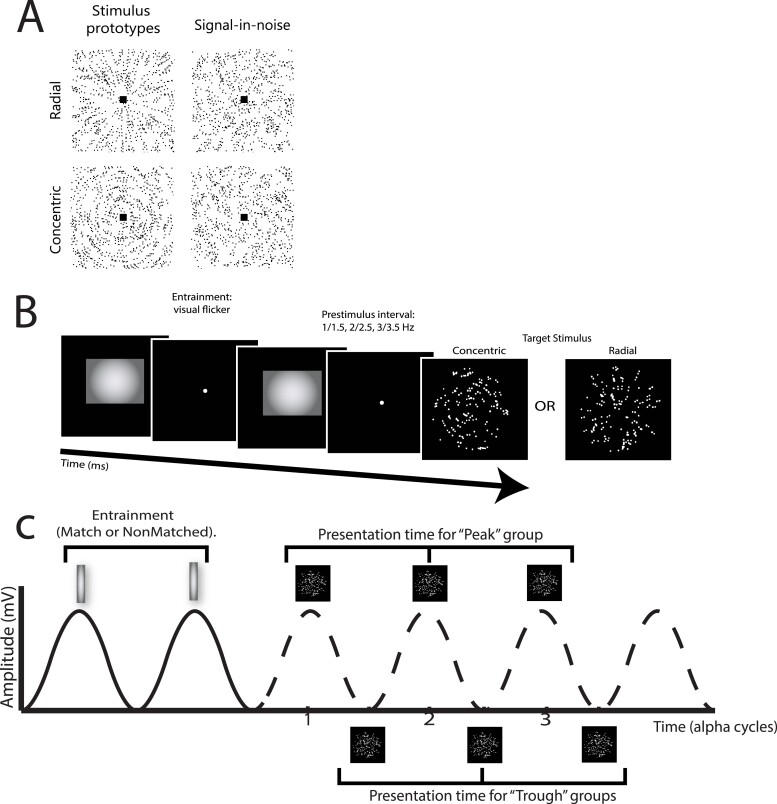
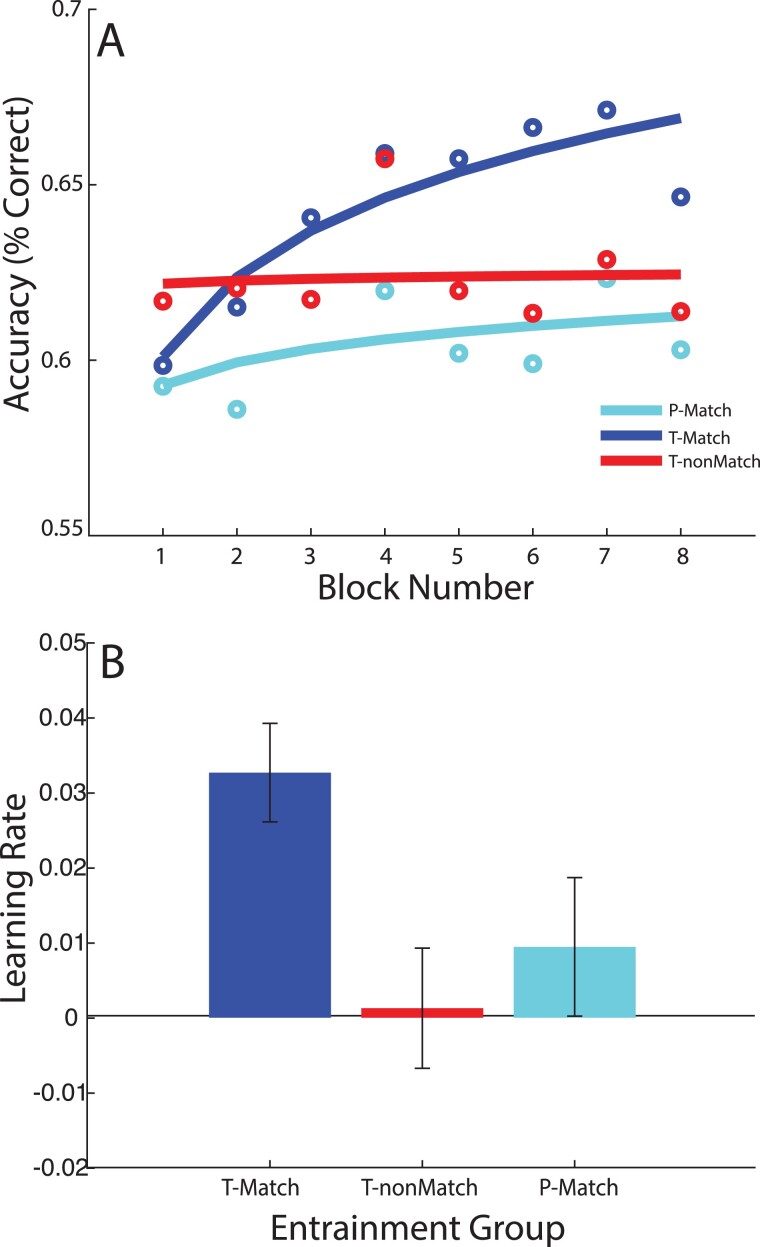
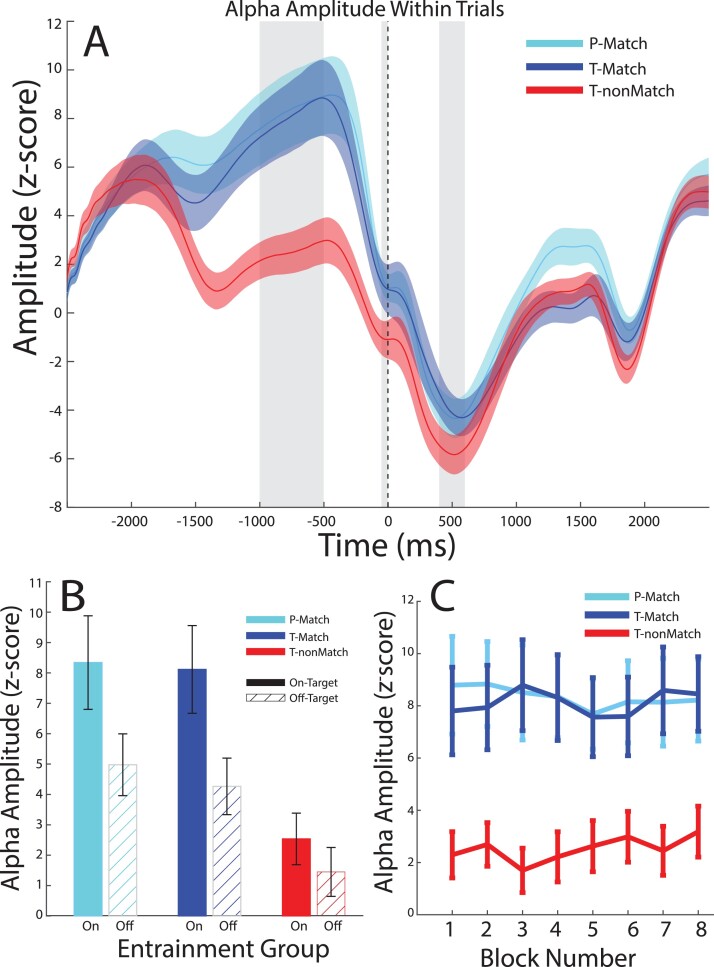
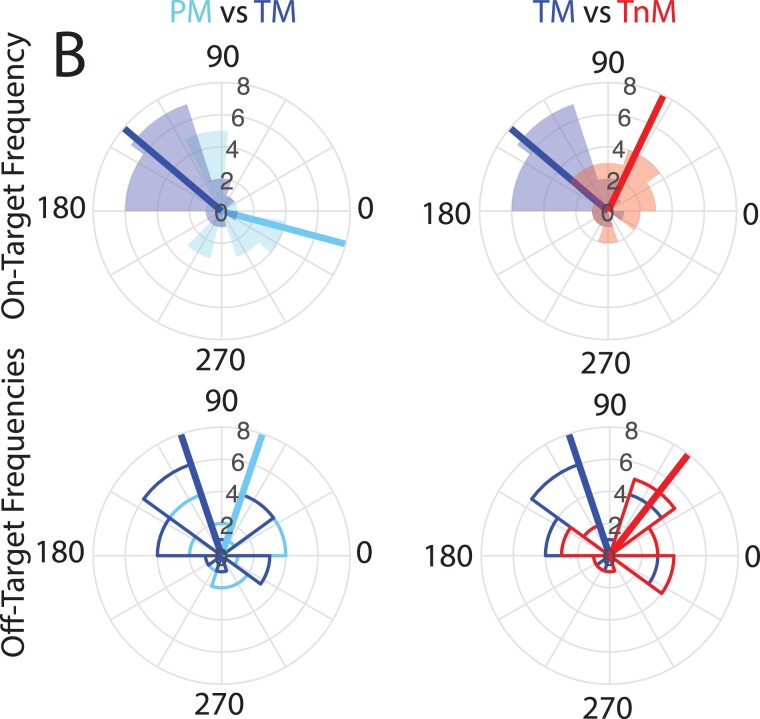
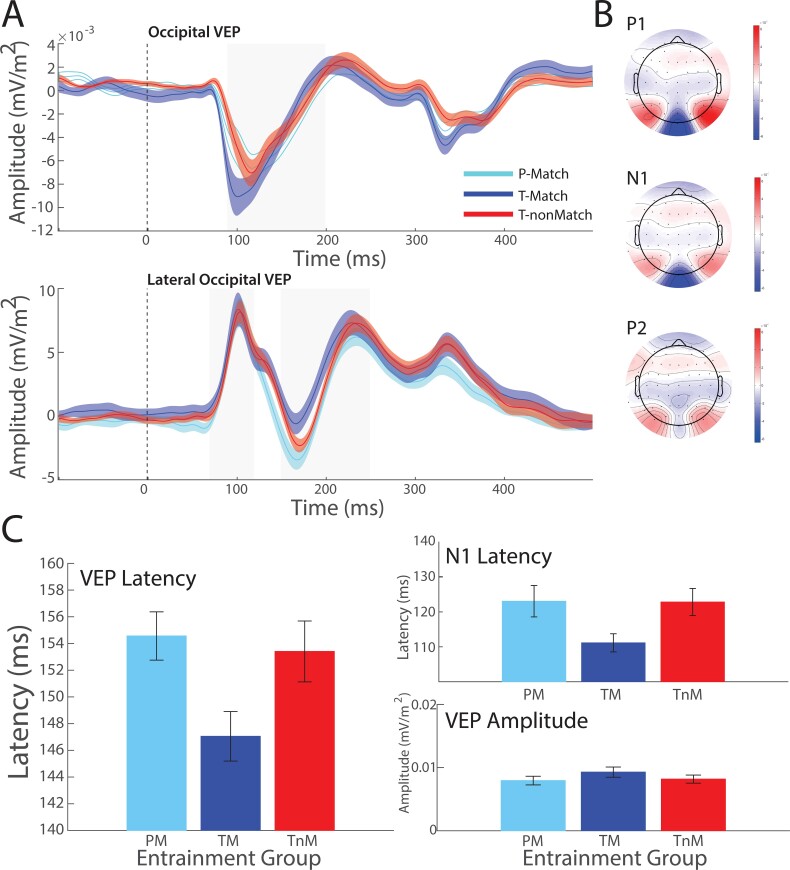
Training is known to improve our ability to make decisions when interacting in complex environments. However, individuals vary in their ability to learn new tasks and acquire new skills in different settings. Here, we test whether this variability in learning ability relates to individual brain oscillatory states. We use a visual flicker paradigm to entrain individuals at their own brain rhythm (i.e. peak alpha frequency) as measured by resting-state electroencephalography (EEG). We demonstrate that this individual frequency-matched brain entrainment results in faster learning in a visual identification task (i.e. detecting targets embedded in background clutter) compared to entrainment that does not match an individual's alpha frequency. Further, we show that learning is specific to the phase relationship between the entraining flicker and the visual target stimulus. EEG during entrainment showed that individualized alpha entrainment boosts alpha power, induces phase alignment in the pre-stimulus period, and results in shorter latency of early visual evoked potentials, suggesting that brain entrainment facilitates early visual processing to support improved perceptual decisions. These findings suggest that individualized brain entrainment may boost perceptual learning by altering gain control mechanisms in the visual cortex, indicating a key role for individual neural oscillatory states in learning and brain plasticity.
Keywords: EEG; entrainment; learning; perceptual decisions; visual cortex.
© The Author(s) 2022. Published by Oxford University Press.
Figures
Similar articles
-
Individual Alpha Peak Frequency Predicts 10 Hz Flicker Effects on Selective Attention.J Neurosci. 2017 Oct 18;37(42):10173-10184. doi: 10.1523/JNEUROSCI.1163-17.2017. Epub 2017 Sep 20. J Neurosci. 2017. PMID: 28931569 Free PMC article.
-
The Role of Oscillatory Phase in Determining the Temporal Organization of Perception: Evidence from Sensory Entrainment.J Neurosci. 2017 Nov 1;37(44):10636-10644. doi: 10.1523/JNEUROSCI.1704-17.2017. Epub 2017 Oct 2. J Neurosci. 2017. PMID: 28972130 Free PMC article.
-
Strength of Low-Frequency EEG Phase Entrainment to External Stimuli Is Associated with Fluctuations in the Brain's Internal State.eNeuro. 2025 Jan 27;12(1):ENEURO.0064-24.2024. doi: 10.1523/ENEURO.0064-24.2024. Print 2025 Jan. eNeuro. 2025. PMID: 39779324 Free PMC article.
-
Stimulus-Driven Brain Rhythms within the Alpha Band: The Attentional-Modulation Conundrum.J Neurosci. 2019 Apr 17;39(16):3119-3129. doi: 10.1523/JNEUROSCI.1633-18.2019. Epub 2019 Feb 15. J Neurosci. 2019. PMID: 30770401 Free PMC article.
-
Cortical nociceptive processes are reduced by visual alpha-band entrainment in the human brain.Eur J Pain. 2018 Mar;22(3):538-550. doi: 10.1002/ejp.1136. Epub 2017 Nov 14. Eur J Pain. 2018. PMID: 29139226
Cited by
-
Pretraining alpha rhythm enhancement by neurofeedback facilitates short-term perceptual learning and improves visual acuity by facilitated consolidation.Front Neuroergon. 2024 Jun 4;5:1399578. doi: 10.3389/fnrgo.2024.1399578. eCollection 2024. Front Neuroergon. 2024. PMID: 38894852 Free PMC article.
-
A randomized controlled trial of alpha phase-locked auditory stimulation to treat symptoms of sleep onset insomnia.Sci Rep. 2024 Jun 6;14(1):13039. doi: 10.1038/s41598-024-63385-1. Sci Rep. 2024. PMID: 38844793 Free PMC article. Clinical Trial.
-
Enhancing visual perceptual learning using transcranial electrical stimulation: Transcranial alternating current stimulation outperforms both transcranial direct current and random noise stimulation.J Vis. 2023 Dec 4;23(14):2. doi: 10.1167/jov.23.14.2. J Vis. 2023. PMID: 38054934 Free PMC article.
References
Publication types
MeSH terms
Grants and funding
- BB/E012604/1/BB_/Biotechnology and Biological Sciences Research Council/United Kingdom
- MC_UU_00030/15/MRC_/Medical Research Council/United Kingdom
- H012508/BB_/Biotechnology and Biological Sciences Research Council/United Kingdom
- BB/H012508/1/BB_/Biotechnology and Biological Sciences Research Council/United Kingdom
- 205067/Z/16/Z/WT_/Wellcome Trust/United Kingdom
LinkOut - more resources
Full Text Sources
