

Diffusion weighted hyperpolarized 129 Xe MRI of the lung with 2D and 3D (FLORET) spiral
- PMID: 36352793
- PMCID: PMC9892235
- DOI: 10.1002/mrm.29518
Diffusion weighted hyperpolarized 129 Xe MRI of the lung with 2D and 3D (FLORET) spiral
Abstract
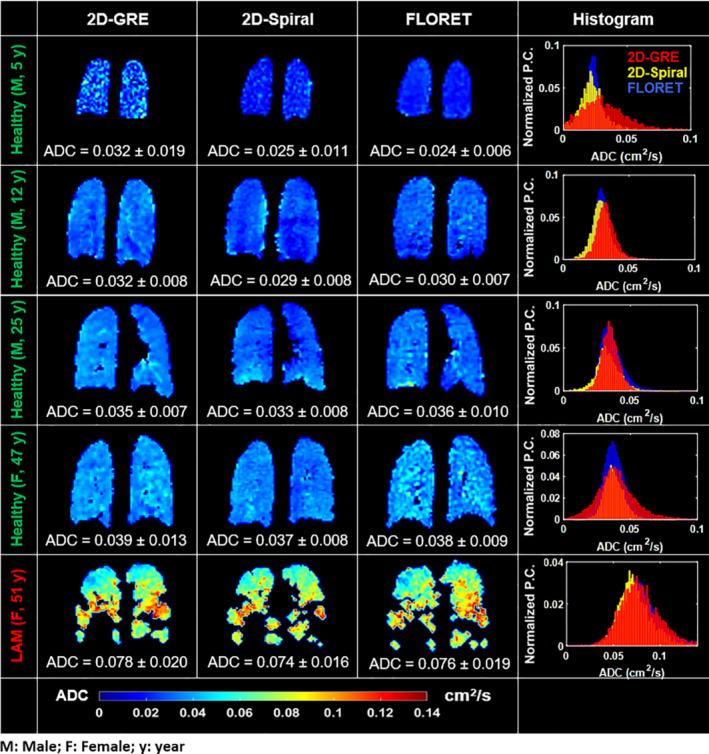
Purpose: To enable efficient hyperpolarized 129 Xe diffusion imaging using 2D and 3D (Fermat Looped, ORthogonally Encoded Trajectories, FLORET) spiral sequences and demonstrate that 129 Xe ADCs obtained using these sequences are comparable to those obtained using a conventional, 2D gradient-recalled echo (GRE) sequence.
Theory and methods: Diffusion-weighted 129 Xe MRI (b-values = 0, 7.5, 15 s/cm2 ) was performed in four healthy volunteers and one subject with lymphangioleiomyomatosis using slice-selective 2D-GRE (scan time = 15 s), slice-selective 2D-Spiral (4 s), and 3D-FLORET (16 s) sequences. Experimental SNRs from b-value = 0 images ( ) and mean ADC values were compared across sequences. In two healthy subjects, a second b = 0 image was acquired using the 2D-Spiral sequence to map flip angle and correct RF-induced, hyperpolarized signal decay at the voxel level, thus improving regional ADC estimates.
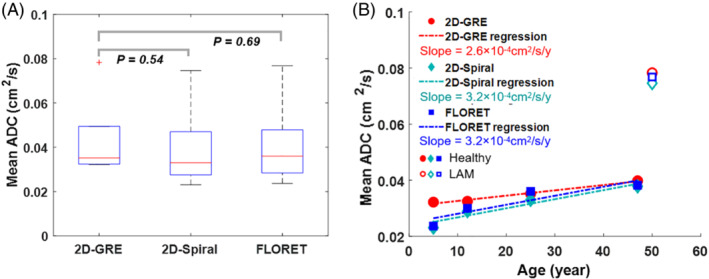
Results: Diffusion-weighted images from spiral sequences displayed image quality comparable to 2D-GRE and produced sufficient (16.8 ± 3.8 for 2D-GRE, 21.2 ± 3.5 for 2D-Spiral, 20.4 ± 3.5 for FLORET) to accurately calculate ADC. Whole-lung means and SDs of ADC obtained via spiral were not significantly different (P > 0.54) from those obtained via 2D-GRE. Finally, 2D-Spiral images were corrected for signal decay, which resulted in a whole-lung mean ADC decrease of ˜15%, relative to uncorrected images.
Conclusions: Relative to GRE, efficient spiral sequences allow 129 Xe diffusion images to be acquired with isotropic lung coverage (3D), higher (2D and 3D), and three-fold faster (2D) within a single breath-hold. In turn, shortened breath-holds enable flip-angle mapping, and thus, allow RF-induced signal decay to be corrected, increasing ADC accuracy.
Keywords: ADC; FLORET; GRE; diffusion; hyperpolarized 129Xe; spiral.
© 2022 The Authors. Magnetic Resonance in Medicine published by Wiley Periodicals LLC on behalf of International Society for Magnetic Resonance in Medicine.
Figures


Similar articles
-
Improved pulmonary 129 Xe ventilation imaging via 3D-spiral UTE MRI.Magn Reson Med. 2020 Jul;84(1):312-320. doi: 10.1002/mrm.28114. Epub 2019 Dec 1. Magn Reson Med. 2020. PMID: 31788858 Free PMC article.
-
B1 and magnetization decay correction for hyperpolarized 129 Xe lung imaging using sequential 2D spiral acquisitions.Magn Reson Med. 2023 Aug;90(2):473-482. doi: 10.1002/mrm.29655. Epub 2023 Mar 29. Magn Reson Med. 2023. PMID: 36989185 Free PMC article.
-
Hyperpolarized 129Xe diffusion-weighted MRI of the lung with 3D golden-angle radial sampling and keyhole reconstruction.Med Phys. 2025 Jun;52(6):4068-4078. doi: 10.1002/mp.17719. Epub 2025 Feb 27. Med Phys. 2025. PMID: 40016998
-
A 3D stack-of-spirals approach for rapid hyperpolarized 129 Xe ventilation mapping in pediatric cystic fibrosis lung disease.Magn Reson Med. 2023 Mar;89(3):1083-1091. doi: 10.1002/mrm.29505. Epub 2022 Nov 25. Magn Reson Med. 2023. PMID: 36433705
-
Improving hyperpolarized 129 Xe ADC mapping in pediatric and adult lungs with uncertainty propagation.NMR Biomed. 2022 Mar;35(3):e4639. doi: 10.1002/nbm.4639. Epub 2021 Nov 2. NMR Biomed. 2022. PMID: 34729838 Free PMC article.
Cited by
-
Improved Diffusion-Weighted Hyperpolarized 129Xe Lung MRI with Patch-Based Higher-Order, Singular Value Decomposition Denoising.Acad Radiol. 2024 Dec;31(12):5289-5299. doi: 10.1016/j.acra.2024.06.029. Epub 2024 Jul 3. Acad Radiol. 2024. PMID: 38960843
-
Comparative evaluation of supervised and unsupervised deep learning strategies for denoising hyperpolarized 129Xe lung MRI.Magn Reson Med. 2025 Aug 14:10.1002/mrm.70033. doi: 10.1002/mrm.70033. Online ahead of print. Magn Reson Med. 2025. PMID: 40810302 Free PMC article.
-
Hyperpolarized Xenon-129 Chemical Exchange Saturation Transfer (HyperCEST) Molecular Imaging: Achievements and Future Challenges.Int J Mol Sci. 2024 Feb 5;25(3):1939. doi: 10.3390/ijms25031939. Int J Mol Sci. 2024. PMID: 38339217 Free PMC article. Review.
-
Quantifying Spatial Distribution of Ventilation Defects in Multiple Pulmonary Diseases With Hyperpolarized 129Xenon MRI.J Magn Reson Imaging. 2025 Apr;61(4):1860-1873. doi: 10.1002/jmri.29627. Epub 2024 Oct 22. J Magn Reson Imaging. 2025. PMID: 39434582 Free PMC article.
-
Quantifying abnormal alveolar microstructure in cystic fibrosis lung disease via hyperpolarized 129Xe diffusion MRI.J Cyst Fibros. 2024 Sep;23(5):926-935. doi: 10.1016/j.jcf.2024.07.002. Epub 2024 Jul 14. J Cyst Fibros. 2024. PMID: 38997823 Free PMC article.
References
-
- Ruppert K. Biomedical imaging with hyperpolarized noble gases. Rep Prog Phys. 2014;77:116701. - PubMed
-
- Walkup LL, Woods JC. Translational applications of hyperpolarized 3He and 129Xe. NMR Biomed. 2014;27:1429‐1438. - PubMed
-
- Salerno M, Altes TA, Mugler JP III, Nakatsu M, Hatabu H, de Lange EE. Hyperpolarized noble gas MR imaging of the lung: potential clinical applications. Eur J Radiol. 2001;40:33‐44. - PubMed
Publication types
MeSH terms
Grants and funding
LinkOut - more resources
Full Text Sources
Medical
