Unsupervised clustering algorithms improve the reproducibility of dynamic contrast-enhanced magnetic resonance imaging pulmonary perfusion quantification in muco-obstructive lung diseases
- PMID: 36353218
- PMCID: PMC9637664
- DOI: 10.3389/fmed.2022.1022981
Unsupervised clustering algorithms improve the reproducibility of dynamic contrast-enhanced magnetic resonance imaging pulmonary perfusion quantification in muco-obstructive lung diseases
Abstract
Background: Dynamic contrast-enhanced magnetic resonance imaging (DCE-MRI) allows the assessment of pulmonary perfusion, which may play a key role in the development of muco-obstructive lung disease. One problem with quantifying pulmonary perfusion is the high variability of metrics. Quantifying the extent of abnormalities using unsupervised clustering algorithms in residue function maps leads to intrinsic normalization and could reduce variability.
Purpose: We investigated the reproducibility of perfusion defects in percent (QDP) in clinically stable patients with cystic fibrosis (CF) and chronic obstructive pulmonary disease (COPD).
Methods: 15 CF (29.3 ± 9.3y, FEV1%predicted = 66.6 ± 15.8%) and 20 COPD (66.5 ± 8.9y, FEV1%predicted = 42.0 ± 13.3%) patients underwent DCE-MRI twice 1 month apart. QDP, pulmonary blood flow (PBF), and pulmonary blood volume (PBV) were computed from residue function maps using an in-house quantification pipeline. A previously validated MRI perfusion score was visually assessed by an expert reader.
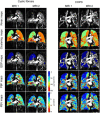
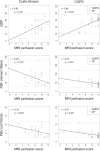
Results: Overall, mean QDP, PBF, and PBV did not change within 1 month, except for QDP in COPD (p < 0.05). We observed smaller limits of agreement (± 1.96 SD) related to the median for QDP (CF: ± 38%, COPD: ± 37%) compared to PBF (CF: ± 89%, COPD: ± 55%) and PBV (CF: ± 55%, COPD: ± 51%). QDP correlated moderately with the MRI perfusion score in CF (r = 0.46, p < 0.05) and COPD (r = 0.66, p < 0.001). PBF and PBV correlated poorly with the MRI perfusion score in CF (r =-0.29, p = 0.132 and r =-0.35, p = 0.067, respectively) and moderately in COPD (r =-0.57 and r =-0.57, p < 0.001, respectively).
Conclusion: In patients with muco-obstructive lung diseases, QDP was more robust and showed a higher correlation with the MRI perfusion score compared to the traditionally used perfusion metrics PBF and PBV.
Keywords: chronic obstructive pulmonary disease (COPD); contrast agent lung perfusion; cystic fibrosis (CF); functional imaging; muco-obstructive lung disease.
Copyright © 2022 Konietzke, Triphan, Eichinger, Bossert, Heller, Wege, Eberhardt, Puderbach, Kauczor, Heußel, Heußel, Risse and Wielpütz.
Conflict of interest statement
Authors MW, H-UK, and CH declared advisory board membership with Boehringer Ingelheim unrelated to the present study. Authors MK, SB, HH, and FR were employed by the Boehringer Ingelheim. The remaining authors declare that the research was conducted in the absence of any commercial or financial relationships that could be construed as a potential conflict of interest.
Figures


Similar articles
-
Quantification of pulmonary perfusion abnormalities using DCE-MRI in COPD: comparison with quantitative CT and pulmonary function.Eur Radiol. 2022 Mar;32(3):1879-1890. doi: 10.1007/s00330-021-08229-6. Epub 2021 Sep 22. Eur Radiol. 2022. PMID: 34553255 Free PMC article.
-
Comparison of quantitative regional perfusion-weighted phase resolved functional lung (PREFUL) MRI with dynamic gadolinium-enhanced regional pulmonary perfusion MRI in COPD patients.J Magn Reson Imaging. 2019 Apr;49(4):1122-1132. doi: 10.1002/jmri.26342. Epub 2018 Oct 22. J Magn Reson Imaging. 2019. PMID: 30350440
-
Validation of Automated Perfusion-Weighted Phase-Resolved Functional Lung (PREFUL)-MRI in Patients With Pulmonary Diseases.J Magn Reson Imaging. 2020 Jul;52(1):103-114. doi: 10.1002/jmri.27027. Epub 2019 Dec 24. J Magn Reson Imaging. 2020. PMID: 31872556
-
Magnetic Resonance Imaging of Lung Perfusion.J Magn Reson Imaging. 2024 Mar;59(3):784-796. doi: 10.1002/jmri.28912. Epub 2023 Jul 19. J Magn Reson Imaging. 2024. PMID: 37466278 Review.
-
Imaging human lung perfusion with contrast media: A meta-analysis.Eur J Radiol. 2023 Jul;164:110850. doi: 10.1016/j.ejrad.2023.110850. Epub 2023 Apr 27. Eur J Radiol. 2023. PMID: 37178490
Cited by
-
Supervised and unsupervised learning for lung perfusion data segmentation in electrical impedance tomography.Biomed Phys Eng Express. 2025 Jun 13;11(4):10.1088/2057-1976/ade158. doi: 10.1088/2057-1976/ade158. Biomed Phys Eng Express. 2025. PMID: 40472859
-
Echo time-dependent observed T1 and quantitative perfusion in chronic obstructive pulmonary disease using magnetic resonance imaging.Front Med (Lausanne). 2024 Jan 5;10:1254003. doi: 10.3389/fmed.2023.1254003. eCollection 2023. Front Med (Lausanne). 2024. PMID: 38249975 Free PMC article.
References
-
- Wielpütz MO, Puderbach M, Kopp-Schneider A, Stahl M, Fritzsching E, Sommerburg O, et al. Magnetic resonance imaging detects changes in structure and perfusion, and response to therapy in early cystic fibrosis lung disease. Am J Respir Crit Care Med. (2014) 189:956–65. 10.1164/rccm.201309-1659oc - DOI - PubMed
LinkOut - more resources
Full Text Sources

