. 2022 Oct 24:13:1029409.
doi: 10.3389/fmicb.2022.1029409. eCollection 2022.

Effects of Danggui Buxue decoction on host gut microbiota and metabolism in GK rats with type 2 diabetes

Affiliations

Effects of Danggui Buxue decoction on host gut microbiota and metabolism in GK rats with type 2 diabetes

Wen-Kai Wang et al. Front Microbiol. .

Abstract

Type 2 diabetes mellitus (T2DM) is a chronic metabolic disorder characterized by persistent abnormally elevated blood sugar levels. T2DM affects millions of people and exerts a significant global public health burden. Danggui Buxue decoction (DBD), a classical Chinese herbal formula composed of Astragalus membranaceus (Huangqi) and Angelica sinensis (Danggui), has been widely used in the clinical treatment of diabetes and its complications. However, the effect of DBD on the gut microbiota of individuals with diabetes and its metabolism are still poorly understood. In this study, a T2DM model was established in Goto-Kakizaki (GK) rats, which were then treated with a clinical dose of DBD (4 g/kg) through tube feeding for 6 weeks. Next, we used 16S rRNA sequencing and untargeted metabolomics by liquid chromatography with mass spectrometry (LC-MS) to detect changes in the composition of the microbiota and cecal metabolic products. Our data show that DBD mediates the continuous increase in blood glucose in GK rats, improves insulin sensitivity, reduces expression of inflammatory mediators, and improves systemic oxidative stress. Moreover, DBD also improves microbial diversity (e.g., Romboutsia, Firmicutes, and Bacilli) in the intestines of rats with T2DM. Further, DBD intervention also regulates various metabolic pathways in the gut microbiota, including alanine, aspartate, and glutamate metabolism. In addition, arginine biosynthesis and the isoflavone biosynthesis may be a unique mechanism by which DBD exerts its effects. Taken together, we show that DBD is a promising therapeutic agent that can restore the imbalance found in the gut microbiota of T2DM rats. DBD may modify metabolites in the microbiota to realize its antidiabetic and anti-inflammatory effects.

Keywords: Danggui Buxue decoction; gut microbiota; inflammation; isoflavone; metabolism; oxidative stress; traditional Chinese medicine; type 2 diabetes mellitus.


Conflict of interest statement

The authors declare that the research was conducted in the absence of any commercial or financial relationships that could be construed as a potential conflict of interest.

Figures

Figure 1
Figure 1
Chromatograms of representative components in DBD. (A) Chromatogram of standard mixture of 5 ingredients. (B) Chromatogram of DBD. Observation wavelength (λ) = 290 nm.
Figure 2
Figure 2
The effects of DBD on the blood sugar, insulin, serum oxidative stress, and inflammation cytokine. (A) Random blood sugar of rats at 6 weeks. (B) Concentration of the fasting blood-glucose. (C) Concentration of the blood serum insulin. (D) Levels of HOMA-IR. (E) Levels of HOMA-IS. (F) Concentration of the blood serum MDA. (G) Concentration of the SOD. (H) Levels of ROS. (I) Concentration of the inflammatory cytokine TNF-α. (J) Concentration of IL-6. (K) Concentration of the IL-1β. (L) Concentration of IL-18. Data are presented as MEAN values ± SD, n = 6. Statistical analysis was done by student’s t test. Compared to control group ##p < 0.01, ###p ≤ 0.005, ####p ≤ 0.001; compared to model group *p < 0.05, **p ≤ 0.01, ***p ≤ 0.005, ****p ≤ 0.001.
Figure 3
Figure 3
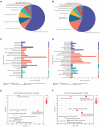
Multivariate statistical analysis of the LC–MS spectra of rat cecal contents taken from the three groups (n = 6). (A) PCA score map of the three groups in the negative ion model. (B) PCA score map of three groups in the positive ion model. (C) OPLS-DA score map of control vs. model group in the negative ion model. (D) OPLS-DA score map of control vs. model group in the negative ion model. (E) OPLS-DA score map of control vs. model group in the negative ion model. (F) OPLS-DA score map of control vs. model group in the negative ion model. (G) Differential volcanic map of control vs. model group. (H) Differential volcanic map of model vs. DBD group.
Figure 4
Figure 4
Summary of differential metabolite classification and related pathway analysis. (A) Classification of differential metabolite between control and model group in Superclass of HMDB level. (B) Classification of differential metabolite between model and DBD group in Superclass of HMDB level. (C) Numbers of differential metabolite in different KEGG pathways between control and model group. (D) Numbers of differential metabolite in different KEGG pathways between model and DBD group. (E) KEGG topology analysis bubble plot between control and model group. (F) KEGG topology analysis bubble plot between model and DBD group. Each bubble in the Figure represents a KEGG pathway. The horizontal axis represents the impact value of metabolites in the pathway and the vertical axis represents the enrichment significance of metabolites in the pathway -Log 10 (p value). Bubble size represents impact value and the larger the bubble, the more important the pathway is.
Figure 5
Figure 5
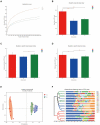
Effects of DBD on the structure and abundance of gut microbiota in T2DM rats. (A) Rarefaction curves of 3 group samples. (B–D) Alpha diversity is presented by the box plots of Sobs, Shannon, and Shannoneven. (E) Principal coordinate analysis (PCoA) plot of the gut microbiota based on Bray–Curtis metrics. (F) Hierarchical clustering based on Bray–Curtis distance matrix (C, control; M, model, D-DBD).
Figure 6
Figure 6
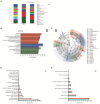
Microbiome analysis of the intestinal contents samples. (A) Relative abundance of the gut microbiota at the genus levels. (B,C) Histogram and evolutionary branch diagram of LDA distribution between feces in 3 groups. (D,E) The proportion of gut microbes in different KEGG pathways with significant differences between the two groups.
Figure 7
Figure 7
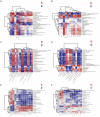
Heatmap of relationships between biochemical indexes, metabolites, and gut microbiota. (A) Relationship between biological indicators and the top 30 differential metabolites in control and model group. (B) Relationship between biological indicators and the top 30 differential metabolites in model and DBD group. (C) Relationship between top 15 differential gut microbiota and the top 30 differential metabolites in control and model group. (D) Relationship between top 15 differential gut microbiota and the top 30 differential metabolites in model and DBD group. (E) Relationship between biological indicators and the top 15 differential gut microbiota in control and model group. (F) Relationship between biological indicators and the top 15 differential gut microbiota in model and DBD group.

Similar articles

Cited by

References

    1. Adak A., Khan M. R. (2019). An insight into gut microbiota and its functionalities. Cell. Mol. Life Sci. 76, 473–493. doi: 10.1007/s00018-018-2943-4, PMID: - DOI - PMC - PubMed
    1. Ceriello A. (2020). Is it time to ban sulfonylureas? J. Diabetes 12, 848–850. doi: 10.1111/1753-0407.13095, PMID: - DOI - PubMed
    1. Chakraborty D., Gupta K., Biswas S. (2021). A mechanistic insight of phytoestrogens used for rheumatoid arthritis: An evidence-based review. Biomed. Pharmacother. 133:111039. doi: 10.1016/j.biopha.2020.111039, PMID: - DOI - PubMed
    1. Chatterjee S., Khunti K., Davies M. J. (2017). Type 2 diabetes. Lancet 389, 2239–2251. doi: 10.1016/S0140-6736(17)30058-2 - DOI - PubMed
    1. Chen Z., Radjabzadeh D., Chen L., Kurilshikov A., Kavousi M., Ahmadizar F., et al. (2021). Association of Insulin Resistance and Type 2 diabetes with gut microbial diversity: a microbiome-wide analysis from population studies. JAMA Netw. Open 4:e2118811. doi: 10.1001/jamanetworkopen.2021.18811, PMID: - DOI - PMC - PubMed

LinkOut - more resources