Proteomics unveil a central role for peroxisomes in butyrate assimilation of the heterotrophic Chlorophyte alga Polytomella sp
- PMID: 36353459
- PMCID: PMC9637915
- DOI: 10.3389/fmicb.2022.1029828
Proteomics unveil a central role for peroxisomes in butyrate assimilation of the heterotrophic Chlorophyte alga Polytomella sp
Abstract
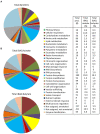
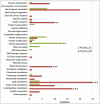
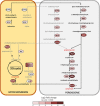
Volatile fatty acids found in effluents of the dark fermentation of biowastes can be used for mixotrophic growth of microalgae, improving productivity and reducing the cost of the feedstock. Microalgae can use the acetate in the effluents very well, but butyrate is poorly assimilated and can inhibit growth above 1 gC.L-1. The non-photosynthetic chlorophyte alga Polytomella sp. SAG 198.80 was found to be able to assimilate butyrate fast. To decipher the metabolic pathways implicated in butyrate assimilation, quantitative proteomics study was developed comparing Polytomella sp. cells grown on acetate and butyrate at 1 gC.L-1. After statistical analysis, a total of 1772 proteins were retained, of which 119 proteins were found to be overaccumulated on butyrate vs. only 46 on acetate, indicating that butyrate assimilation necessitates additional metabolic steps. The data show that butyrate assimilation occurs in the peroxisome via the β-oxidation pathway to produce acetyl-CoA and further tri/dicarboxylic acids in the glyoxylate cycle. Concomitantly, reactive oxygen species defense enzymes as well as the branched amino acid degradation pathway were strongly induced. Although no clear dedicated butyrate transport mechanism could be inferred, several membrane transporters induced on butyrate are identified as potential condidates. Metabolic responses correspond globally to the increased needs for central cofactors NAD, ATP and CoA, especially in the peroxisome and the cytosol.
Keywords: heterotrophy; metabolic pathways; microalgae; quantitative proteomics; volatile fatty acids.
Copyright © 2022 Lacroux, Atteia, Brugière, Couté, Vallon, Steyer and van Lis.
Conflict of interest statement
The authors declare that the research was conducted in the absence of any commercial or financial relationships that could be construed as a potential conflict of interest.
Figures


Similar articles
-
New perspectives on butyrate assimilation in Rhodospirillum rubrum S1H under photoheterotrophic conditions.BMC Microbiol. 2020 May 20;20(1):126. doi: 10.1186/s12866-020-01814-7. BMC Microbiol. 2020. PMID: 32434546 Free PMC article.
-
Phylogenetic and functional diversity of aldehyde-alcohol dehydrogenases in microalgae.Plant Mol Biol. 2021 Mar;105(4-5):497-511. doi: 10.1007/s11103-020-01105-9. Epub 2021 Jan 7. Plant Mol Biol. 2021. PMID: 33415608
-
Diverse acidogenic effluents as feedstock for microalgae cultivation: Dual phase metabolic transition on biomass growth and lipid synthesis.Bioresour Technol. 2017 Oct;242:191-196. doi: 10.1016/j.biortech.2017.04.059. Epub 2017 Apr 20. Bioresour Technol. 2017. PMID: 28502573
-
Lipid catabolism in microalgae.New Phytol. 2018 Jun;218(4):1340-1348. doi: 10.1111/nph.15047. Epub 2018 Feb 23. New Phytol. 2018. PMID: 29473650 Review.
-
[The different notions about beta-oxidation of fatty acids in peroxisomes, peroxisomes and ketonic bodies. The diabetic, acidotic coma as an acute deficiency of acetyl-CoA and ATP].Klin Lab Diagn. 2014 Mar;(3):14-23. Klin Lab Diagn. 2014. PMID: 25080783 Review. Russian.
Cited by
-
Effect of Dietary Benzoic Acid Supplementation on Growth Performance, Rumen Fermentation, and Rumen Microbiota in Weaned Holstein Dairy Calves.Animals (Basel). 2024 Sep 30;14(19):2823. doi: 10.3390/ani14192823. Animals (Basel). 2024. PMID: 39409772 Free PMC article.
-
Combined Effects of Marine Heatwaves and Light Intensity on the Physiological, Transcriptomic, and Metabolomic Profiles of Undaria pinnatifida.Plants (Basel). 2025 May 9;14(10):1419. doi: 10.3390/plants14101419. Plants (Basel). 2025. PMID: 40430984 Free PMC article.
References
-
- Acién Fernández F. G., Fernández Sevilla J. M., Molina Grima E. (2019). “Costs analysis of microalgae production,” in Biofuels from Algae. eds. Ashok P., Jo-Shu C., Carlos ol R., Lee D.-J., Chisti Y. (Amsterdam: Elsevier; ).
LinkOut - more resources
Full Text Sources
Miscellaneous

