

Long-term environmental exposure of darkness induces hyperandrogenism in PCOS via melatonin receptor 1A and aromatase reduction
- PMID: 36353509
- PMCID: PMC9639332
- DOI: 10.3389/fcell.2022.954186
Long-term environmental exposure of darkness induces hyperandrogenism in PCOS via melatonin receptor 1A and aromatase reduction
Abstract
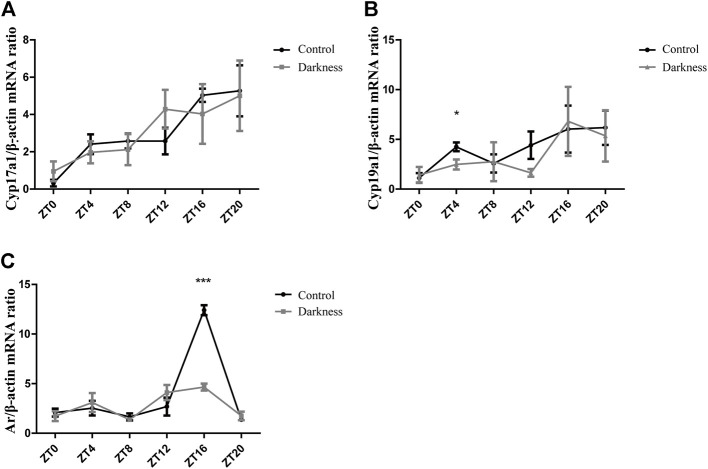
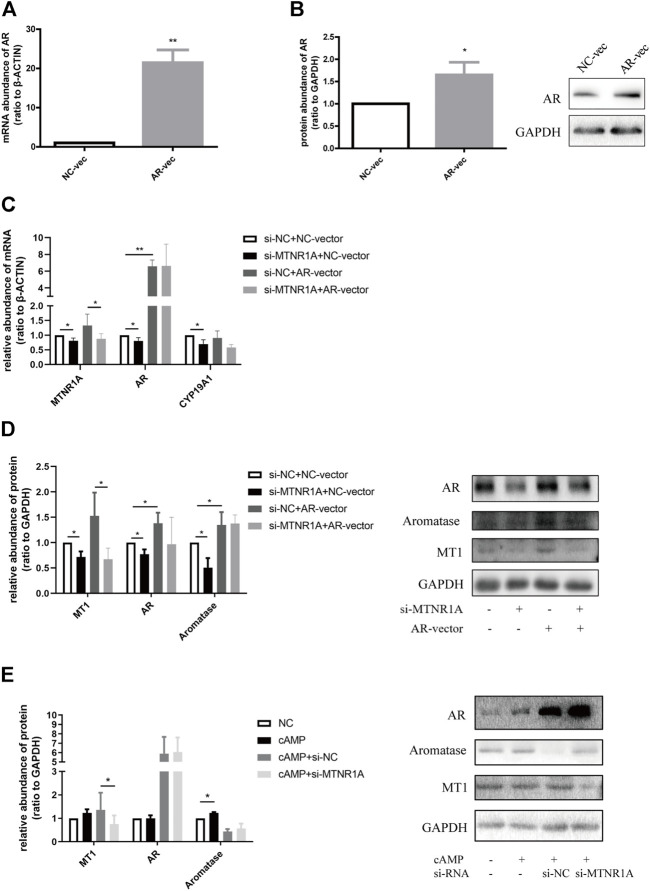
Polycystic ovary syndrome (PCOS) is a common and complex disorder impairing female fertility, yet its etiology remains elusive. It is reported that circadian rhythm disruption might play a crucial role in PCOS pathologic progression. Here, in this research, we investigated the effect of environmental long-term circadian rhythm dysfunction and clarified its pathogenic mechanism in the development of PCOS, which might provide the targeted clinical strategies to patients with PCOS. Female SD rats were used to construct a circadian rhythm misalignment model with constant darkness (12/12-h dark/dark cycle), and the control group was kept under normal circadian rhythm exposure (12/12-h light/dark cycle) for 8 weeks. We measured their reproductive, endocrinal, and metabolic profiles at different zeitgeber times (ZTs). Different rescue methods, including melatonin receptor agonist and normal circadian rhythm restoration, and in vitro experiments on the KGN cell line were performed. We found that long-term darkness caused PCOS-like reproductive abnormalities, including estrous cycle disorder, polycystic ovaries, LH elevation, hyperandrogenism, and glucose intolerance. In addition, the expression of melatonin receptor 1A (Mtnr1a) in ovarian granulosa cells significantly decreased in the darkness group. Normal light/dark cycle and melatonin receptor agonist application relieved hyperandrogenism of darkness-treated rats. In vitro experiments demonstrated that decreased MTNR1A inhibited androgen receptor (AR) and CYP19A1 expression, and AR acted as an essential downstream factor of MTNR1A in modulating aromatase abundance. Overall, our finding demonstrates the significant influence of circadian rhythms on PCOS occurrence, suggests that MTNR1A and AR play vital roles in pathological progression of hyperandrogenism, and broadens current treatment strategies for PCOS in clinical practice.
Keywords: androgen receptor; constant darkness; hyperandrogenism; melatonin receptor 1A; polycystic ovary syndrome.
Copyright © 2022 Chu, Li, Geng, Wang, Zhai, Lu, Chan, Chen and Du.
Conflict of interest statement
The authors declare that the research was conducted in the absence of any commercial or financial relationships that could be construed as a potential conflict of interest.
Figures


Similar articles
-
Altered circadian clock as a novel therapeutic target for constant darkness-induced insulin resistance and hyperandrogenism of polycystic ovary syndrome.Transl Res. 2020 May;219:13-29. doi: 10.1016/j.trsl.2020.02.003. Epub 2020 Feb 12. Transl Res. 2020. PMID: 32119846
-
Modulation of steroidogenesis by vitamin D3 in granulosa cells of the mouse model of polycystic ovarian syndrome.Syst Biol Reprod Med. 2017 Jun;63(3):150-161. doi: 10.1080/19396368.2017.1296046. Epub 2017 Mar 27. Syst Biol Reprod Med. 2017. PMID: 28345956
-
The melatonin receptor genes are linked and associated with the risk of polycystic ovary syndrome.J Ovarian Res. 2024 Jan 13;17(1):17. doi: 10.1186/s13048-024-01343-1. J Ovarian Res. 2024. PMID: 38217063 Free PMC article.
-
The role of melatonin in polycystic ovary syndrome: A review.Int J Reprod Biomed. 2019 Dec 30;17(12):865-882. doi: 10.18502/ijrm.v17i12.5789. eCollection 2019 Dec. Int J Reprod Biomed. 2019. PMID: 31970309 Free PMC article. Review.
-
Adipocyte and steroidogenic cell cross-talk in polycystic ovary syndrome.Hum Reprod Update. 2021 Jun 22;27(4):771-796. doi: 10.1093/humupd/dmab004. Hum Reprod Update. 2021. PMID: 33764457 Review.
Cited by
-
Essential Role of Granulosa Cell Glucose and Lipid Metabolism on Oocytes and the Potential Metabolic Imbalance in Polycystic Ovary Syndrome.Int J Mol Sci. 2023 Nov 13;24(22):16247. doi: 10.3390/ijms242216247. Int J Mol Sci. 2023. PMID: 38003436 Free PMC article. Review.
-
Androgen excess: a hallmark of polycystic ovary syndrome.Front Endocrinol (Lausanne). 2023 Dec 13;14:1273542. doi: 10.3389/fendo.2023.1273542. eCollection 2023. Front Endocrinol (Lausanne). 2023. PMID: 38152131 Free PMC article. Review.
-
Signaling pathways and targeted therapeutic strategies for polycystic ovary syndrome.Front Endocrinol (Lausanne). 2023 Oct 19;14:1191759. doi: 10.3389/fendo.2023.1191759. eCollection 2023. Front Endocrinol (Lausanne). 2023. PMID: 37929034 Free PMC article. Review.
-
Exploring the potential association and experimental validation of disrupted circadian rhythms with polycystic ovary syndrome via meta-analysis and bioinformatics: a possible pathogenic mechanism.Front Endocrinol (Lausanne). 2025 May 22;16:1545789. doi: 10.3389/fendo.2025.1545789. eCollection 2025. Front Endocrinol (Lausanne). 2025. PMID: 40475989 Free PMC article.
-
Melatonin refines ovarian mitochondrial dysfunction in PCOS by regulating the circadian rhythm gene Clock.Cell Mol Life Sci. 2025 Mar 6;82(1):104. doi: 10.1007/s00018-025-05609-9. Cell Mol Life Sci. 2025. PMID: 40047877 Free PMC article.
References
-
- Ali A. T. (2015). Polycystic ovary syndrome and metabolic syndrome. Ceska Gynekol. 80, 279–289. - PubMed
LinkOut - more resources
Full Text Sources
Research Materials