. 2022 Oct 24:10:987740.
doi: 10.3389/fcell.2022.987740. eCollection 2022.

Transcriptomic analysis of the human placenta reveals trophoblast dysfunction and augmented Wnt signalling associated with spontaneous preterm birth

Affiliations

Transcriptomic analysis of the human placenta reveals trophoblast dysfunction and augmented Wnt signalling associated with spontaneous preterm birth

Khondoker M Akram et al. Front Cell Dev Biol. .

Abstract

Preterm birth (PTB) is the leading cause of death in under-five children. Worldwide, annually, over 15 million babies are born preterm and 1 million of them die. The triggers and mechanisms of spontaneous PTB remain largely unknown. Most current therapies are ineffective and there is a paucity of reliable predictive biomarkers. Understanding the molecular mechanisms of spontaneous PTB is crucial for developing better diagnostics and therapeutics. To address this need, we conducted RNA-seq transcriptomic analysis, qRT-PCR and ELISA on fresh placental villous tissue from 20 spontaneous preterm and 20 spontaneous term deliveries, to identify genes and signalling pathways involved in the pathogenesis of PTB. Our differential gene expression, gene ontology and pathway analysis revealed several dysregulated genes (including OCLN, OPTN, KRT7, WNT7A, RSPO4, BAMBI, NFATC4, SLC6A13, SLC6A17, SLC26A8 and KLF8) associated with altered trophoblast functions. We identified dysregulated Wnt, oxytocin and cellular senescence signalling pathways in preterm placentas, where augmented Wnt signalling could play a pivotal role in the pathogenesis of PTB due to its diverse biological functions. We also reported two novel targets (ITPR2 and MYLK2) in the oxytocin signalling pathways for further study. Through bioinformatics analysis on DEGs, we identified four key miRNAs, - miR-524-5p, miR-520d-5p, miR-15a-5p and miR-424-5p - which were significantly downregulated in preterm placentas. These miRNAs may have regulatory roles in the aberrant gene expressions that we have observed in preterm placentas. We provide fresh molecular insight into the pathogenesis of spontaneous PTB which may drive further studies to develop new predictive biomarkers and therapeutics.

Keywords: Wnt signalling; miRNAs; placenta; preterm birth; transcriptomic analysis; trophoblast dysfunction.


Conflict of interest statement

The authors declare that the research was conducted in the absence of any commercial or financial relationships that could be construed as a potential conflict of interest.

Figures
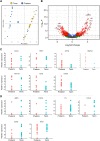
FIGURE 1
FIGURE 1
Differentially expressed genes (DEGs) in the placenta. (A). PCA plot shows separation of preterm and term gene clusters (n = 40). (B). The volcano plot shows the significant fold change differences between preterm and term placenta samples (n = 40, 20 term and 20 preterm). Each dot within the graph indicates an individual gene, with 564 downregulated genes on the left and 337 upregulated genes on the right. Significant DEGs are shown within the threshold lines on the graph. Genes observed Benjamini-Hochberg false-discovery rate (BH-FDR) < 0.05 and a fold change cut off ±1. (C, D). A selected panel of significantly upregulated (C) and downregulated (D) gene expression in RNA-seq data. Padj < 0.05 for all genes.
FIGURE 2
FIGURE 2
qRT-PCR validation of gene expression. Box plots show relative expression (relative to GAPDH) of a panel of genes, OCLN (A), RSPO4 (B), KRT7 (C) and ARF6 (D) in term and preterm placentas. Data are presented as median and interquartile ranges (IQR) with minima and maxima. n = 20 term and 20 preterm, *p < 0.05, Mann-Whitney U test.
FIGURE 3
FIGURE 3
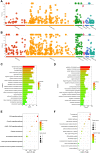
Gene ontology and signalling pathway analysis. (A,B). Manhattan plots showing enrichment of GO terms, KEGG signalling pathways, Reactome and miRNA targets by upregulated (A) and downregulated DEGs (B) (Padj < 0.05). (C,D). GO enrichment with upregulated (C) and downregulated DEGs (D) (Padj < 0.05). Selected top 20 GO terms are presented. (E,F). KEGG signalling pathway enrichment with upregulated (E) and downregulated DEGs (F) (Padj < 0.05).
FIGURE 4
FIGURE 4
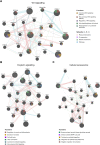
Gene interaction network analysis by Cytoscape plug-in GeneMANIA. Striped bigger nodes indicate genes identified by RNA-seq analysis. Five genes were input in the GeneMANIA to explore the interaction with other genes. Top 20 genes are shown in each network, Wnt signalling (A), Oxytocin signalling (B) and Cellular senescence. (C) Coloured edges and their connections with other genes indicate nature of interactions. Colour-codes inside each node indicates their biological function as stated in the legends.
FIGURE 5
FIGURE 5
ELISA assay showing WNT7A protein concentrations (ng/ml) in 300 μg/ml total protein in term and preterm placenta VT samples. Data are presented as mean ± standard deviation. Each dot represents protein concentration from an individual subject. n = 20 term and 20 preterm. p value was determined by Mann-Whitney U test.
FIGURE 6
FIGURE 6
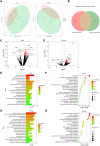
Sub-group gene expression and signalling pathway analysis on male and female placentas. (A). PCA plots showing separation of term and preterm samples in male and female placenta. (B). Venn diagram showing DEGs in male and female preterm placenta and common DEGs among both sexes. (C,D). Volcano plots showing DEGs in male (C) and female (D) preterm placentas. Horizontal and vertical dotted lines indicate thresholds Padj < 0.05 and Log2FC = +/−1. (E–H). GO and KEGG signalling pathways for male (E, F respectively) and female (G, H respectively) preterm placentas. n = 16 males and 12 females (1:1 term vs. preterm).
FIGURE 7
FIGURE 7
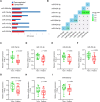
miRNAs expression in placenta. (A). Selected 7 miRNAs and their upregulated and downregulated DEG targets in the preterm placenta. (B). Jaccard index plot represents common genes targeted by selected miRNAs. Each block of colour represents the percentage of miRNAs having common gene targets. (C–I). qRT-PCR validation of selected 7 miRNAs in the term and preterm placentas. The box and whisker plots depict qPCR analysis showing miRNA expression relative to U6 snRNA in term and preterm placenta villous tissue. Each ‘dot’ indicates a mean value of a duplicate qPCR run from an independent subject (n = 20 term and 20 preterm). Data are presented as median and interquartile ranges (IQR) with minima and maxima. p values were determined by the Mann-Whitney U test.

References

    1. Afgan E., Baker D., Batut B., van den Beek M., Bouvier D., Cech M., et al. (2018). The Galaxy platform for accessible, reproducible and collaborative biomedical analyses: 2018 update. Nucleic Acids Res. 46 (1), W537–W544. 10.1093/nar/gky379 - DOI - PMC - PubMed
    1. Anton L., DeVine A., Sierra L. J., Brown A. G., Elovitz M. A. (2017). miR-143 and miR-145 disrupt the cervical epithelial barrier through dysregulation of cell adhesion, apoptosis and proliferation. Sci. Rep. 7 (1), 3020. 10.1038/s41598-017-03217-7 - DOI - PMC - PubMed
    1. Balda M. S., Whitney J. A., Flores C., González S., Cereijido M., Matter K. (1996). Functional dissociation of paracellular permeability and transepithelial electrical resistance and disruption of the apical-basolateral intramembrane diffusion barrier by expression of a mutant tight junction membrane protein. J. Cell Biol. 134 (4), 1031–1049. 10.1083/jcb.134.4.1031 - DOI - PMC - PubMed
    1. Bartel D. P. (2004). MicroRNAs: Genomics, biogenesis, mechanism, and function. Cell 116 (2), 281–297. 10.1016/s0092-8674(04)00045-5 - DOI - PubMed
    1. Behnia F., Taylor B. D., Woodson M., Kacerovsky M., Hawkins H., Fortunato S. J., et al. (2015). Chorioamniotic membrane senescence: A signal for parturition? Am. J. Obstet. Gynecol. 213 (3), 359.e351–16. 10.1016/j.ajog.2015.05.041 - DOI - PubMed