

Expression of basement membrane genes and their prognostic significance in clear cell renal cell carcinoma patients
- PMID: 36353536
- PMCID: PMC9637577
- DOI: 10.3389/fonc.2022.1026331
Expression of basement membrane genes and their prognostic significance in clear cell renal cell carcinoma patients
Abstract
Background: Clear cell renal cell carcinoma (ccRCC) is a malignant tumor with limited treatment options. A recent study confirmed the involvement of basement membrane (BM) genes in the progression of many cancers. Therefore, we studied the role and prognostic significance of BM genes in ccRCC.
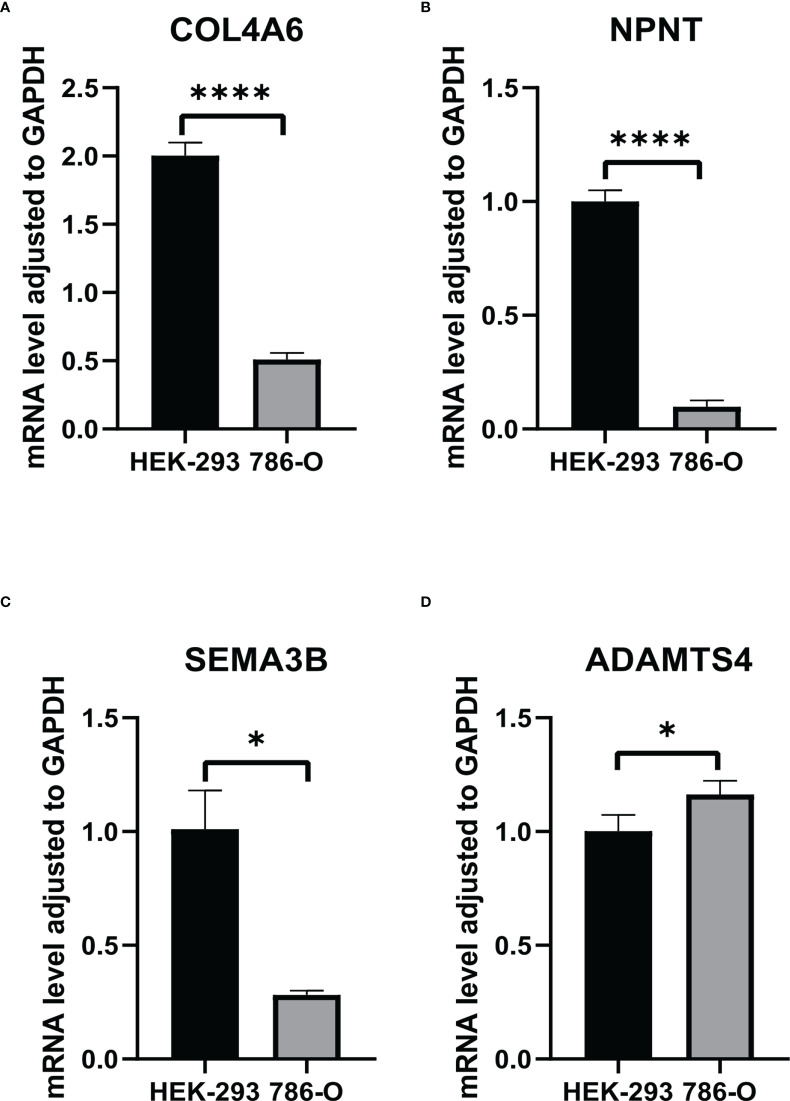
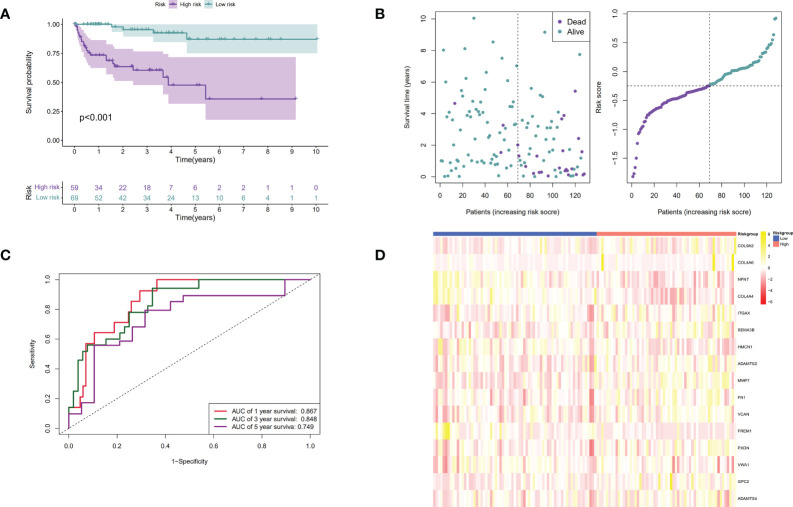
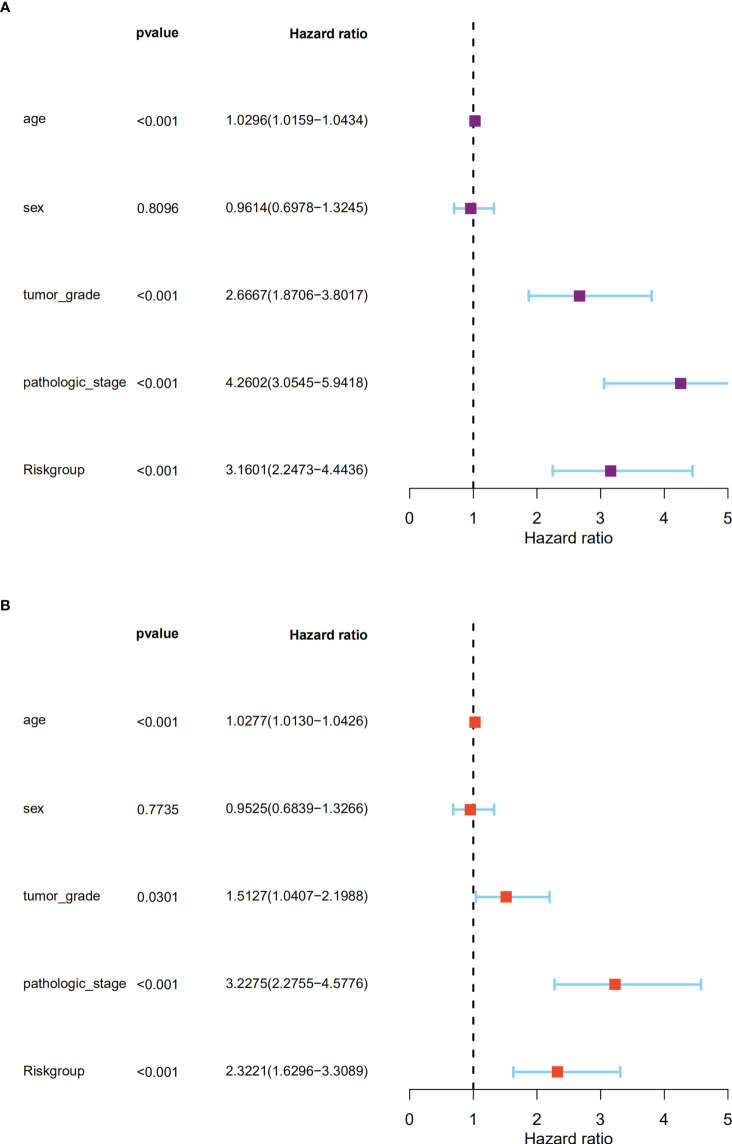
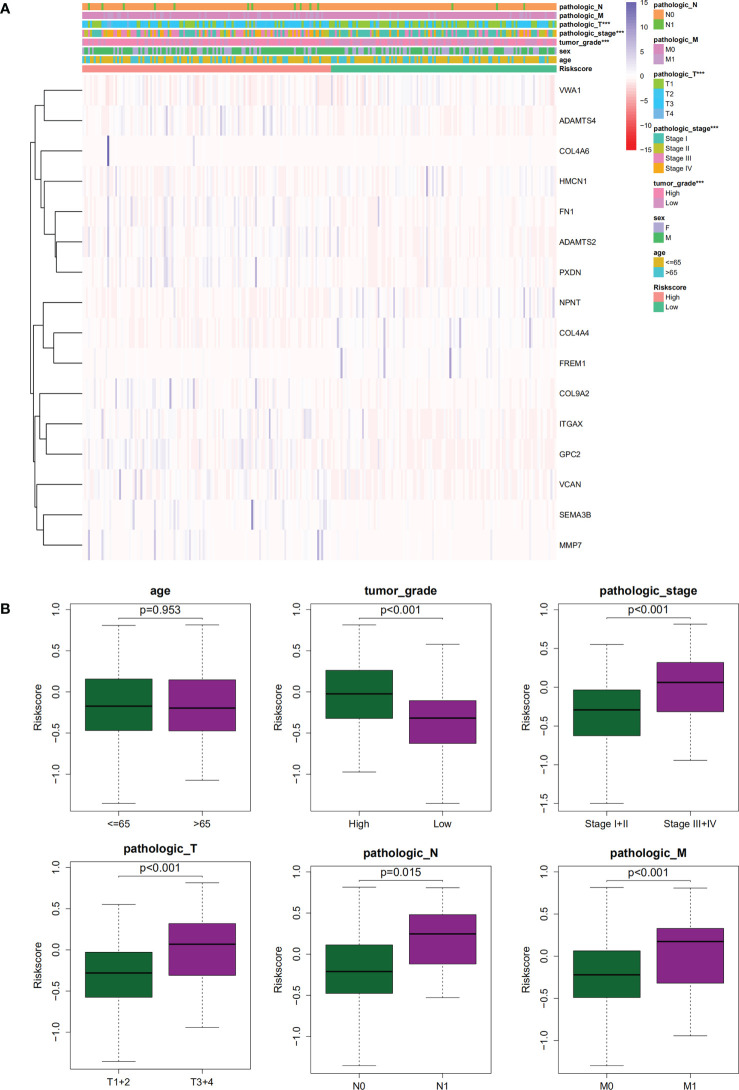
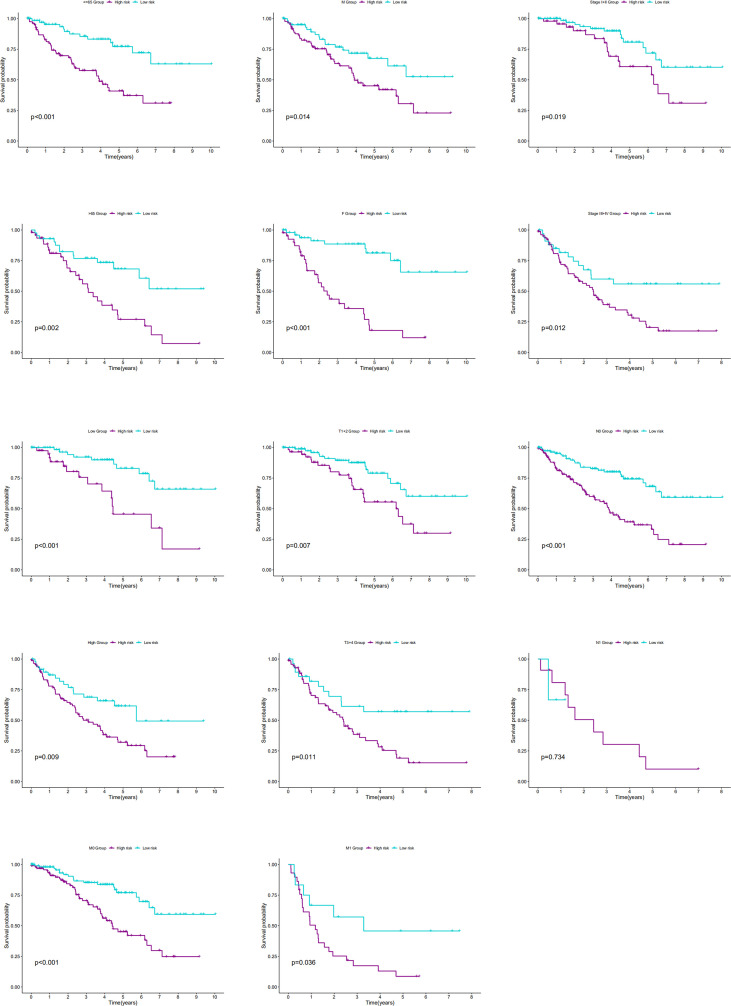
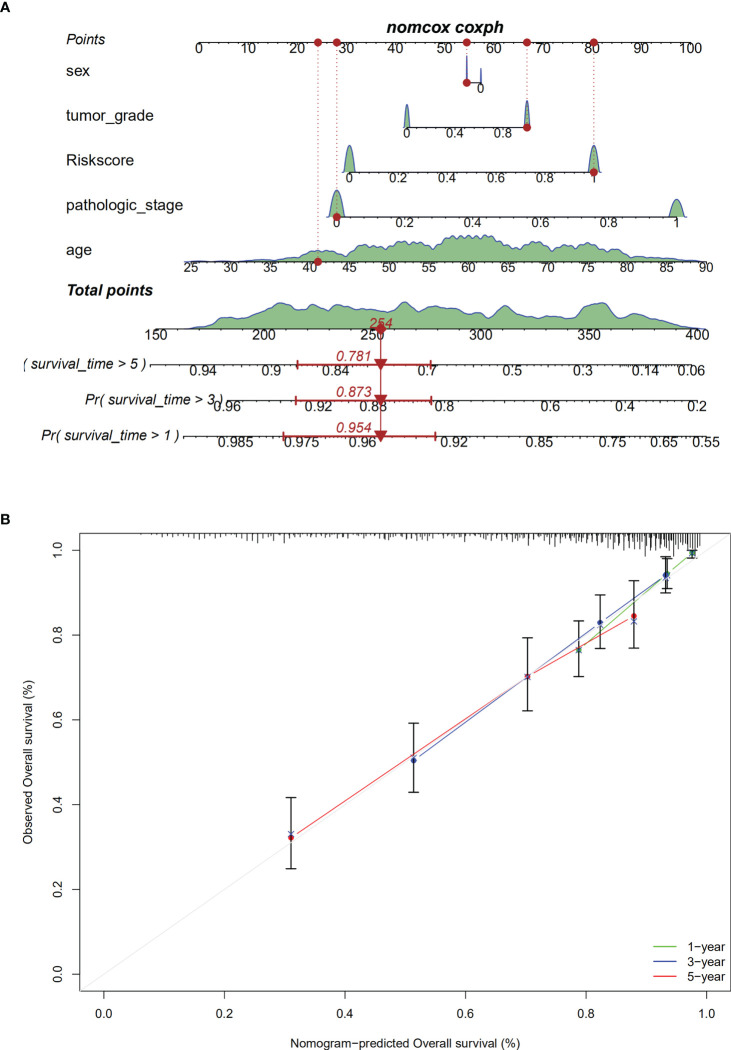
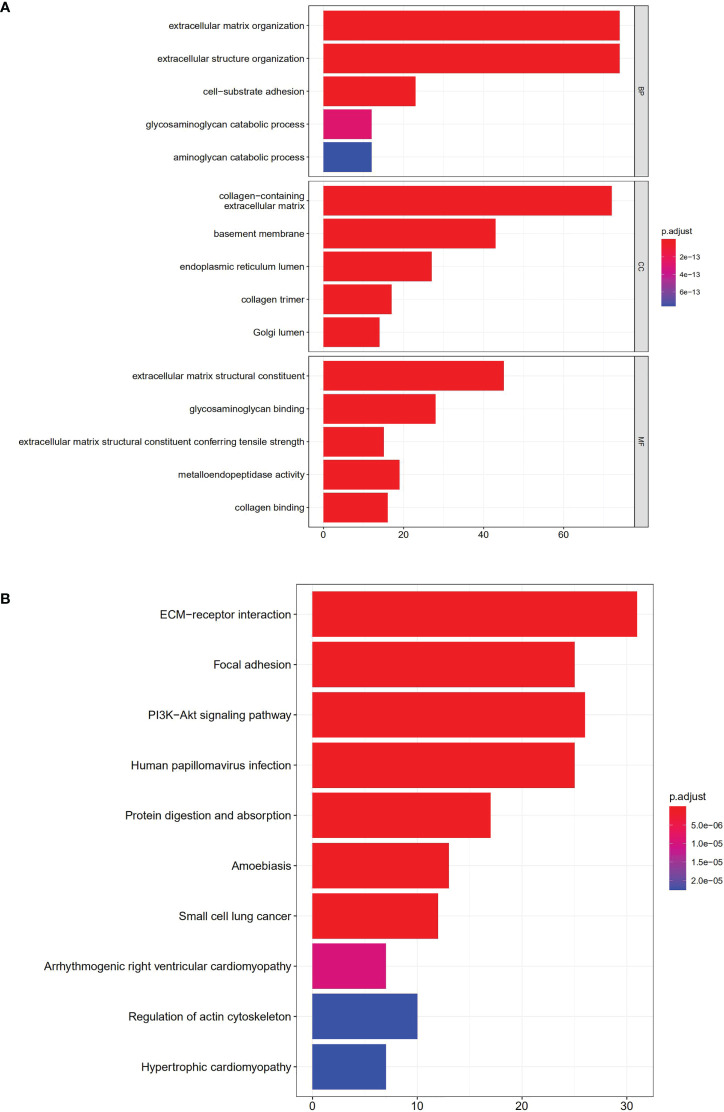
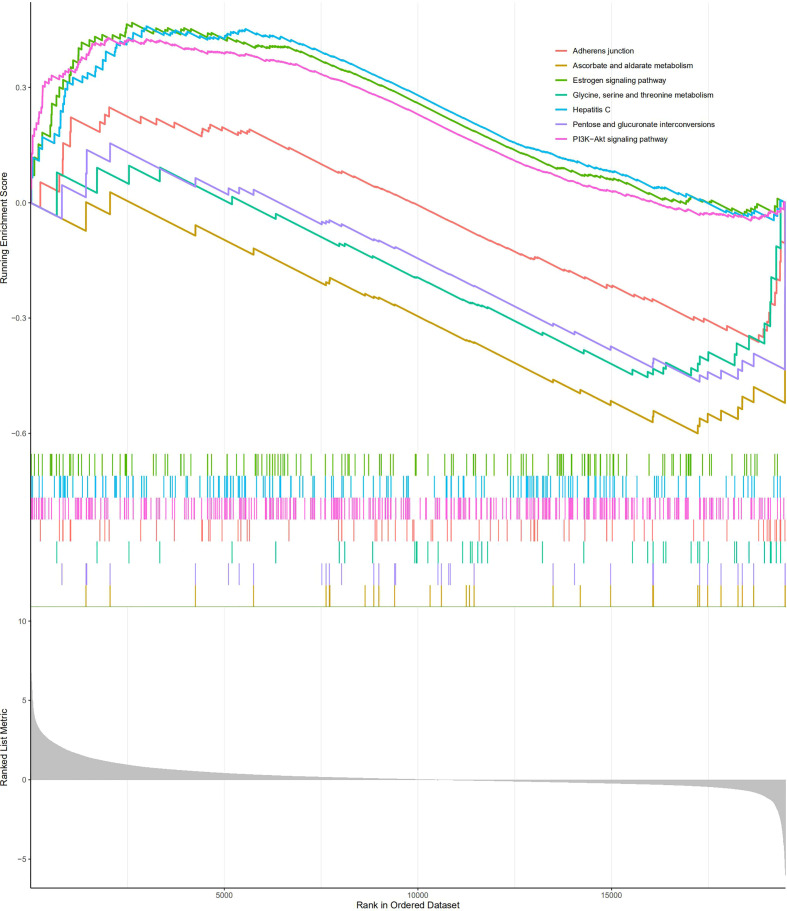
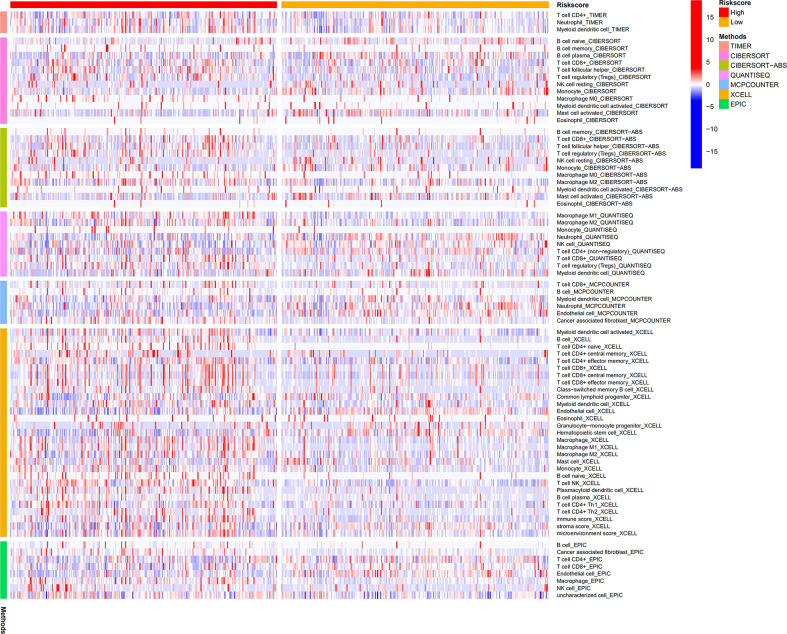
Methods: Co-expression analysis of ccRCC-related information deposited in The Cancer Genome Atlas database and a BM geneset from a recent study was conducted. The differentially expressed BM genes were validated using quantitative reverse-transcription polymerase chain reaction (qRT-PCR). Least absolute shrinkage and selection operator regression and univariate Cox regression analyses were performed to identify a BM gene signature with prognostic significance for ccRCC. Multivariate Cox regression, time-dependent receiver operating characteristic, Kaplan-Meier, and nomogram analyses were implemented to appraise the prognostic ability of the signature and the findings were further verified using a Gene Expression Omnibus dataset. Additionally, immune cell infiltration and and pathway enrichment analyses were performed using ImmuCellAI and Gene Set Enrichment Analysis (GSEA), respectively. Finally, the DSIGDB dataset was used to screen small-molecule therapeutic drugs that may be useful in treating ccRCC patients.
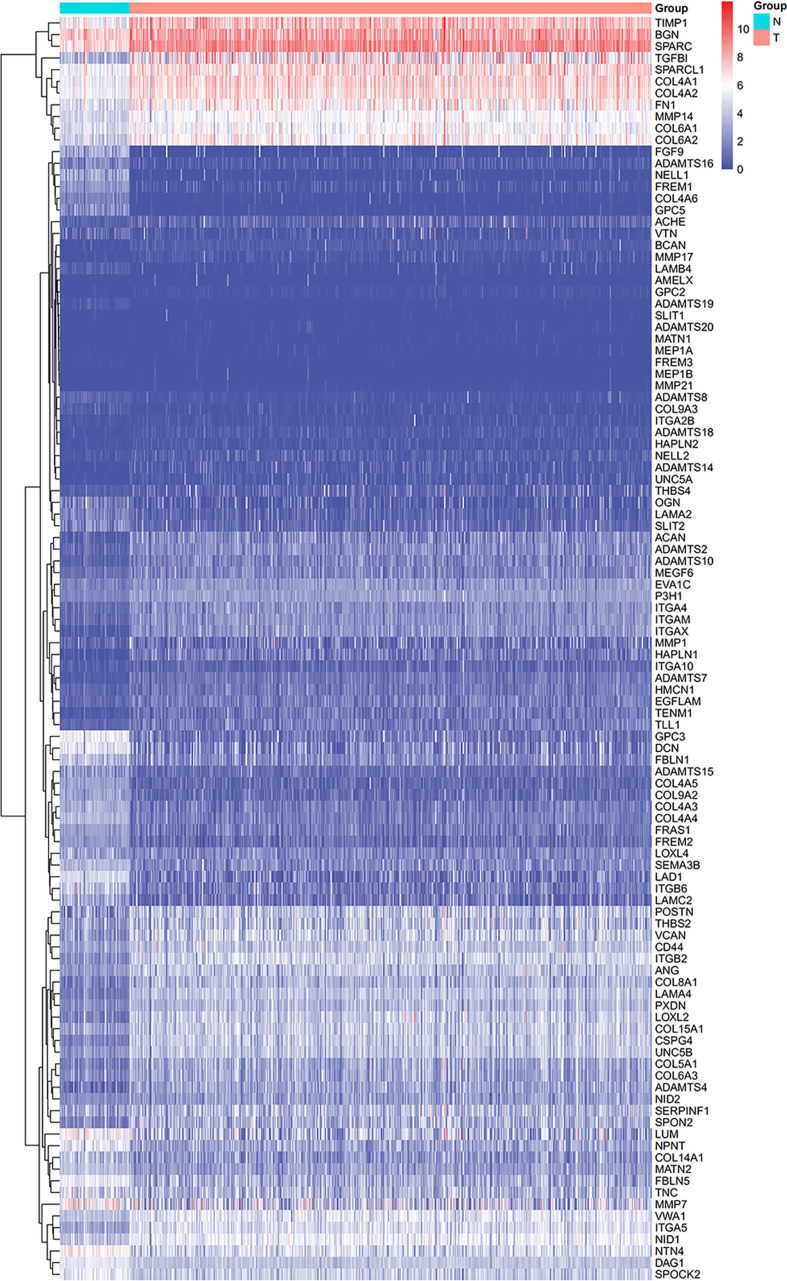
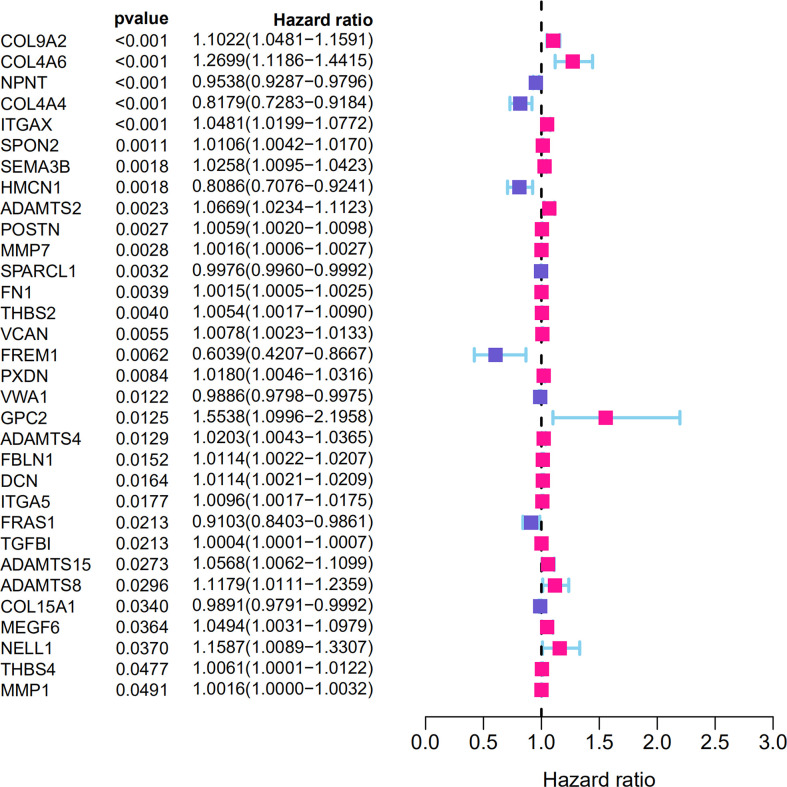
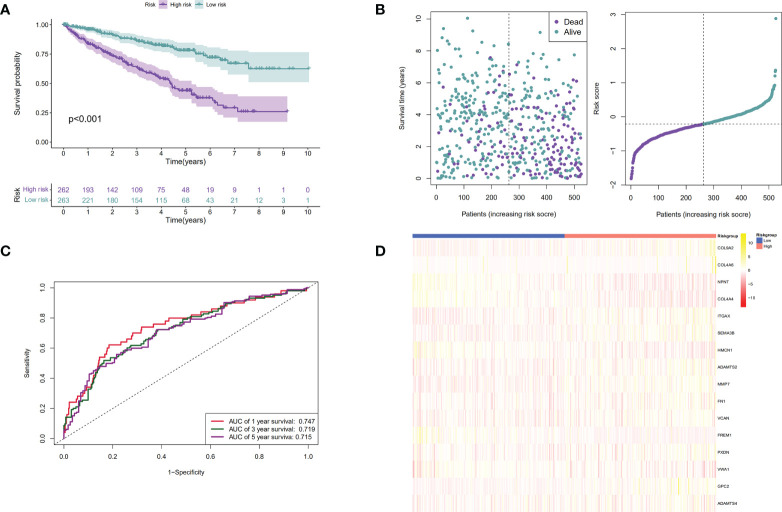
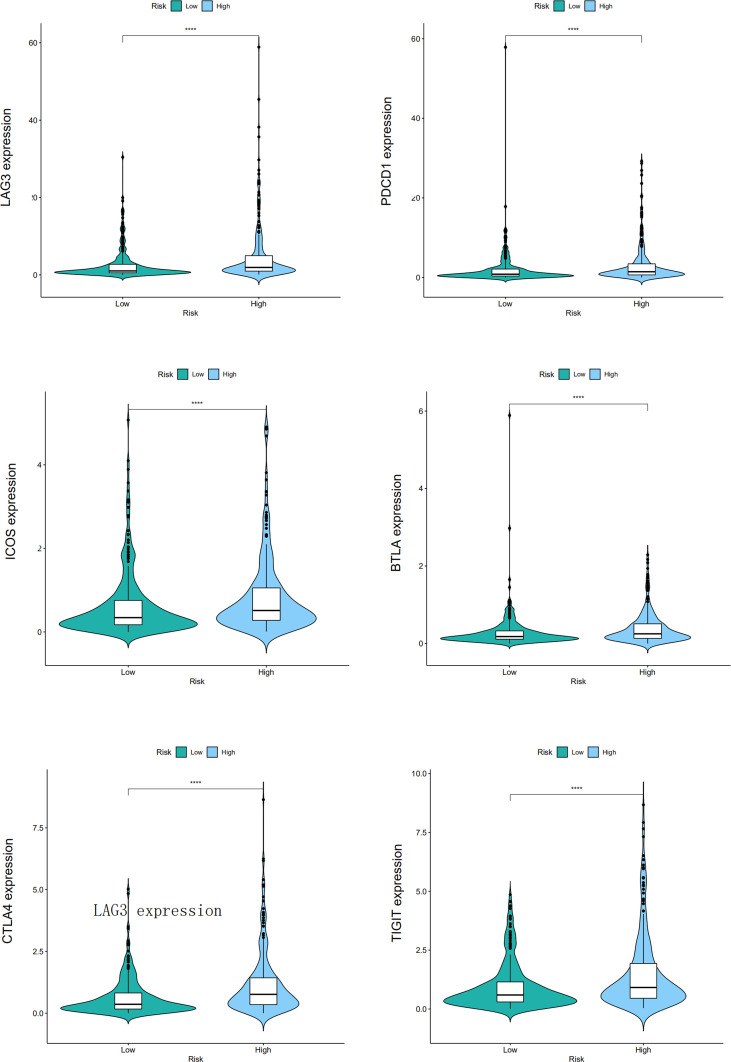
Results: We identified 108 BM genes exhibiting different expression levels compared to that in normal kidney tissues, among which 32 genes had prognostic values. The qRT-PCR analyses confirmed that the expression patterns of four of the ten selected genes were the same as the predicted ones. Additionally, we successfully established and validated a ccRCC patient prediction model based on 16 BM genes and observed that the model function is an independent predictor. GSEA revealed that differentially expressed BM genes mainly displayed significant enrichment of tumor and metabolic signaling cascades. The BM gene signature was also associated with immune cell infiltration and checkpoints. Eight small-molecule drugs may have therapeutic effects on ccRCC patients.
Conclusion: This study explored the function of BM genes in ccRCC for the first time. Reliable prognostic biomarkers that affect the survival of ccRCC patients were determined, and a BM gene-based prognostic model was established.
Keywords: basement membrane (BM); clear cell renal cell carcinoma; gene expression analysis; gene expression profile; prognostic biomarkers.
Copyright © 2022 Tao, Li, Liang, Liu and Zhou.
Conflict of interest statement
The authors declare that the research was conducted in the absence of any commercial or financial relationships that could be construed as a potential conflict of interest.
Figures
Similar articles
-
Construction and Validation of an Autophagy-Related Prognostic Risk Signature for Survival Predicting in Clear Cell Renal Cell Carcinoma Patients.Front Oncol. 2020 May 5;10:707. doi: 10.3389/fonc.2020.00707. eCollection 2020. Front Oncol. 2020. PMID: 32432045 Free PMC article.
-
Identification of ferroptosis-related gene signatures as a novel prognostic model for clear cell renal cell carcinoma.Discov Oncol. 2025 Apr 3;16(1):456. doi: 10.1007/s12672-025-02202-1. Discov Oncol. 2025. PMID: 40178680 Free PMC article.
-
A 20-Gene Signature Predicting Survival in Patients with Clear Cell Renal Cell Carcinoma Based on Basement Membrane.J Oncol. 2023 Apr 8;2023:1302278. doi: 10.1155/2023/1302278. eCollection 2023. J Oncol. 2023. PMID: 37089260 Free PMC article.
-
A new CCCH-type zinc finger-related lncRNA signature predicts the prognosis of clear cell renal cell carcinoma patients.Front Genet. 2022 Sep 30;13:1034567. doi: 10.3389/fgene.2022.1034567. eCollection 2022. Front Genet. 2022. PMID: 36246657 Free PMC article.
-
Review of Prognostic Expression Markers for Clear Cell Renal Cell Carcinoma.Front Oncol. 2021 Apr 28;11:643065. doi: 10.3389/fonc.2021.643065. eCollection 2021. Front Oncol. 2021. PMID: 33996558 Free PMC article. Review.
Cited by
-
Integrative genomics unveils basement membrane-related diagnostic markers and therapeutic targets in esophageal squamous cell carcinoma.Biol Direct. 2024 Sep 11;19(1):79. doi: 10.1186/s13062-024-00529-3. Biol Direct. 2024. PMID: 39256753 Free PMC article.
-
Comprehensive analysis of basement membrane-related genes showed that NELL2 is a new therapeutic target for colorectal cancer.Discov Oncol. 2025 Feb 17;16(1):195. doi: 10.1007/s12672-025-01979-5. Discov Oncol. 2025. PMID: 39961875 Free PMC article.
-
Novel Implication of the Basement Membrane for Breast Cancer Outcome and Immune Infiltration.Int J Biol Sci. 2023 Mar 5;19(5):1645-1663. doi: 10.7150/ijbs.81939. eCollection 2023. Int J Biol Sci. 2023. PMID: 37056938 Free PMC article.
-
The basement membrane-related gene signature is associated with immunity and predicts survival accurately in hepatocellular carcinoma.J Cancer Res Clin Oncol. 2023 Aug;149(9):5751-5760. doi: 10.1007/s00432-022-04549-2. Epub 2022 Dec 27. J Cancer Res Clin Oncol. 2023. PMID: 36575345 Free PMC article.
-
The chromosomal instability 25 gene signature is identified in clear cell renal cell carcinoma and serves as a predictor for survival and Sunitinib response.Front Oncol. 2023 May 1;13:1133902. doi: 10.3389/fonc.2023.1133902. eCollection 2023. Front Oncol. 2023. PMID: 37197417 Free PMC article.
References
LinkOut - more resources
Full Text Sources