. 2022 Oct 24:16:994735.
doi: 10.3389/fnins.2022.994735. eCollection 2022.

High-resolution spatiotemporal analysis of single serotonergic axons in an in vitro system

Affiliations

High-resolution spatiotemporal analysis of single serotonergic axons in an in vitro system

Melissa Hingorani et al. Front Neurosci. .

Abstract

Vertebrate brains have a dual structure, composed of (i) axons that can be well-captured with graph-theoretical methods and (ii) axons that form a dense matrix in which neurons with precise connections operate. A core part of this matrix is formed by axons (fibers) that store and release 5-hydroxytryptamine (5-HT, serotonin), an ancient neurotransmitter that supports neuroplasticity and has profound implications for mental health. The self-organization of the serotonergic matrix is not well understood, despite recent advances in experimental and theoretical approaches. In particular, individual serotonergic axons produce highly stochastic trajectories, fundamental to the construction of regional fiber densities, but further advances in predictive computer simulations require more accurate experimental information. This study examined single serotonergic axons in culture systems (co-cultures and monolayers), by using a set of complementary high-resolution methods: confocal microscopy, holotomography (refractive index-based live imaging), and super-resolution (STED) microscopy. It shows that serotonergic axon walks in neural tissue may strongly reflect the stochastic geometry of this tissue and it also provides new insights into the morphology and branching properties of serotonergic axons. The proposed experimental platform can support next-generation analyses of the serotonergic matrix, including seamless integration with supercomputing approaches.

Keywords: 5-hydroxytryptamine (5-HT); axon; development; growth cone; in vitro; random walk; serotonergic; varicosities.


Conflict of interest statement

The authors declare that the research was conducted in the absence of any commercial or financial relationships that could be construed as a potential conflict of interest.

Figures
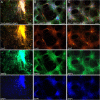
FIGURE 1
FIGURE 1
Primary midbrain cultures (all monolayers at DIV 5), visualized with immunocytochemistry for 5-HT (red) and MAP2 (green) and imaged with epifluorescence microscopy. Cell nuclei are stained blue (DAPI). (A) A tissue piece from the midbrain raphe region, the cells of which have not been fully dissociated. Long serotonergic axons with varicosities emerge from the tissue, suggesting that the culture protocol can also be used in organotypic preparations. (B,C) Typical dissociated serotonergic neurons, with morphological features (round or fusiform somata) and neurites virtually indistinguishable from those in intact neural tissue. Scale bar = 100 μm.
FIGURE 2
FIGURE 2
Primary midbrain cultures, visualized with immunocytochemistry for 5-HT (red) and MAP2 (green) and imaged with high-resolution confocal microscopy. Cell nuclei are stained blue (DAPI). (A) A serotonergic axon (5-HT + /MAP2 -, asterisk) that advances along a dendrite of a non-serotonergic neuron (5-HT -/MAP2 +). (B) Another serotonergic axon (5-HT + /MAP2–, asterisk) that advances along a 5-HT–/MAP2 + neurite. (C) A serotonergic axon (5-HT + /MAP2–, asterisk) that advances to the end of a 5-HT –/MAP2 + neurite and also produces a branch that has lost contact with the neurite (double asterisk). Note the much larger caliber of the branch, as well as multiple growth cone-like zones, perhaps in search of the next attachment point. (D) A typical contact between a serotonergic axon (5-HT + /MAP2–) and a 5-HT–/MAP2 + neurite (an enlarged part of B). (E) Contacts between two serotonergic axons (5-HT + /MAP2–) are less frequent but also occur, with no apparent repulsion between the axons. (A,B,D,E) Monolayers at DIV 4; (C) neuron-glia co-culture at DIV 3. Scale bar (shared by all panels) = 10 μm in (A–C); 5 μm in (D,E).
FIGURE 3
FIGURE 3
A primary midbrain culture (neuron-glia co-culture at DIV 3), visualized with immunocytochemistry for 5-HT (red) and MAP2 (green) and imaged with high-resolution confocal microscopy. Cell nuclei are stained blue (DAPI). (A) A serotonergic axon (5-HT + /MAP2-) that advances along a 5-HT–/MAP2 + neurite and reveals its adhesion sites (one site is marked with an asterisk). (B) An enlarged view of the growth cone region in (A). (C) A further enlarged view of the adhesion site marked with an asterisk in (A). (D) Relatively regularly spaced putative adhesion sites (5-HT + /MAP2-) on a 5-HT-/MAP2 + neurite (an enlarged part of (A), arrow). Scale bar (shared by all panels) = 10 μm in (A); 5 μm in (B,D); 2 μm in (C).
FIGURE 4
FIGURE 4
Primary midbrain cultures (all monolayers at DIV 4), visualized with immunocytochemistry for 5-HT (red) and MAP2 (green) and imaged with high-resolution confocal microscopy. (A) The growth-cone region of a serotonergic axon (5-HT + /MAP2–) that shows wide gaps in 5-HT-immunoreactivity (arrows). These gaps may be due to nanoscale-caliber bridges between intensely labeled segments or actual interruptions in fiber continuity. The presence of normal-caliber segments virtually devoid of 5-HT also cannot be ruled out. (B) A serotonergic axon or a series of its adhesion sites (5-HT + /MAP2–) that transitions from a thin, nearly continuous trace to a much thicker trace with large gaps (arrows) between circular 5-HT + regions. (C) A serotonergic axon or a series of its adhesion sites (5-HT + /MAP2–) that shows circular 5-HT + regions (around 1 μm in diameter) spaced at around 4 μm (arrows). Scale bar (shared by all panels) = 5 μm.
FIGURE 5
FIGURE 5
Primary midbrain cultures (both monolayers at DIV 13), visualized with immunocytochemistry for 5-HT (red) and either Tau-1 or neurofilaments (green) and imaged with high-resolution confocal microscopy. (A) There is no overlap between the 5-HT and Tau-1 signals, but both serotonergic (5-HT + /Tau-1–) and non-serotonergic (5-HT–/Tau-1 +) axons have segments with alternating signal intensities. It suggests that in serotonergic axons this property cannot be explained solely by 5-HT accumulation. In serotonergic neurons, the 5-HT signal tends to accumulate in puncta, but segments with no puncta are still detectable in neurites with a constant caliber (insets, with the corresponding regions marked with the rectangles in the merged image). (B) Generally, there is no overlap between the 5-HT and neurofilament signals (NF), but some strongly NF-positive and weakly 5-HT-positive axons with continuous 5-HT-immunoreactivity are present (asterisks). In some serotonergic axons with growth cones, gradually narrowing axon segments are clearly visible (inset, with the corresponding region marked with the rectangle in the merged image). Scale bars = 20 μm.
FIGURE 6
FIGURE 6
The dynamics of two growth cones (GC; labeled 1 and 2) in a primary midbrain culture (monolayer at DIV 5), visualized with time-lapse holotomography (Supplementary Video 1). (A) GC 1 attempts to move along a neurite by producing protrusions that come in contact with the neurite at well-defined points [arrow, enlarged in (B)]. The distance between adjacent points is similar to that between the discrete 5-HT + regions in Figure 4. GC 2 detects a substrate (around t = 511 s) and rapidly advances along its edge. To emphasize key transitions, time points are not evenly spaced. This imaging supports the interpretation of the dynamics that may underly the confocal microscopy data, but the recorded axons are not labeled and may not be serotonergic. Scale bar = 10 μm.
FIGURE 7
FIGURE 7
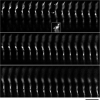
The dynamics of a growth-cone region in a primary midbrain culture (monolayer at DIV 1), visualized with time-lapse holotomography (Supplementary Video 2). As the growth cone finds its next attachment target and pulls the axon to the left, its adhesion sites are revealed (one such site is marked with an asterisk). The spacing between the adhesion sites is around 2–6 μm, and the nanoscale tethers connecting them to the main axon can be stretched to as long as 10 μm (to accommodate axon shifts). This spatial configuration closely resembles that shown in Figure 3. The arrow points to an axon segment that appears flat and twisted in a corkscrew-like fashion. To emphasize key transitions, time points are not evenly spaced. This imaging supports the interpretation of the dynamics that may underly the confocal microscopy data, but the recorded axons are not labeled and may not be serotonergic. Scale bar = 5 μm.
FIGURE 8
FIGURE 8
(A) The dynamics of a growth-cone region in a primary midbrain culture (monolayer at DIV 5), visualized with time-lapse holotomography (Supplementary Video 3). A transition from one neurite branch to another is shown (some key adhesion points are marked with asterisks). The arrows with the dashed line indicate the spatial shift of the top branch, as the growing axon generates sufficient force to line it up with its current growth axis. To emphasize key transitions, time points are not evenly spaced. This imaging supports the interpretation of the dynamics that may underly the confocal microscopy data, but the recorded axons are not labeled and may not be serotonergic. Scale bar = 10 μm. (B) A similar transition (asterisk) in a primary midbrain culture (monolayer at DIV 2), visualized with immunocytochemistry for 5-HT (red) and MAP2 (green) and imaged with high-resolution confocal microscopy. Cell nuclei are stained blue (DAPI). Scale bar = 20 μm.
FIGURE 9
FIGURE 9
A super-resolution microscopy (STED) z-series of a single serotonergic (5-HT +) axon in the sectioned cortical plate of a mouse embryo at E17. Note the growth cone protrusions similar to those in culture (e.g., Figure 3B; asterisks, inset) and a potentially flat membrane region (arrow, further analyzed in Figure 10). The sequential optical sections are evenly separated by 100 μm. Scale bar = 20 μm.
FIGURE 10
FIGURE 10
A super-resolution microscopy (STED) images of a single serotonergic (5-HT +) axon in the sectioned cortical plate of a mouse embryo at E17. The axon is shown in all three dimensions, with a fixed yz-plane (at a constant x; the vertical yellow line) and a series of xz-planes (with six different y values; the horizontal yellow line). At the shown levels, the axon is flat (ribbon-like) and appears to rotate. This hypothetical cork-screw configuration is shown in the diagram on the right. Scale bar = 5 μm.
FIGURE 11
FIGURE 11
(A) Primary midbrain culture (monolayer at DIV 4), visualized with immunocytochemistry for 5-HT (red) and MAP2 (green) and imaged with high-resolution confocal microscopy. Cell nuclei are stained blue (DAPI). (A,B) Four branching regions (white 1–4) and two growth cones (yellow 1–2) and are shown. Note that the two branches in (B) differ in their morphologies. (C) An enlarged view of the branching points. The branching regions have a triangular shape, and the branches diverge at large angles (around 90°–180°). (D) An enlarged view of the growth cones. Note the similarity of the second growth cone to that in the embryonic mouse brain (Figure 9). Scale bars = 10 μm in (A,B), 5 μm in (C,D).
FIGURE 12
FIGURE 12
(A) A diagram showing the hypothetical choices available to an advancing serotonergic axon (red) that can choose any of the available neurites (green), provided they fall within its sector of possible directions. The sector is modeled with the von Mises distribution, in which, the mean direction μ is aligned with the current direction of the fiber and the concentration parameter κ = 10. (B) A simulated walk of a fiber (blue) that can advance only along available neurites (green). In the simulation, 200 randomly-oriented lines were used, and the fiber advanced through 350 intersections. At each intersection, it could move in the current direction (a 0°-turn), turn “left” or “right” (at the available angles), or turn backward (a 180°-turn). The probabilities of the four events were calculated using the von-Mises distribution with μ = (0, 0) and κ = 5, and one event was drawn. The simulation was performed in Wolfram Mathematica 13.0. The Mathematica script can be used to generate more unique walks (Supplementary Data Sheet 1). (C) A comparable configuration of 5-HT + axons in a glia-neuron coculture at DIV 15, visualized with epifluorescence microscopy. The inset shows potential contact points. Scale bar = 20 μm. (D) Serotonergic axons (5-HT + /MAP2–, red) traveling along bridges of MAP2 + (green) neurites, visualized with epifluorescence microscopy. Scale bar = 50 μm.

Similar articles

Cited by

References

    1. Adori C., Ando R. D., Szekeres M., Gutknecht L., Kovacs G. G., Hunyady L., et al. (2011). Recovery and aging of serotonergic fibers after single and intermittent MDMA treatment in dark agouti rat. J. Comp. Neurol. 519 2353–2378. 10.1002/cne.22631 - DOI - PubMed
    1. Aitken A. R., Tork I. (1988). Early development of serotonin-containing neurons and pathways as seen in wholemount preparations of the fetal rat brain. J. Comp. Neurol. 274 32–47. 10.1002/cne.902740105 - DOI - PubMed
    1. Andersson M., Kjer H. M., Rafael-Patino J., Pacureanu A., Pakkenberg B., Thiran J. P., et al. (2020). Axon morphology is modulated by the local environment and impacts the noninvasive investigation of its structure-function relationship. Proc. Natl. Acad. Sci. U.S.A. 117 33649–33659. 10.1073/pnas.2012533117 - DOI - PMC - PubMed
    1. Antonello P. C., Varley T. F., Beggs J., Porcionatto M., Sporns O., Faber J. (2022). Self-organization of in vitro neuronal assemblies drives to complex network topology. Elife 11:e74921. 10.7554/eLife.74921 - DOI - PMC - PubMed
    1. Azmitia E. C., Whitaker-Azmitia P. M. (1987). Target cell stimulation of dissociated serotonergic neurons in culture. Neuroscience 20 47–63. 10.1016/0306-4522(87)90005-4 - DOI - PubMed

LinkOut - more resources