. 2022 Nov 4:10:e14275.
doi: 10.7717/peerj.14275. eCollection 2022.

Machine learning based estimation of field-scale daily, high resolution, multi-depth soil moisture for the Western and Midwestern United States

Affiliations

Machine learning based estimation of field-scale daily, high resolution, multi-depth soil moisture for the Western and Midwestern United States

Yushu Xia et al. PeerJ. .

Abstract

Background: High-resolution soil moisture estimates are critical for planning water management and assessing environmental quality. In-situ measurements alone are too costly to support the spatial and temporal resolutions needed for water management. Recent efforts have combined calibration data with machine learning algorithms to fill the gap where high resolution moisture estimates are lacking at the field scale. This study aimed to provide calibrated soil moisture models and methodology for generating gridded estimates of soil moisture at multiple depths, according to user-defined temporal periods, spatial resolution and extent.

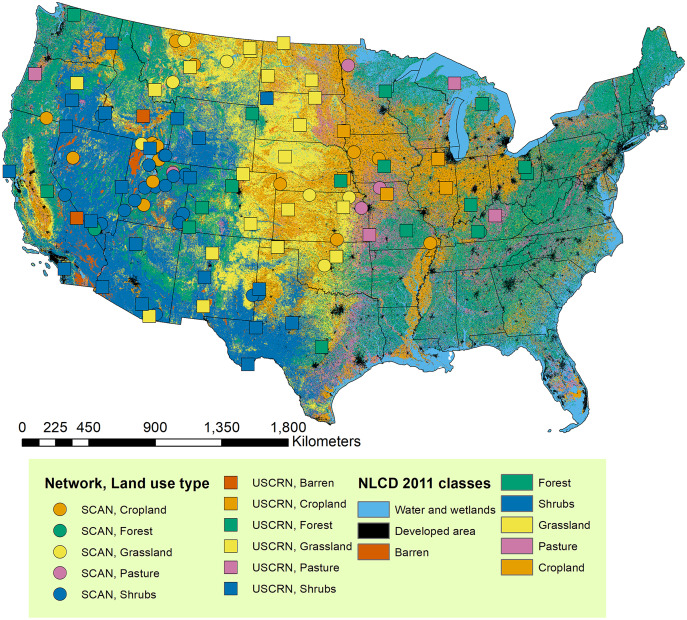
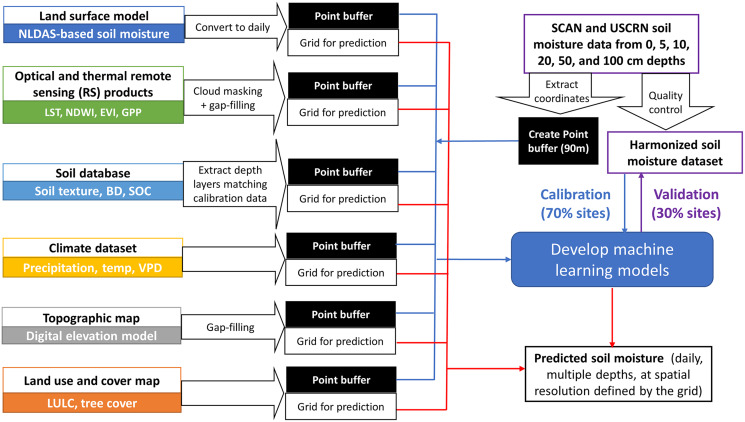
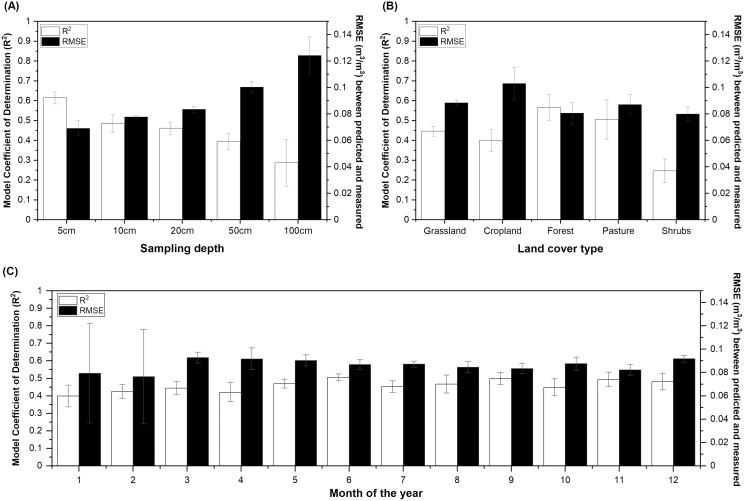
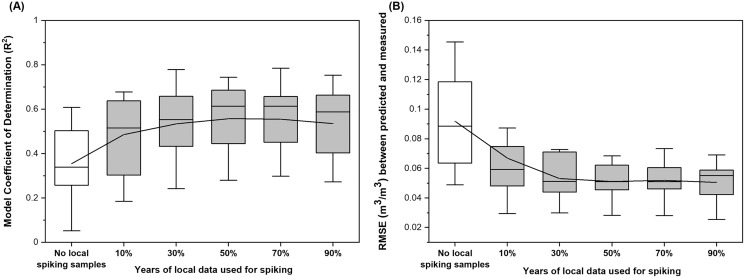
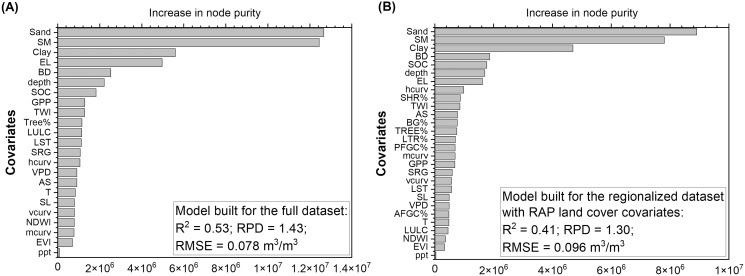
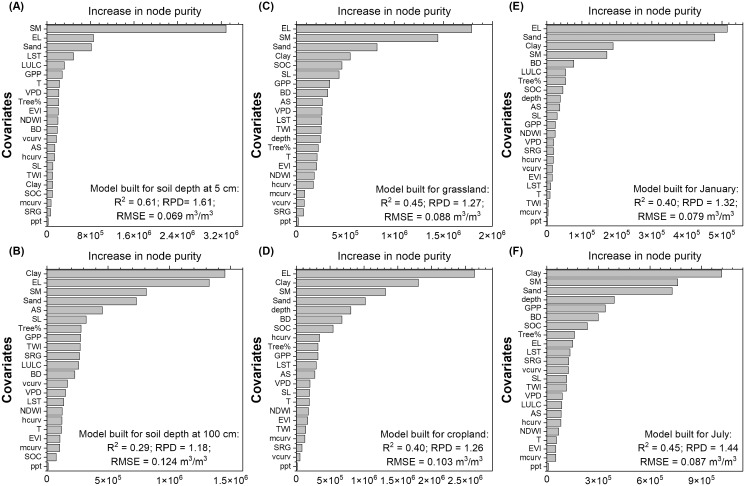
Methods: We applied nearly one million national library soil moisture records from over 100 sites, spanning the U.S. Midwest and West, to build Quantile Random Forest (QRF) calibration models. The QRF models were built on covariates including soil moisture estimates from North American Land Data Assimilation System (NLDAS), soil properties, climate variables, digital elevation models, and remote sensing-derived indices. We also explored an alternative approach that adopted a regionalized calibration dataset for the Western U.S. The broad-scale QRF models were independently validated according to sampling depths, land cover type, and observation period. We then explored the model performance improved with local samples used for spiking. Finally, the QRF models were applied to estimate soil moisture at the field scale where evaluation was carried out to check estimated temporal and spatial patterns.

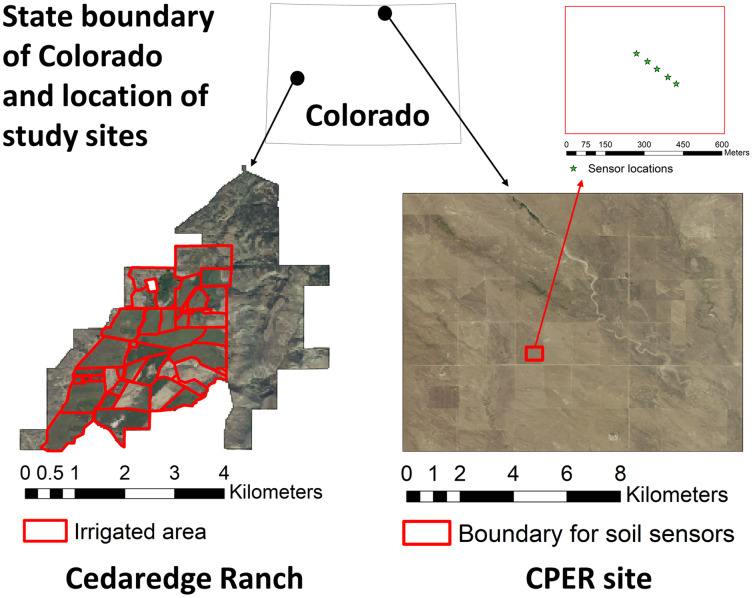
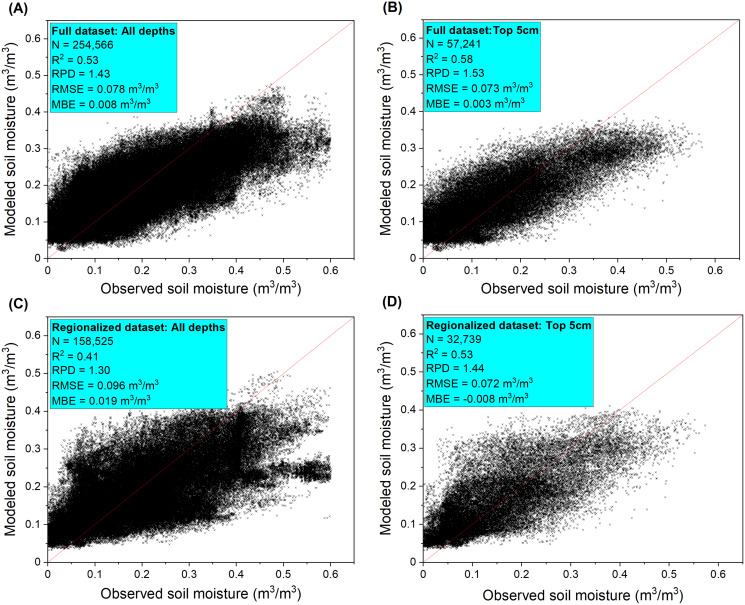
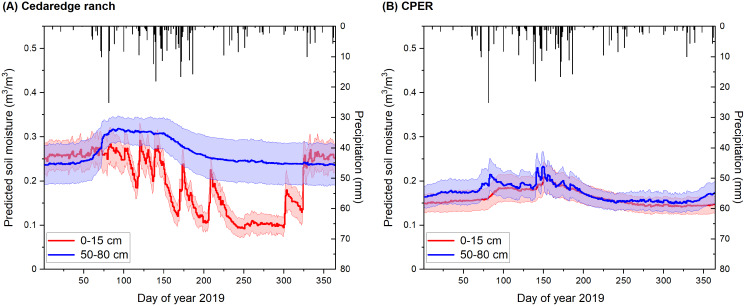
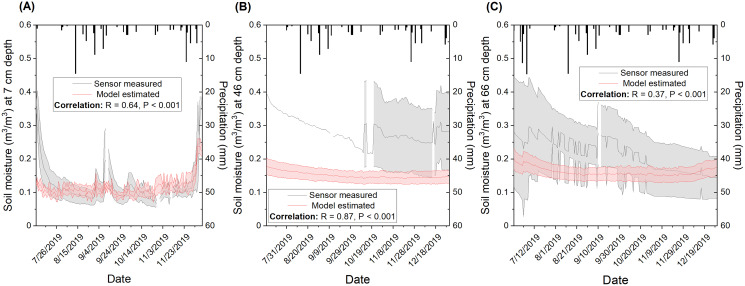
Results: The broad-scale QRF model showed moderate performance (R2 = 0.53, RMSE = 0.078 m3/m3) when data points from all depth layers (up to 100 cm) were considered for an independent validation. Elevation, NLDAS-derived moisture, soil properties, and sampling depth were ranked as the most important covariates. The best model performance was observed for forest and pasture sites (R2 > 0.5; RMSE < 0.09 m3/m3), followed by grassland and cropland (R2 > 0.4; RMSE < 0.11 m3/m3). Model performance decreased with sampling depths and was slightly lower during the winter months. Spiking the national QRF model with local samples improved model performance by reducing the RMSE to less than 0.05 m3/m3 for grassland sites. At the field scale, model estimates illustrated more accurate temporal trends for surface than subsurface soil layers. Model estimated spatial patterns need to be further improved and validated with management data.

Conclusions: The model accuracy for top 0-20 cm soil depth (R2 > 0.5, RMSE < 0.08 m3/m3) showed promise for adopting the methodology for soil moisture monitoring. The success of spiking the national model with local samples showed the need to collect multi-year high frequency (e.g., hourly) sensor-based field measurements to improve estimates of soil moisture for a longer time period. Future work should improve model performance for deeper depths with additional hydraulic properties and use of locally-selected calibration datasets.

Keywords: Digital soil mapping; Environmental covariates; Field scale; Grassland; North American Land Data Assimilation System (NLDAS); Remote sensing; Soil climate analysis network (SCAN); Soil moisture downscaling; Spiking; U.S. Climate Reference Network (USCRN).


Conflict of interest statement

The authors declare that they have no competing interests.

Figures

Figure 1
Figure 1. Stations with soil moisture calibration datasets used in this study.
The stations were extracted from national soil moisture monitoring networks including Soil Climate Analysis Network (SCAN) (Schaefer, Cosh & Jackson, 2007) and U.S. Climate Reference Network (USCRN) (Diamond et al., 2013) and assigned with the dominant land use type during the past 20 years (2001–2019) based on the U.S. National Land Cover Database (Homer et al., 2004) dataset. The NLCD data layer is shown for the year 2011.
Figure 2
Figure 2. Flowchart showing the datasets and processes for model calibration, validation, and prediction.
The national datasets used for model calibration and validation are Soil Climate Analysis Network (SCAN) and U.S. Climate Reference Network (USCRN). Covariates used in this study include North American Land Data Assimilation System (NLDAS), Land Surface Temperature (LST), Normalized Difference Wetness Index (NDWI), Enhanced Vegetation Index (EVI), Gross Primary Productivity (GPP), soil texture, bulk density (BD), soil organic carbon (SOC), precipitation, temperature (Temp), vapor pressure deficit (VPD), digital elevation model derived variables and indices, land use land cover (LULC), and tree cover percentage.
Figure 3
Figure 3. Location of the study sites in Colorado and the associated high-resolution National Agriculture Imagery Program (NAIP) imagery of 2019.
The irrigated boundary is shown for the Cedaredge ranch and soil sensor locations are shown in the Central Plains Experimental Range (CPER) site.
Figure 4
Figure 4. Soil moisture model performance reported as error metrics according to the independent validation sites.
The model performance were shown for (A) all depths and (B) surface 5 cm depth samples of the full dataset and for (C) all depths and (D) surface 5 cm depth samples of the regionalized dataset. The full dataset contains observations from the Midwestern and Western U.S. states while the regionalized dataset only contains observations from the Western U.S. states due to the use of covariates from the rangeland analysis platform data layers.
Figure 5
Figure 5. The model Coefficient of Determination (R2) and Root Mean Square Error (RMSE) derived from independent validation.
The soil moisture models built for different (A) sampling depths, (B) land cover types, and (C) sampling months. Model performance is shown for soil sampling depth up to 100 cm for (B) and (C). The full dataset containing observations from the Midwestern and Western U.S. states was used to build the calibration models. The model performance was presented as mean ± standard deviation based on five model runs.
Figure 6
Figure 6. Distribution of site-based (A) model Coefficient of Determination (R2) and (B) Root Mean Square Error (RMSE) derived from soil moisture models built under different spiking strategies.
The spiking models were built on combined national and local datasets. The grassland sites from the full dataset which contains soil moisture observations from the Western and Midwestern U.S. states were used as the national dataset, which was used to build the model without local spiking. The local dataset was then randomly selected from 10%, 30%, 50%, 70%, and 90% of the years with measurements to spike the national model. Validation results were derived from comparing observed and modeled soil moisture for the rest of the years which were not used for model building at the site. The model performance was presented as mean ± standard deviation based on error metrics calculated for individual sites.
Figure 7
Figure 7. Variable importance for (A) the full dataset and (B) the regionalized dataset ranked according to the increase in node purity of the Quantile Random Forest model.
The full dataset contains observations from the Midwestern and Western U.S. states while the regionalized dataset only contains observations from the Western U.S. states due to the use of covariates from the rangeland analysis platform (RAP) data layers. The covariates include soil sand (Sand) and clay (Clay) contents, soil bulk density (BD), soil organic carbon (SOC), sampling depth (depth), NLDAS-derived soil moisture (SM), precipitation (ppt), temperature (T), vapor pressure deficit (VPD), Gross Primary Productivity (GPP), Enhanced Vegetation Index (EVI), Modis-based tree cover% (Tree%), land use land cover (LULC), Land Surface Temperature (LST), Normalized Difference wetness Index (NDWI), elevation (EL), slope (SL), aspect (AS), mean (mcurv), vertical (vcurv), and horizontal (hcurv) curvatures, Topographic wetness Index (TWI), surface roughness (SRG), and RAP-based estimates of annual herbs% (AFGC%), perennial herbs (PFGC%), bare ground (BG%), tree (TREE%), litter (LTR%), and shrub (SHB%) covers. Model performance was presented in the panels for comparison.
Figure 8
Figure 8. Variable importance ranked for soil moisture model built on soils from (A) 5 cm sampling depth, (B) 100 cm sampling depth, (C) grassland, (D) cropland, (E) January, and (F) July.
The full calibration dataset containing soil moisture observations from the Western and Midwestern U.S. states was used to build the models and the variable importance was reported based on the increase in node purity of the Quantile Random Forest model of the calibration dataset. The covariates include soil sand (Sand) and clay (Clay) contents, soil bulk density (BD), soil organic carbon (SOC), sampling depth (depth), NLDAS-derived soil moisture (SM), precipitation (ppt), temperature (T), vapor pressure deficit (VPD), Gross Primary Productivity (GPP), Enhanced Vegetation Index (EVI), Modis-based tree cover% (Tree%), land use land cover (LULC), Land Surface Temperature (LST), Normalized Difference wetness Index (NDWI), elevation (EL), slope (SL), aspect (AS), mean (mcurv), vertical (vcurv), and horizontal (hcurv) curvatures, Topographic wetness Index (TWI), and surface roughness (SRG). The model performance labeled in the panels were calculated as averages based on five independent model runs.
Figure 9
Figure 9. Soil moisture modeled for the year 2021 at the 0–15 cm and 60–100 cm depth layers in relation to precipitation.
The modeling results are shown at the Colorado (A) Cedaredge ranch and (B) the Central Plains Experimental Range (CPER) site. Precipitation data is shown in black boxes while the colored areas represent site-level standard deviation derived from soil moisture model predictions.
Figure 10
Figure 10. Comparison of modeled and sensor measured soil moisture at three different depths including (A) top (7 cm), (B) medium (46 cm), and (C) bottom (66 cm) for the Central Plains Experimental Range (CPER) site.
The simulation was carried out in 2019 in order to compare to available sensor-based measurements. The area colored in grey represents sensor-based standard deviation when data is available. Standard deviation information is lacking for the 46 cm depth before September due to a lack of moisture records from multiple sensors. The area colored in red represents the model estimated standard deviation of 30 m buffered zones associated with the sensor locations. Pearson correlation for the temporal trends between modeled and sensor measured soil moisture was calculated and presented in the label. Precipitation f/or the investigated period was presented as black boxes.

Similar articles

Cited by

References

    1. Abowarda AS, Bai L, Zhang C, Long D, Li X, Huang Q, Sun Z. Generating surface soil moisture at 30 m spatial resolution using both data fusion and machine learning toward better water resources management at the field scale. Remote Sensing of Environment. 2021;255:112301. doi: 10.1016/j.rse.2021.112301. - DOI
    1. Adab H, Morbidelli R, Saltalippi C, Moradian M, Ghalhari GAF. Machine learning to estimate surface soil moisture from remote sensing data. Water. 2020;12(11):3223. doi: 10.3390/w12113223. - DOI
    1. Ahmad S, Kalra A, Stephen H. Estimating soil moisture using remote sensing data: a machine learning approach. Advances in Water Resources. 2010;33(1):69–80. doi: 10.1016/j.advwatres.2009.10.008. - DOI
    1. Akuraju VR, Ryu D, George B. Estimation of root-zone soil moisture using crop water stress index (CWSI) in agricultural fields. GIScience & Remote Sensing. 2021;58(3):340–353. doi: 10.1080/15481603.2021.1877009. - DOI
    1. Amatulli G, McInerney D, Sethi T, Strobl P, Domisch S. Geomorpho90m, empirical evaluation and accuracy assessment of global high-resolution geomorphometric layers. Scientific Data. 2020;7(1):162. doi: 10.1038/s41597-020-0479-6. - DOI - PMC - PubMed

Publication types

LinkOut - more resources