. 2022 Oct 24:13:977117.
doi: 10.3389/fimmu.2022.977117. eCollection 2022.

Single-cell transcriptomics of human gut T cells identifies cytotoxic CD4+CD8A+ T cells related to mouse CD4 cytotoxic T cells

Affiliations

Single-cell transcriptomics of human gut T cells identifies cytotoxic CD4+CD8A+ T cells related to mouse CD4 cytotoxic T cells

Shun Tanemoto et al. Front Immunol. .

Abstract

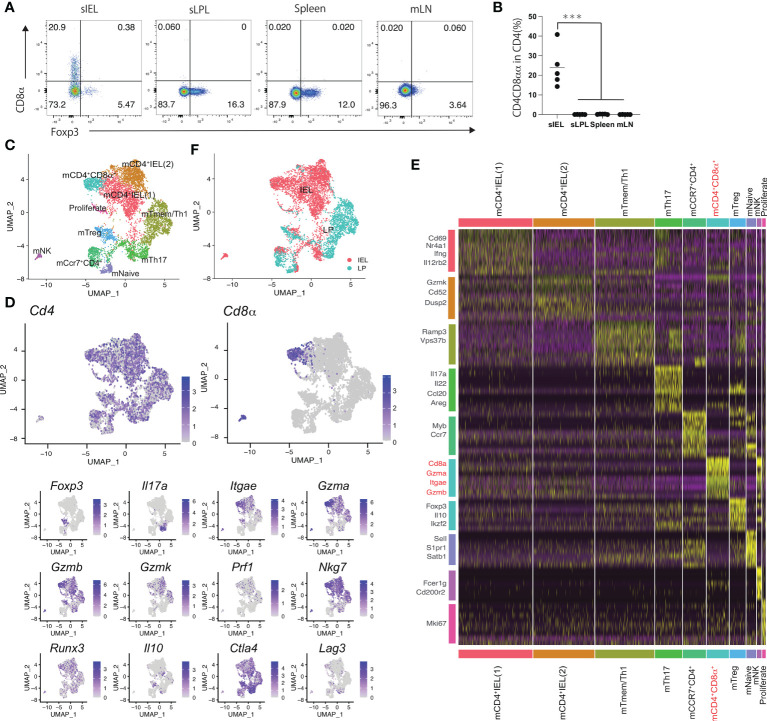
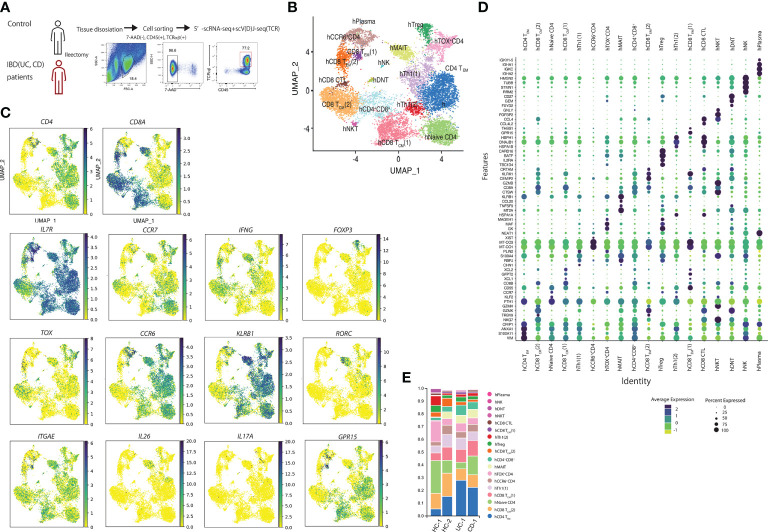
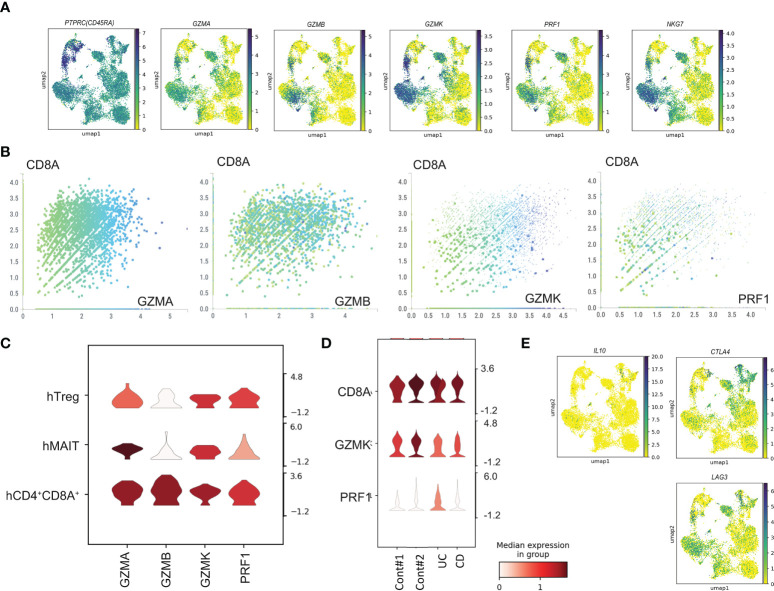
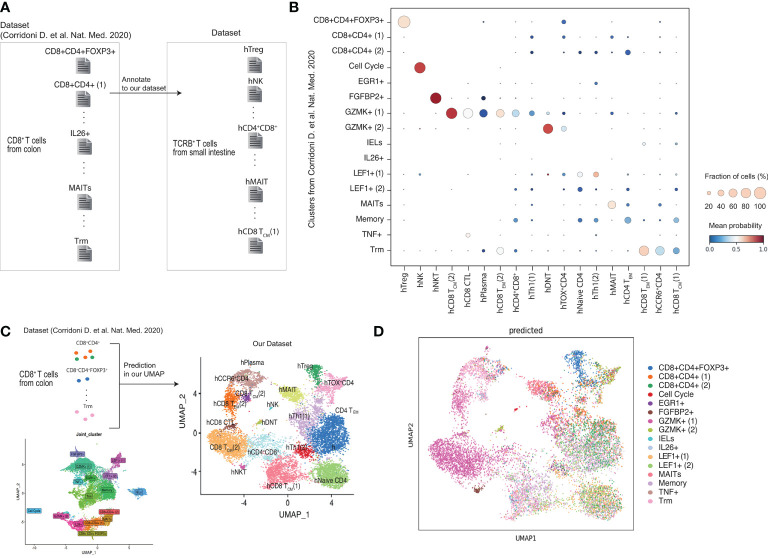
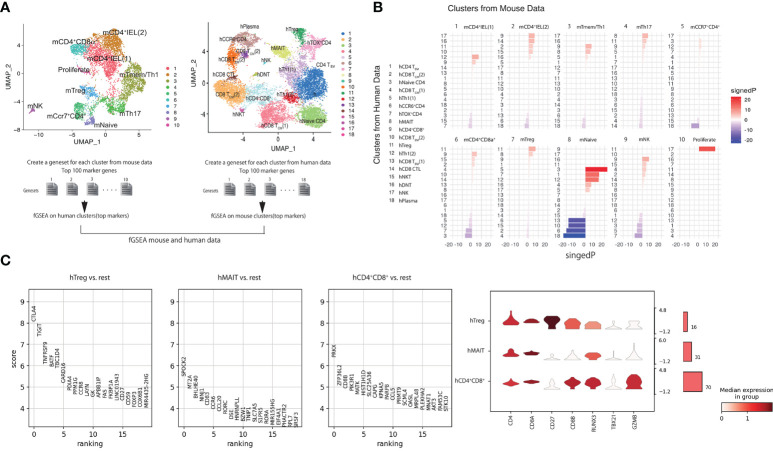
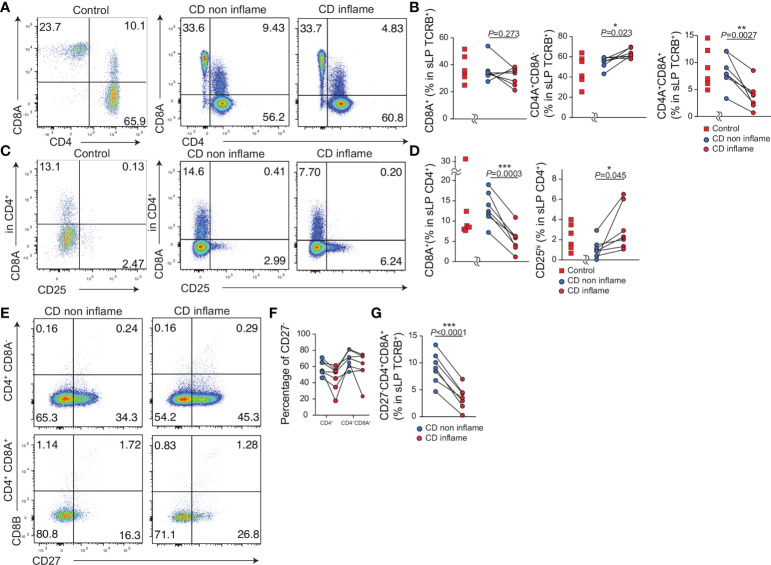
Cytotoxic CD4+ T cells (CD4-CTLs) show the presence of cytolytic granules, which include the enzymes granzyme and perforin. The cells have a pathogenic and protective role in various diseases, including cancer, viral infection, and autoimmune disease. In mice, cytotoxic CD4+ T cells express CD8αα+ and reside in the intestine (mouse CD4+CTLs; mCD4-CTLs). The population of cytotoxic CD4+ T cells in the human intestine is currently unknown. Moreover, it is unclear how cytotoxic CD4 T cells change in patients with inflammatory bowel disease (IBD). Here, we aimed to identify cytotoxic CD4+ T cells in the human intestine and analyze the characteristics of the population in patients with IBD using single-cell RNA-seq (scRNA-seq). In CD4+ T cells, granzyme and perforin expression was high in humanMAIT (hMAIT) cells and hCD4+CD8A+ T cell cluster. Both CD4 and CD8A were expressed in hTreg, hMAIT, and hCD4+CD8A+ T cell clusters. Next we performed fast gene set enrichment analysis to identify cell populations that showed homology to mCD4CTLs. The analysis identified the hCD4+CD8A+ T cell cluster (hCTL-like population; hCD4-CTL) similar to mouse CTLs. The percentage of CD4+CD8A+ T cells among the total CD4+ T cells in the inflamed intestine of the patients with Crohn's disease was significantly reduced compared with that in the noninflamed intestine of the patients. In summary, we identified cytotoxic CD4+CD8+ T cells in the small intestine of humans. The integration of the mouse and human sc-RNA-seq data analysis highlight an approach to identify human cell populations related to mouse cell populations, which may help determine the functional properties of several human cell populations in mice.

Keywords: cytotoxic CD4 T cells; human CD4+CD8A+ T cells; inflammatory bowel disease; intestinal inflammation; single-cell RNA sequencing.


Conflict of interest statement

Author KM is an employee of Miyarisan Pharmaceutical Co. Ltd. The remaining authors declare that the research was conducted in the absence of any commercial or financial relationships that could be construed as a potential conflict of interest.

Figures

Figure 1
Figure 1
Mouse CD4 cytotoxic T cells expressing CD8a are composed of a single population (A) Eight-week-old C57BL/6J mice received the CE2-diet (Ctrl-diet; n=5/group). Representative flow cytometry plots for Foxp3 expression in CD4 positive lymphocytes in the small intestine intraepithelial lesion (sIEL), lamina propria (sLPL), spleen, and mesenteric lymph node (mLN). (B) Percentage of CD8α+ cells among the CD4+TCRβ+ lymphocyte subset in sIEL, sLPL, spleen, and mLN. (C) Single-cell analysis was performed using CD4+ T cells in IEL and LPL from 11weeks-old WT mouse. All cells were classified into clusters (1–10) and analyzed using uniform manifold approximation and projection (UMAP). (D) Heat map for gene expression, for genes expressed in mCD4-CTLs (Cd4, Cd8α, Gzma, Gzmb, Gzmk, Itgae, Prf1, Nkg7, Runx3) and helper T cells (Foxp3, Il17a, Il10, Ctla4, Lag3). (E) Genes from each cluster (1–10) using data from the single-cell analysis. mCD4+CD8α+ cluster and related genes are highlighted (F) Cells were colored in red (IEL) and blue (LPL). P-values were obtained using the Student’s t-test. ***<0.001. Data are shown as the mean ± SEM (B) or ± SD (C) from individual mice (n = 5 for A) and are representative of two independent experiments.
Figure 2
Figure 2
Human single-cell analysis in controls and patients with inflammatory bowel disease showed that cells are composed of 10 populations. (A) Sorting strategy for the human single-cell RNA-seq data: LPLs collected from digested small intestinal tissues were sorted by identifying 7AADCD45+TCRB+ cells by FACS. (B) Uniform manifold approximation and projection (UMAP) embedding of a total of 12,073 cells from controls (n=2) and patients with inflammatory bowel disease (IBD) (n=2) (7012 cells from controls, 531 cells from UC, and 4530 cells from CD patients). Cells were clustered into 18 clusters. (C) Expression of CD4, CD8A, IL7R, CCR7, FOXP3, IFNG, Il17A, TOX, CCR6, KLRB1, RORC, ITGAE, IL26, IL17A and GPR15 in UMAP. (D) featuring genes in human T cell clusters. (E) Proportion of each cluster in controls and patients with IBD.
Figure 3
Figure 3
Cytotoxic gene expression in human T cells from sc-RNA-seq data. (A) Gene expression of PTPRC, GZMA, GZMB, GZMK, PRF1 and NKG7 in uniform manifold approximation and projection (UMAP) plots using human sc-RNA-seq data. (B) The expression level of CD8A and GZMA, GZMB, GZMK, PRF1 in each cell. (C) The expression level of GZMA, GZMB, GZMK, PRF1 in hTreg, hMAIT, and hCD4+CD8A+ clusters. (D) The expression level of CD8A, GZMK, and PRF1 of CD4+CD8A+ T cells from control, UC and CD patient. (E) Gene expression of IL10, CTLA4, and LAG3 in uniform manifold approximation and projection (UMAP) plots using human sc-RNA-seq data.
Figure 4
Figure 4
Comparison of CD4+CD8A+ T cells between our data and published data set. (A, B) Obtained scRNA-seq data set from previous paper (Corrinoni D. et al) and annotate to our clusters. (C, D) Prediction the cells obtained in the previous report belong to our cluster.
Figure 5
Figure 5
Cells in hCD4+CD8A+ cluster are similar to mCD4-CTLs by using fGSEA(A) Schema of the integrated mouse single-cell RNA-seq data with the human single-cell RNA-seq data using fGSEA. (B) Enrichment of mouse cluster gene sets within each human gene cluster via gene set enrichment analysis. (C) Top 20 genes in CD4+CD8A+ T cells expressed in hTreg, hMAIT, and hCD4+CD8A+ clusters compared with other cell populations. (D) Expression of CD4, CD8A, CD27, CD8B, RUNX3, TBX21, and GZMB in CD4+CD8A+ T cells in hTreg, hMAIT, and hCD4+CD8A+ clusters.
Figure 6
Figure 6
The proportion of CD4+CD8A+ T cells in the inflamed intestine is reduced compared with the non-inflamed intestine in patients with CD. Intestinal lymphocytes were obtained from the resected small intestine of controls (n=7) and patients with CD (n=7). Inflamed and non-inflamed tissues were obtained from the same CD patients (CD non inflame, CD inflame respectively). (A) Representative flow cytometry plots of CD4 and CD8A expression by TCRB positive lymphocytes in the small intestine lamina propria (sLPL). (B) Percentage of CD8A+, CD4+CD8A, and CD4+CD8A+ cells among the TCRB+ lymphocyte subsets in sLPL. (C) Representative flow cytometry plots for CD25 and CD8A expression in CD4+TCRB+ T lymphocytes in sLPL. (D) Percentage of CD25+ and CD8A+ cells among the CD4+TCRB+ lymphocyte subset in sLPL. (E) Representative flow cytometry plots for CD27 and CD8B expression in CD4+CD8ATCRB+ and CD4+CD8A+TCRB+ T lymphocytes in sLPL. (F) Percentage of CD27 cells among CD4+CD8ATCRB+ and CD4+CD8A+TCRB+ T lymphocytes in sLPL. (G) Percentage of CD27CD4+CD8A- cells among the TCRB+ T lymphocytes in sLPL. P-values were obtained via the paired Student’s t-test. *<0.05, **<0.01, ***<0.001. Each dot represents data from an individual (n = 7).

Similar articles

Cited by

References

    1. Marshall NB, Swain SL. Cytotoxic CD4 T cells in antiviral immunity. J BioMed Biotechnol (2011) 2011:954602. doi: 10.1155/2011/954602 - DOI - PMC - PubMed
    1. Takeuchi A, Saito T. CD4 CTL, a cytotoxic subset of CD4(+) T cells, their differentiation and function. Front Immunol (2017) 8:194. doi: 10.3389/fimmu.2017.00194 - DOI - PMC - PubMed
    1. Soghoian DZ, Jessen H, Flanders M, Sierra-Davidson K, Cutler S, Pertel T, et al. . HIV-Specific cytolytic CD4 T cell responses during acute HIV infection predict disease outcome. Sci Transl Med (2012) 4(123):123ra25. doi: 10.1126/scitranslmed.3003165 - DOI - PMC - PubMed
    1. van Leeuwen EM, Remmerswaal EB, Vossen MT, Rowshani AT, Wertheim-van Dillen PM, van Lier RA, et al. . Emergence of a CD4+CD28- granzyme b+, cytomegalovirus-specific T cell subset after recovery of primary cytomegalovirus infection. J Immunol (Baltimore Md 1950) (2004) 173(3):1834–41. doi: 10.4049/jimmunol.173.3.1834 - DOI - PubMed
    1. Suni MA, Ghanekar SA, Houck DW, Maecker HT, Wormsley SB, Picker LJ, et al. . CD4(+)CD8(dim) T lymphocytes exhibit enhanced cytokine expression, proliferation and cytotoxic activity in response to HCMV and HIV-1 antigens. Eur J Immunol (2001) 31(8):2512–20. doi: 10.1002/1521-4141(200108)31:8<2512::AID-IMMU2512>3.0.CO;2-M - DOI - PubMed

Publication types