The significance of glycolysis index and its correlations with immune infiltrates in Alzheimer's disease
- PMID: 36353631
- PMCID: PMC9637950
- DOI: 10.3389/fimmu.2022.960906
The significance of glycolysis index and its correlations with immune infiltrates in Alzheimer's disease
Abstract
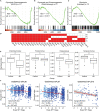
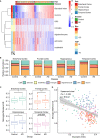
Alzheimer's disease (AD) is a common neurodegenerative disorder without an effective treatment, and results in an increasingly serious health problem. However, its pathogenesis is complex and poorly understood. Nonetheless, the exact role of dysfunctional glucose metabolism in AD pathogenesis remains unclear. We screened 28 core glycolysis-related genes and introduced a novel metric, the glycolysis index, to estimate the activation of glycolysis. The glycolysis index was significantly lower in the AD group in four different brain regions (frontal cortex, FC; temporal cortex, TC; hippocampus, HP; and entorhinal cortex, EC) than that in the control group. Combined with differential expression and over-representation analyses, we determined the clinical and pathological relevance of glycolysis in AD. Subsequently, we investigated the role of glycolysis in the AD brain microenvironment. We developed a glycolysis-brain cell marker connection network, which revealed a close relationship between glycolysis and seven brain cell types, most of which presented abundant variants in AD. Using immunohistochemistry, we detected greater infiltrated microglia and higher expression of glycolysis-related microglia markers in the APP/PS1 AD model than that in the control group, consistent with our bioinformatic analysis results. Furthermore, the excellent predictive value of the glycolysis index has been verified in different populations. Overall, our present findings revealed the clinical and biological significance of glycolysis and the brain microenvironment in AD.
Keywords: Alzheimer’s disease; brain cell markers; glycolysis index; microglia; prognostic indicator.
Copyright © 2022 Qiu, Bai, Ji, Wang, Han, Wang, Jiang and An.
Conflict of interest statement
Author XH, DW and FJ are employed by Beijing Yihua Biotechnology Co., Ltd. The remaining authors declare that the research was conducted in the absence of any commercial or financial relationships that could be construed as a potential conflict of interest.
Figures


Similar articles
-
Aerobic Glycolysis in the Frontal Cortex Correlates with Memory Performance in Wild-Type Mice But Not the APP/PS1 Mouse Model of Cerebral Amyloidosis.J Neurosci. 2016 Feb 10;36(6):1871-8. doi: 10.1523/JNEUROSCI.3131-15.2016. J Neurosci. 2016. PMID: 26865611 Free PMC article.
-
Age- and Brain Region-Specific Changes of Glucose Metabolic Disorder, Learning, and Memory Dysfunction in Early Alzheimer's Disease Assessed in APP/PS1 Transgenic Mice Using 18F-FDG-PET.Int J Mol Sci. 2016 Oct 18;17(10):1707. doi: 10.3390/ijms17101707. Int J Mol Sci. 2016. PMID: 27763550 Free PMC article.
-
Glutamatergic receptor expression changes in the Alzheimer's disease hippocampus and entorhinal cortex.Brain Pathol. 2021 Nov;31(6):e13005. doi: 10.1111/bpa.13005. Epub 2021 Jul 16. Brain Pathol. 2021. PMID: 34269494 Free PMC article.
-
Impact of Genetic Risk Factors for Alzheimer's Disease on Brain Glucose Metabolism.Mol Neurobiol. 2021 Jun;58(6):2608-2619. doi: 10.1007/s12035-021-02297-x. Epub 2021 Jan 21. Mol Neurobiol. 2021. PMID: 33479841 Review.
-
Glucose metabolism: A link between traumatic brain injury and Alzheimer's disease.Chin J Traumatol. 2021 Feb;24(1):5-10. doi: 10.1016/j.cjtee.2020.10.001. Epub 2020 Nov 3. Chin J Traumatol. 2021. PMID: 33358332 Free PMC article. Review.
Cited by
-
Advancing Alzheimer's Disease Modelling by Developing a Refined Biomimetic Brain Microenvironment for Facilitating High-Throughput Screening of Pharmacological Treatment Strategies.Int J Mol Sci. 2024 Dec 30;26(1):241. doi: 10.3390/ijms26010241. Int J Mol Sci. 2024. PMID: 39796097 Free PMC article. Review.
-
The role of n-3-derived specialised pro-resolving mediators (SPMs) in microglial mitochondrial respiration and inflammation resolution in Alzheimer's disease.Mol Neurodegener. 2025 Mar 21;20(1):35. doi: 10.1186/s13024-025-00824-1. Mol Neurodegener. 2025. PMID: 40114266 Free PMC article. Review.
-
Limitations of the human iPSC-derived neuron model for early-onset Alzheimer's disease.Mol Brain. 2023 Nov 3;16(1):75. doi: 10.1186/s13041-023-01063-5. Mol Brain. 2023. PMID: 37924159 Free PMC article.
-
Exploring glycolytic enzymes in disease: potential biomarkers and therapeutic targets in neurodegeneration, cancer and parasitic infections.Open Biol. 2025 Feb;15(2):240239. doi: 10.1098/rsob.240239. Epub 2025 Feb 5. Open Biol. 2025. PMID: 39904372 Free PMC article. Review.
References
MeSH terms
LinkOut - more resources
Full Text Sources
Medical
Research Materials
Miscellaneous

