. 2022 Dec 16;82(24):4571-4585.
doi: 10.1158/0008-5472.CAN-22-0435.

ATM Regulates Differentiation of Myofibroblastic Cancer-Associated Fibroblasts and Can Be Targeted to Overcome Immunotherapy Resistance

Affiliations

ATM Regulates Differentiation of Myofibroblastic Cancer-Associated Fibroblasts and Can Be Targeted to Overcome Immunotherapy Resistance

Massimiliano Mellone et al. Cancer Res. .

Abstract

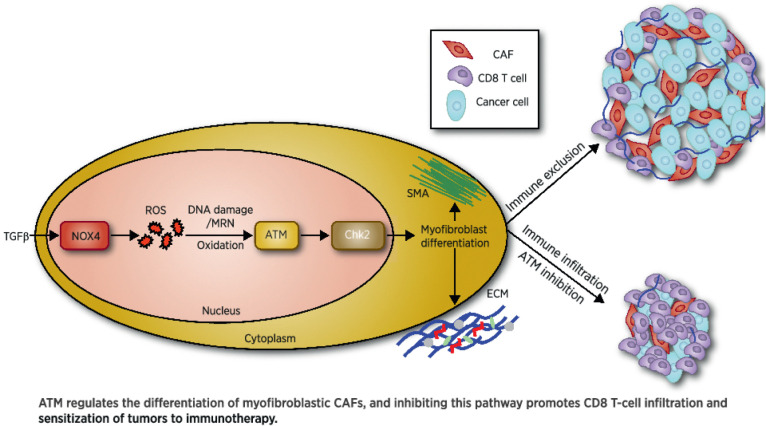
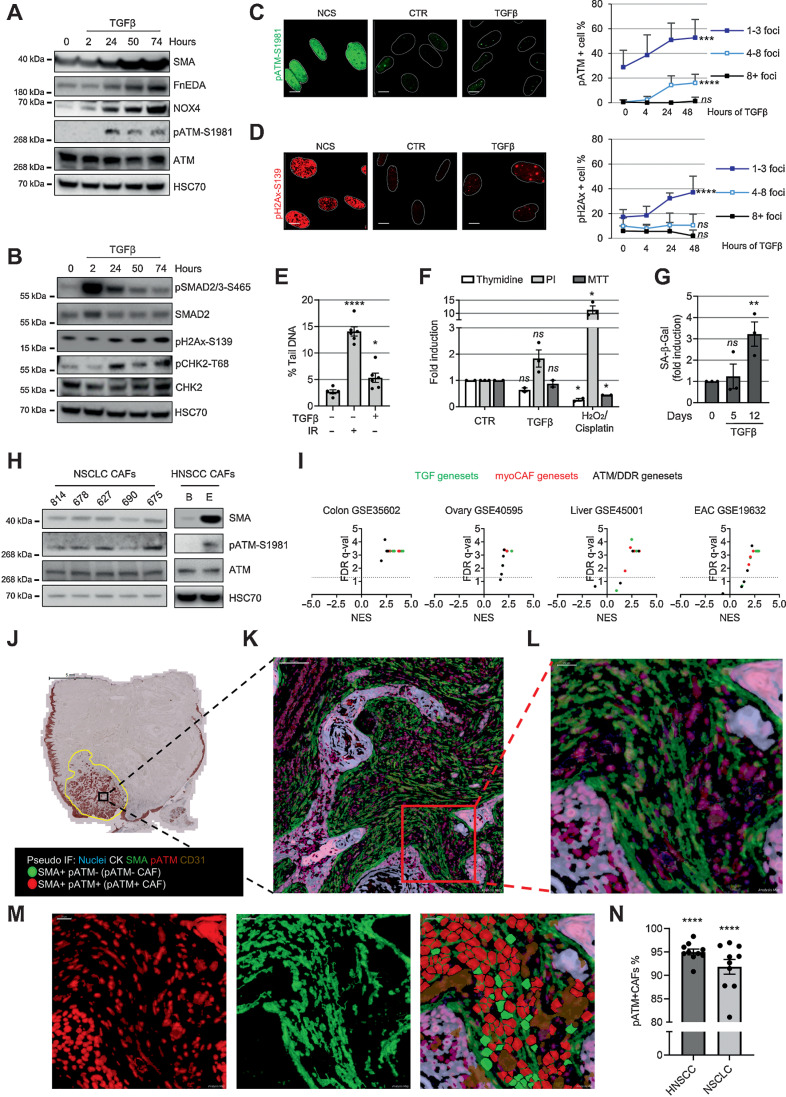
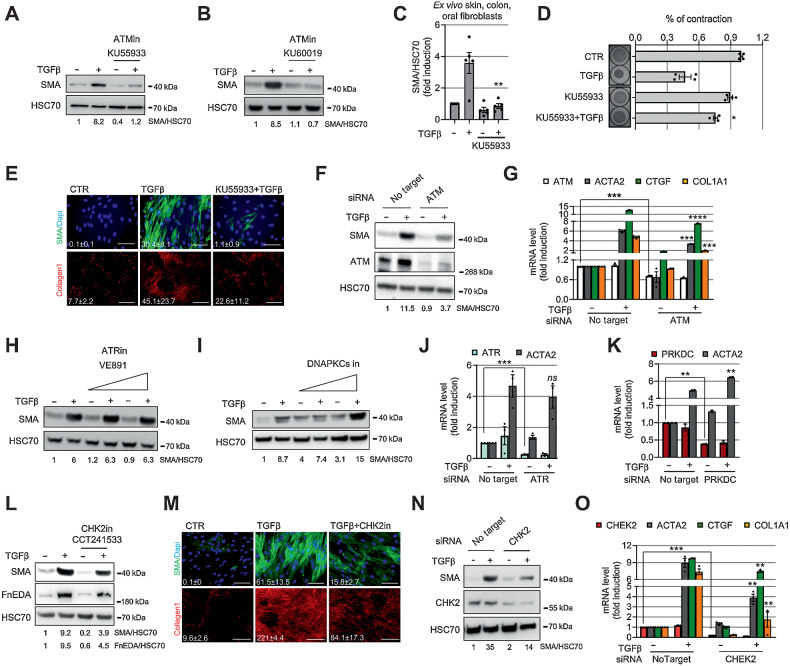
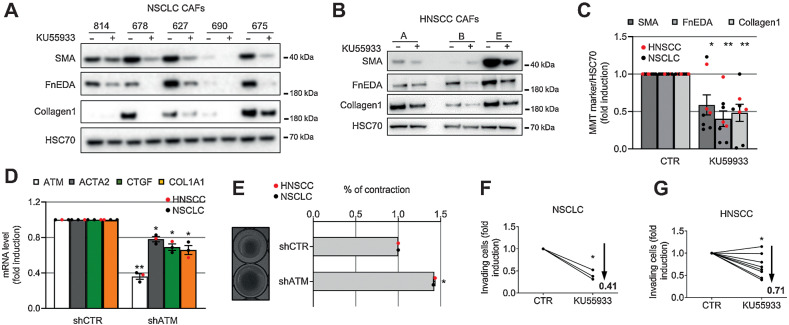
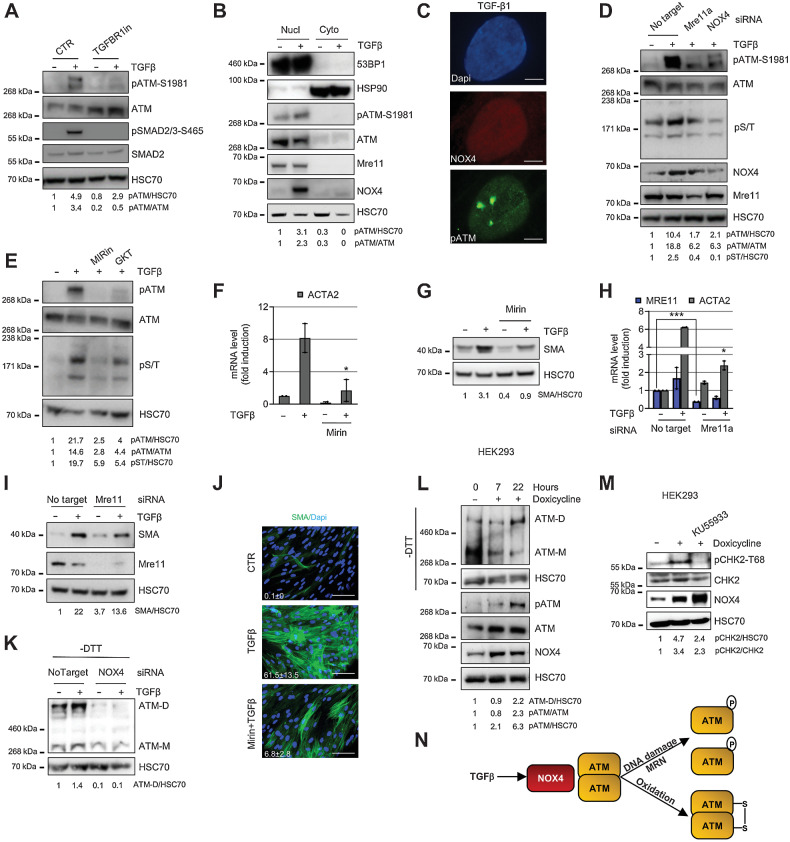
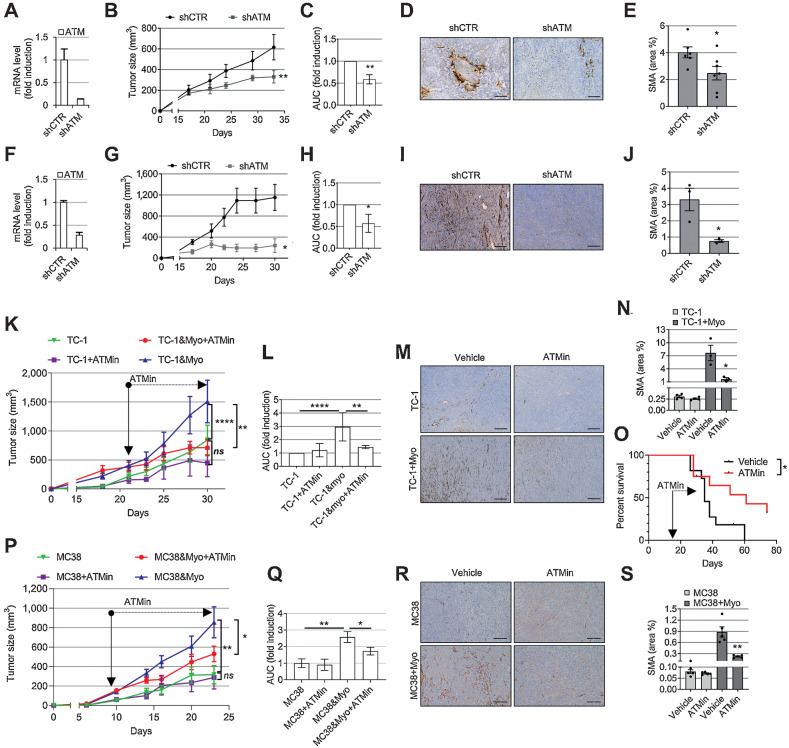
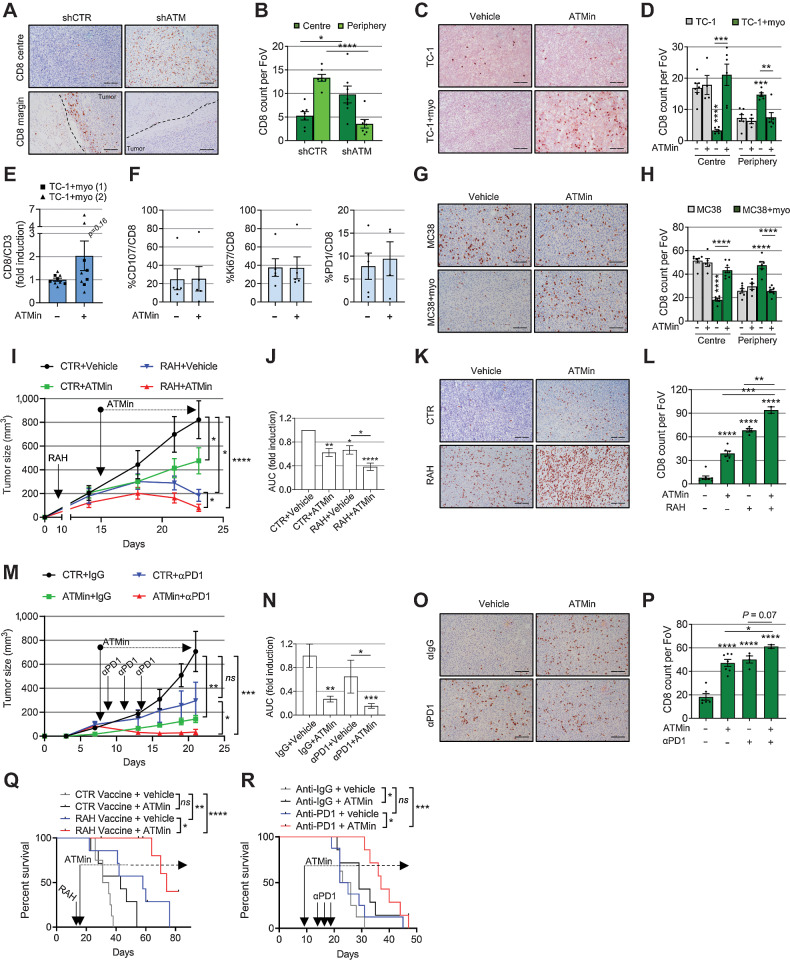
Myofibroblastic cancer-associated fibroblast (myoCAF)-rich tumors generally contain few T cells and respond poorly to immune-checkpoint blockade. Although myoCAFs are associated with poor outcome in most solid tumors, the molecular mechanisms regulating myoCAF accumulation remain unclear, limiting the potential for therapeutic intervention. Here, we identify ataxia-telangiectasia mutated (ATM) as a central regulator of the myoCAF phenotype. Differentiating myofibroblasts in vitro and myoCAFs cultured ex vivo display activated ATM signaling, and targeting ATM genetically or pharmacologically could suppress and reverse differentiation. ATM activation was regulated by the reactive oxygen species-producing enzyme NOX4, both through DNA damage and increased oxidative stress. Targeting fibroblast ATM in vivo suppressed myoCAF-rich tumor growth, promoted intratumoral CD8 T-cell infiltration, and potentiated the response to anti-PD-1 blockade and antitumor vaccination. This work identifies a novel pathway regulating myoCAF differentiation and provides a rationale for using ATM inhibitors to overcome CAF-mediated immunotherapy resistance.

Significance: ATM signaling supports the differentiation of myoCAFs to suppress T-cell infiltration and antitumor immunity, supporting the potential clinical use of ATM inhibitors in combination with checkpoint inhibition in myoCAF-rich, immune-cold tumors.


Figures

None
Graphical abstract
Figure 1. ATM activation in myofibroblasts. A–B, Western blotting of HFFF2 treated with TGFβ1 over time. C–D, Representative immunofluorescence staining of pATM- (C), pH2AX-positive (D) foci and quantification of HFFF2 treated over time with TGFβ1 or NCS (positive control); nuclei are outlined by dotted white lines based on Dapi nuclear counterstaining (not shown; scale bar = 10 μm). Foci counts are expressed as % of total cell number per FoV (FoV = ntr ≥ 8); SD and Kruskal–Wallis test are shown. E, Alkaline comet assay of HFFF2 treated with TGFβ1 for 24 hours or irradiated with 2 Gy (as positive control; ntr = 50; homoscedastic Student t test refers to the control). F, Analysis of viability, proliferation, and cell death monitored by MTT, thymidine incorporation, and PI staining, respectively. HFFF2 were treated for 3 days with TGFβ1 or with H2O2 or cisplatin as positive controls (ntr = 2–3). G, Senescence assay of HFFF2 treated with TGFβ1 over time. The percentage of SA-β-Gal–positive cells is expressed as fold induction compared with untreated control; FoV = ntr = 10. H, Western blotting of NSCLC and HNSCC CAF. I, Volcano plots with FDR q (significance) and NES (correlation) of GSEA performed on the indicated data sets from LCMD tumor versus normal stroma. The dotted line drawn at 1.3 of −log10 FDR q axis indicates FDR q = 0.05. J–N, Representative image of HNSCC MxIHC; bright field image of cytokeratin staining (scale bar = 5 mm J); pseudocolored images (scale bar = 100 μm K; scale bar = 20 μm L–M); single-stained and merged pseudocolored images with the cell regions used for the quantification highlighted in red or green for pATM or SMA positivity, respectively (subtracted CD31 staining shown in brown); quantification of pATM positivity in SMA+ cells (negative for CD31 and CK) in 10 HNSCC and 10 NSCLC cases (N) with significance calculated comparing pATM+/SMA+ vs. pATM−/SMA+ CAFs. Paired Student t test is used in the figure and refers to control unless otherwise stated.
Figure 1.
ATM activation in myofibroblasts. A and B, Western blotting of HFFF2 treated with TGFβ1 over time. C and D, Representative immunofluorescence staining of pATM- (C) and pH2AX-positive (D) foci, and quantification of HFFF2 treated over time with TGFβ1 or NCS (positive control); nuclei are outlined by dotted white lines based on DAPI nuclear counterstaining (not shown). Scale bar, 10 μm. Foci counts are expressed as percentage of total cell number per FoV (FoV = ntr ≥ 8); SD and Kruskal–Wallis test are shown. E, Alkaline comet assay of HFFF2 treated with TGFβ1 for 24 hours or irradiated with 2 Gy (as positive control; ntr = 50; homoscedastic). Student t test refers to the control. F, Analysis of viability, proliferation, and cell death monitored by MTT, thymidine incorporation, and PI staining, respectively. HFFF2 were treated for 3 days with TGFβ1 or with H2O2 or cisplatin as positive controls (ntr = 2–3). G, Senescence assay of HFFF2 treated with TGFβ1 over time. The percentage of SA-β-Gal–positive cells is expressed as fold induction compared with untreated control; FoV = ntr = 10. H, Western blotting of NSCLC and HNSCC CAF. I, Volcano plots with FDR q (significance) and NES (correlation) of GSEA performed on the indicated data sets from LCMD tumor versus normal stroma. The dotted line drawn at 1.3 of −log10 FDR q axis indicates FDR q = 0.05. J–N, Representative image of HNSCC MxIHC; brightfield image of cytokeratin staining. Scale bar, 5 mm (J); scale bar, pseudocoloered images, 100 μm (K); scale bar, 20 μm (L and M). Single-stained and merged pseudocolored images with the cell regions used for the quantification are highlighted in red or green for pATM or SMA positivity, respectively (subtracted CD31 staining is shown in brown); quantification of pATM positivity in SMA+ cells (negative for CD31 and CK) in 10 HNSCC and 10 NSCLC cases (N) with significance calculated comparing pATM+/SMA+ vs. pATM/SMA+ CAFs. Paired Student t test is used in the figure and refers to control unless otherwise stated. ns, nonsignificant; *, P ≤ 0.05; **, P ≤ 0.01; ****, P ≤ 0.0001.
Figure 2. ATM inhibition suppresses myofibroblast differentiation. A and B, Western blotting and its quantification of HFFF2 treated for 72 hours with TGFβ1 ± ATM inhibitors (13.3 μmol/L KU55933, A; 2.5 μmol/L KU60019, B). C, Western blotting quantification of SMA expression in primary fibroblasts isolated ex vivo from colon (n = 2), skin (n = 1), and oral (n = 2) tissues from healthy donors. Fibroblasts were treated as in A (see also Supplementary Fig. S2C–G). D, Collagen gel contraction assay and measurement of gel area. HFFF2 or normal primary oral fibroblasts were treated as in A. Representative gel images shown on the left (ntr = 2). E, Representative immunofluorescence staining of SMA-positive stress fibers or collagen 1 deposition in HFFF2 treated with TGFβ1 ± ATM inhibitor as above for 3 (SMA) or 7 (collagen 1) days; relative quantification of the mean (FoV for both SMA and collagen 1 = 10); scale bars for SMA = 100 μm and for collagen 1 = 500 μm). F and G, Western blotting/quantification (F) and qRT-PCR (ntr = 3; G) of HFFF2 transfected as indicated and treated with TGFβ1 for 72 hours (ACTA2 = SMA gene). H–I, Western blotting and quantification of HFFF2 fibroblast treated for 72 hours with TGFβ1 ± ATR inhibitor (VE891; 0.5 μmol/L and 2.5 μmol/L; H) or ± DNA-PKcs inhibitor (2 μmol/L and 10 μmol/L; I) for 72 hours. J and K, qRT-PCR of HFFF2 transfected as indicated and treated with TGFβ1 for 72 hours (ntr = 3; PRKDC = DNA-PKcs). L, Western blotting and quantification of HFFF2 treated for 72 hours with TGFβ1 ± CHK2 inhibitor (1.5 μmol/L CCT241533). M, Representative immunofluorescence staining of SMA and collagen 1 in HFFF2 treated with TGFβ1 ± CHK2 inhibitor (quantified as in E). N–O, Western blotting/quantification (N) and qRT-PCR (O; ntr = 3) of HFFF2 transfected as indicated and treated with TGFβ1 for 72 hours. Heteroscedastic Student t test is used throughout the figure and is relative to TGFβ1-treated samples unless otherwise highlighted.
Figure 2.
ATM inhibition suppresses myofibroblast differentiation. A and B, Western blotting and its quantification of HFFF2 treated for 72 hours with TGFβ1 ± ATM inhibitors (13.3 μmol/L KU55933, A; 2.5 μmol/L KU60019, B). C, Western blotting quantification of SMA expression in primary fibroblasts isolated ex vivo from colon (n = 2), skin (n = 1), and oral (n = 2) tissues from healthy donors. Fibroblasts were treated as in A (see also Supplementary Fig. S2C–G). D, Collagen gel contraction assay and measurement of gel area. HFFF2 or normal primary oral fibroblasts were treated as in A. Left, representative gel images (ntr = 2). E, Representative immunofluorescence staining of SMA-positive stress fibers or collagen 1 deposition in HFFF2 treated with TGFβ1 ± ATM inhibitor as above for 3 (SMA) or 7 (collagen 1) days; relative quantification of the mean (FoV for both SMA and collagen 1 = 10). Scale bars for SMA, 100 μm and for collagen 1, 500 μm. F and G, Western blotting and quantification (F) and qRT-PCR (ntr = 3; G) of HFFF2 transfected as indicated and treated with TGFβ1 for 72 hours (ACTA2 = SMA gene). H and I, Western blotting and quantification of HFFF2 fibroblast treated for 72 hours with TGFβ1 ± ATR inhibitor (VE891; 0.5 μmol/L and 2.5 μmol/L; H) or ± DNA-PKcs inhibitor (2 μmol/L and 10 μmol/L; I) for 72 hours. J and K, qRT-PCR of HFFF2 transfected as indicated and treated with TGFβ1 for 72 hours (ntr = 3; PRKDC, DNA-PKcs). L, Western blotting and quantification of HFFF2 treated for 72 hours with TGFβ1 ± CHK2 inhibitor (1.5 μmol/L CCT241533). M, Representative immunofluorescence staining of SMA and collagen 1 in HFFF2 treated with TGFβ1 ± CHK2 inhibitor (quantified as in E). N and O, Western blotting and quantification (N) and qRT-PCR (ntr = 3; O) of HFFF2 transfected as indicated and treated with TGFβ1 for 72 hours. Heteroscedastic Student t test is used throughout the figure and is relative to TGFβ1-treated samples unless otherwise highlighted. *, P ≤ 0.05; **, P ≤ 0.01; ***, P ≤ 0.001; ****, P ≤ 0.0001.
Figure 3. ATM inhibition reverses the myofibroblast CAF phenotype and inhibits function. A–C, Western blotting of HNSCC (A) and NSCLC (B) CAF treated with KU55933 for 7 days and their quantification (C). D, Q-RT-PCR of CAF (NSCLC, n = 1), HNSCC, n = 2) stably expressing either shCTR or shATM (ntr = 3). E, Collagen gel contraction assay and measurement of gel area of shCTR or shATM HNSCC and NSCLC CAF (representative gel images are shown on the left; ntr = 2). F–G, Transwell invasion assays of H441 (F) or 5PT (G) cells toward CAF-conditioned media generated from NSCLC (nbr = 3, ntr = 3–5; F) and HNSCC (nbr = 8; ntr = 2–4; G) treated as in A (means are shown and two-way ANOVA is used and refers to the control). Heteroscedastic Student t test is shown throughout the figure and refers to the control unless otherwise stated.
Figure 3.
ATM inhibition reverses the myofibroblast CAF phenotype and inhibits function. A–C, Western blotting of HNSCC (A) and NSCLC (B) CAF treated with KU55933 for 7 days and their quantification (C). D, qRT-PCR of CAF (NSCLC, n = 1; HNSCC, n = 2) stably expressing either shCTR or shATM (ntr = 3). E, Collagen gel contraction assay and measurement of gel area of shCTR or shATM HNSCC and NSCLC CAF (left, representative gel images; ntr = 2). F and G, Transwell invasion assays of H441 (F) or 5PT (G) cells toward CAF-conditioned media generated from NSCLC (nbr = 3; ntr = 3–5; F) and HNSCC (nbr = 8; ntr = 2–4; G) treated as in A (means are shown and two-way ANOVA is used and refers to the control). Heteroscedastic Student t test is shown throughout the figure and refers to the control unless otherwise stated. *, P ≤ 0.05; **, P ≤ 0.01.
Figure 4. TGFβ activates ATM via NOX4-driven DNA damage/MRN complex and oxidation. A–E, HFFF2 were treated with TGFβ1 for 24 hours. A, Western blotting/quantification of HFFF2 treated with TGFβR1 inhibitor; B, Western blotting/quantification of nucleus/cytoplasm extracts using HSP90 and 53BP1 as cytoplasmic and nuclear marker, respectively. C, Representative immunofluorescence staining for NOX4 and pATM (scale bar = 5 μm). D, Western blotting/quantification of HFFF2 transfected as indicated. E, Western blotting/quantification of HFFF2 treated with inhibitors of MRE complex inhibitor (Mirin, 40 μmol/L) or NOX4 (GKT137831; 40 μmol/L). F–G, qRT-PCR (F; ntr = 3) and Western blotting/quantification (G) of HFFF2-treated TGFβ1 for 72 hours ± 40 μmol/L Mirin. H and I, qRT-PCR (H; ntr = 3) and Western blotting/quantification (I) of IMR90 fibroblasts transfected as indicated and treated with TGFβ1 for 72 hours. J, Representative immunofluorescent staining of SMA-positive stress fibers and relative quantification of the mean in HFFF2 treated with TGFβ1 for 72 hours ± Mirin (40 μmol/L; scale bar = 100 μm; FoV = 10). K, Western blotting/quantification of HFFF2 transfected as indicated and treated with TGFβ1 for 48 hours; gel run in nonreducing -Dithiothreitol (DTT) conditions for ATM dimer (ATM-D). L, Western blotting/quantification (±DTT) of NOX4-inducible HEK-293 cells treated with doxycycline over time. M, Western blotting/quantification of NOX4-inducible HEK-293 cells treated with doxycycline ± KU55933 for 22 hours. N, Schematic diagram of the main findings in the figure. Heteroscedastic Student t test is used in the figure and refers to the TGFβ1-treated samples unless otherwise highlighted.
Figure 4.
TGFβ activates ATM via NOX4-driven DNA damage/MRN complex and oxidation. A–E, HFFF2 were treated with TGFβ1 for 24 hours. A, Western blotting/quantification of HFFF2 treated with TGFβR1 inhibitor. B, Western blotting/quantification of nucleus/cytoplasm extracts using HSP90 and 53BP1 as cytoplasmic and nuclear marker, respectively. C, Representative immunofluorescence staining for NOX4 and pATM. Scale bar, 5 μm. D, Western blotting/quantification of HFFF2 transfected as indicated. E, Western blotting/quantification of HFFF2 treated with inhibitors of MRE complex inhibitor (Mirin, 40 μmol/L) or NOX4 (GKT137831; 40 μmol/L). F and G, qRT-PCR (ntr = 3; F) and Western blotting/quantification (G) of HFFF2-treated TGFβ1 for 72 hours ± 40 μmol/L Mirin. H and I, qRT-PCR (ntr = 3; H) and Western blotting/quantification (I) of IMR90 fibroblasts transfected as indicated and treated with TGFβ1 for 72 hours. J, Representative immunofluorescent staining of SMA-positive stress fibers and relative quantification of the mean in HFFF2 treated with TGFβ1 for 72 hours ± Mirin (40 μmol/L; scale bar, 100 μm; FoV = 10). K, Western blotting/quantification of HFFF2 transfected as indicated and treated with TGFβ1 for 48 hours; gel run in nonreducing -dithiothreitol (DTT) conditions for ATM dimer (ATM-D). L, Western blotting/quantification (±DTT) of NOX4-inducible HEK293 cells treated with doxycycline over time. M, Western blotting/quantification of NOX4-inducible HEK293 cells treated with doxycycline ± KU55933 for 22 hours. N, Schematic diagram of the main findings in the figure. Heteroscedastic Student t test is used in the figure and refers to the TGFβ1-treated samples unless otherwise highlighted. *, P ≤ 0.05; ***, P ≤ 0.001.
Figure 5. Targeting ATM in myofibroblasts reduces their intratumoral accumulation and slows tumor growth. A and F, qRT-PCR showing shRNA ATM knockdown in HFFF2 (A) or TGFβ1-treated MLF (myoMLF; F) prior to injection in mice (ntr = 3; SD shown). B, G, C, and H, Tumor growth curves (B and G) and AUC histograms (C and H) following coinjection of tumor cells with shCTR or shATM fibroblasts (5PT cells + HFFF2, B and C; TC-1 cells + myoMLF, G and H). Data from single experiments are presented; mouse numbers = 3–8 (B and G). Two-way ANOVA is used for AUC analysis of three individual experiments for both 5PT (C) and TC-1 models (H). D and I, Representative SMA IHC from the experiments shown in B and G, respectively. E and J, Quantification of SMA staining (ntr = FoV = 3) from the experiments shown in B (E) and G (J). K, L and P and Q, Mice injected with either TC-1 ± myoMLF (K and L) or MC38 ± TGFβ1-treated MCF (myoMCF; P and Q) were treated with ATM inhibitor AZD0156 for the duration of the experiment (mouse number = 5–8); tumor growth curves (K and P); AUC analysis of two experiments relative to K (two-way ANOVA, L); AUC analysis of the single experiment shown in P (homoscedastic Student t test, Q). M–N and R–S, Representative images and quantification of SMA IHC of mouse tumors in K and P, respectively (ntr = FoV = 3). O, Overall survival of TC-1 + myoMLF mice treated daily with AZD0156 at days 15–28 (mouse number = 11–12; Mantel–Cox log-rank test is shown; see also Supplementary Fig. S5k and S5l). Homoscedastic Student t test is shown in the figure and refers to the control unless otherwise highlighted. Scale bars, 200 μm.
Figure 5.
Targeting ATM in myofibroblasts reduces their intratumoral accumulation and slows tumor growth. A and F, qRT-PCR showing shRNA ATM knockdown in HFFF2 (A) or TGFβ1-treated MLF (myoMLF; F) prior to injection in mice (ntr = 3; SD shown). B, G, C, and H, Tumor growth curves (B and G) and AUC histograms (C and H) following coinjection of tumor cells with shCTR or shATM fibroblasts (5PT cells + HFFF2, B and C; TC-1 cells + myoMLF, G and H). Data from single experiments are presented; mouse numbers = 3–8 (B and G). Two-way ANOVA is used for AUC analysis of three individual experiments for both 5PT (C) and TC-1 models (H). D and I, Representative SMA IHC from the experiments shown in B and G, respectively. E and J, Quantification of SMA staining (ntr = FoV = 3) from the experiments shown in B (E) and G (J). K, L,P, and Q, Mice injected with either TC-1 ± myoMLF (K and L) or MC38 ± TGFβ1-treated MCF (myoMCF; P and Q) were treated with ATM inhibitor AZD0156 for the duration of the experiment (mouse number = 5–8); tumor growth curves (K and P); AUC analysis of two experiments relative to K (two-way ANOVA; L); AUC analysis of the single experiment shown in P (homoscedastic Student t test; Q). M, N, R, and S, Representative images and quantification of SMA IHC of mouse tumors in K and P, respectively (ntr = FoV = 3). O, Overall survival of TC-1 + myoMLF mice treated daily with AZD0156 at days 15–28 (mouse number = 11–12; Mantel–Cox log-rank test is shown; see also Supplementary Fig. S5K and S5L). Homoscedastic Student t test is shown in the figure and refers to the control unless otherwise highlighted. Scale bars, 200 μm. ns, nonsignificant; *, P ≤ 0.05; **, P ≤ 0.01; ****, P ≤ 0.0001.
Figure 6. Targeting myofibroblast ATM promotes tumor CD8 T-cell infiltration and potentiates immunotherapy. A and B, Representative IHC staining (A) and relative quantification (B) of CD8 T cells in the core and periphery of TC-1 myo-rich tumors (described in Fig. 5F–J; ntr = FoV = 10; dotted lines highlight the tumor margins). C and D, Representative IHC staining (C) and relative quantification (D) of CD8 T cells in the core and periphery of tumors described in Fig. 5K (ntr = FoV = 10). E–F, Flow cytometry analysis from TC-1 + myo-rich tumors described in Fig. 5K (E shows two experiments; two-way ANOVA is used). G and H, Representative IHC staining (G) and relative quantification (H) of CD8 T cells in the core and periphery of the tumors described in Fig. 5P (ntr = FoV = 10). I–L, Mice were injected with TC-1 + myoMLF and treated with RAH vaccine±AZD0156. Control plasmid with vehicle was used as control. Tumor growth curves of a representative experiment (I; mouse number = 7–8; see also Supplementary Fig. S7a); two-way ANOVA is shown and refers to AUC analysis of three experiments (J). Representative IHC staining (K) and relative quantification of CD8 T cells in the tumor core (L; ntr = FoV = 10). M–P, Mice were injected with MC38 and myoMCF and treated with αPD-1 and AZD0156, either alone or in combination. Control mice received isotype control antibody and vehicle. Tumor growth curves of a single experiment (M; mouse number = 5–8; see also Supplementary Fig. S7b) and relative AUC analysis (N). Representative IHC staining (O) and relative quantification (P) of CD8 T cells in the tumor core (ntr = FoV = 10 in P). Q and R, Overall survival of mice injected with TC-1 + myoMLF (Q) or MC38 + myoMCF (R) and treated as indicated (mouse number = 7–8 for both experiments; Mantel–Cox log-rank test is shown; see also Supplementary Fig. S7c and S7d). Scale bars, 200 μm; a homoscedastic Student t test is used throughout the figure and is relative to the control unless otherwise highlighted.
Figure 6.
Targeting myofibroblast ATM promotes tumor CD8 T-cell infiltration and potentiates immunotherapy. A and B, Representative IHC staining (A) and relative quantification (B) of CD8 T cells in the core and periphery of TC-1 myo-rich tumors (described in Fig. 5F–J; ntr = FoV = 10; dotted lines, tumor margins). C and D, Representative IHC staining (C) and relative quantification (D) of CD8 T cells in the core and periphery of tumors described in Fig. 5K (ntr = FoV = 10). E and F, Flow cytometry analysis from TC-1 + myo-rich tumors described in Fig. 5K (E shows two experiments; two-way ANOVA was used). G and H, Representative IHC staining (G) and relative quantification (H) of CD8 T cells in the core and periphery of the tumors described in Fig. 5P (ntr = FoV = 10). I–L, Mice were injected with TC-1 + myoMLF and treated with RAH vaccine±AZD0156. Control plasmid with vehicle was used as control. Tumor growth curves of a representative experiment (I; mouse number = 7–8; see also Supplementary Fig. S7A); two-way ANOVA is shown and refers to AUC analysis of three experiments (J). Representative IHC staining (K) and relative quantification (L) of CD8 T cells in the tumor core (ntr = FoV = 10). M–P, Mice were injected with MC38 and myoMCF and treated with αPD-1 and AZD0156, either alone or in combination. Control mice received isotype control antibody and vehicle. Tumor growth curves of a single experiment (M; mouse number = 5–8; see also Supplementary Fig. S7B) and relative AUC analysis (N). Representative IHC staining (O) and relative quantification (P) of CD8 T cells in the tumor core (ntr = FoV = 10 in P). Q and R, Overall survival of mice injected with TC-1 + myoMLF (Q) or MC38 + myoMCF (R) and treated as indicated (mouse number = 7–8 for both experiments; Mantel–Cox log-rank test is shown; see also Supplementary Fig. S7C and S7D). Scale bars, 200 μm. A homoscedastic Student t test is used throughout the figure and is relative to the control unless otherwise highlighted. ns, nonsignificant; *, P ≤ 0.05; **, P ≤ 0.01; ***, P ≤ 0.001; ****, P ≤ 0.0001.

References

    1. Fearon DT. Immune-suppressing cellular elements of the tumor microenvironment. Ann Rev Cancer Biol 2017;1:241–55.
    1. Kalluri R. The biology and function of fibroblasts in cancer. Nat Rev Cancer 2016;16:582–98. - PubMed
    1. Hinz B, Phan SH, Thannickal VJ, Prunotto M, Desmoulière A, Varga J, et al. Recent developments in myofibroblast biology: paradigms for connective tissue remodeling. Am J Pathol 2012;180:1340–55. - PMC - PubMed
    1. Marsh D, Suchak K, Moutasim KA, Vallath S, Hopper C, Jerjes W, et al. Stromal features are predictive of disease mortality in oral cancer patients. J Pathol 2011;223:470–81. - PubMed
    1. Underwood TJ, Hayden AL, Derouet M, Garcia E, Noble F, White MJ, et al. Cancer-associated fibroblasts predict poor outcome and promote periostin-dependent invasion in oesophageal adenocarcinoma. J Pathol 2015;235:466–77. - PMC - PubMed

Publication types

Substances