. 2023 Jan;29(1):331-343.
doi: 10.1111/cns.14008. Epub 2022 Nov 9.

Overexpression of Homer1b/c induces valproic acid resistance in epilepsy

Affiliations

Overexpression of Homer1b/c induces valproic acid resistance in epilepsy

Yan Wang et al. CNS Neurosci Ther. 2023 Jan.

Erratum in

Abstract

Aims: Resistance to valproic acid (VPA) is a major challenge for epilepsy treatment. We aimed to explore the mechanism underlying this resistance.

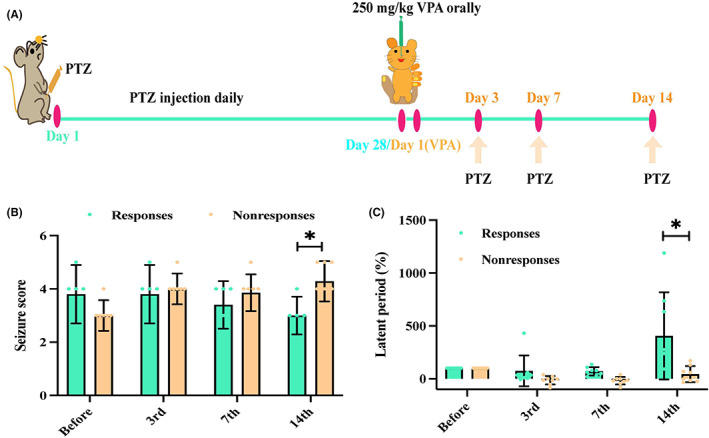
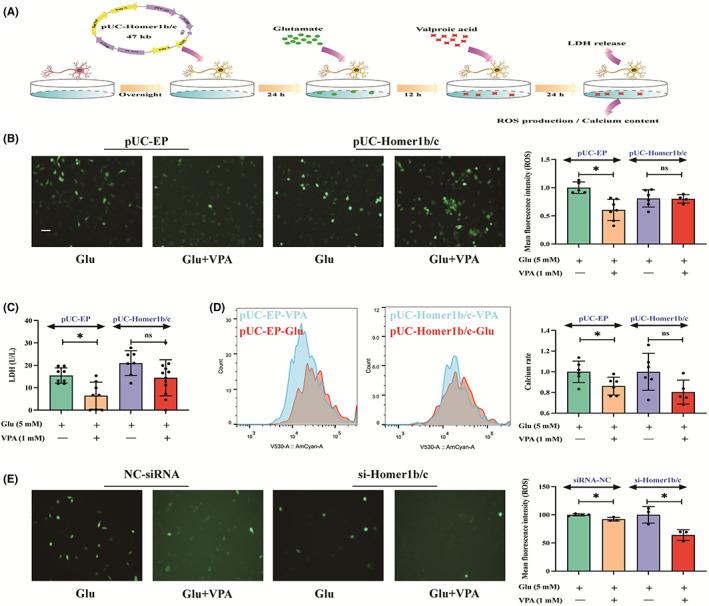
Methods: Pentylenetetrazol-induced chronic epileptic rats were administered VPA (250 mg/Kg) for 14 days; rats with controlled seizure stages (seizure score14th-before ≤0) and latent time (latent time14th-before ≥0) were considered VPA-responsive, while the others were considered nonresponsive. Differentially expressed genes (DEGs) between the VPA-responsive and nonresponsive rat hippocampus transcriptomes were identified, and their functions were evaluated. The roles of postsynaptic density (PSD) and Homer1 were also determined. Furthermore, a subtype of Homer1 (Homer1b/c) was overexpressed or silenced in HT22 cells to determine its effect on VPA efficacy. Moreover, the membrane levels of mGluR1/5 directly bound to Homer1b/c were assessed.

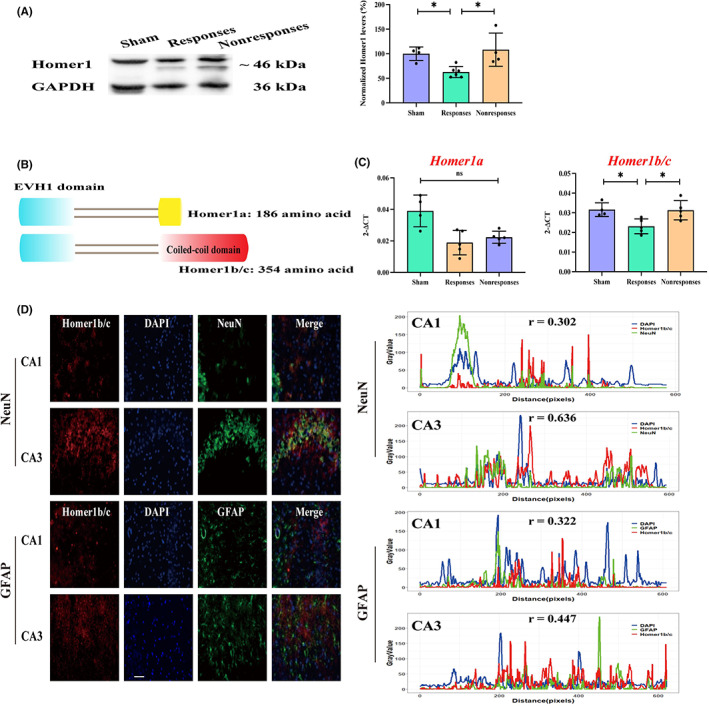
Results: Overall, 264 DEGs commonly enriched in the PSD between VPA-responsive and nonresponsive rats. Among them, Homer1 was more highly expressed in the hippocampus of nonresponses compared to that of responses. Overexpression of Homer1b/c interrupted VPA efficacy by increasing reactive oxygen species production, lactate dehydrogenase release, and calcium content. Furthermore, it induced the overexpression of mGluR1 and mGluR5.

Conclusion: Overexpression of Homer1b/c influenced VPA efficacy, revealing it could be a target to improve the efficacy of this treatment.

Keywords: HT22; Homer1b/c; VPA; efficacy; pentylenetetrazol.


Conflict of interest statement

The authors declare that they have no competing interest.

Figures

FIGURE 1
FIGURE 1
Behavior observation of responses and nonresponses. (A) Experimental procedure. Rats fully kindled with stage 3 seizures after three consecutive PTZ injections in 28 days were selected and orally administered with valproic acid (VPA) for the next 14 days. On the 3rd, 7th, and 14th days of VPA administration, rats were injected with PTZ to induce seizures to observe the effect of VPA. (B and C) Seizure score and latent period. After 14 days of VPA administration, epileptic rats resistant to VPA presented higher seizure score and lower latent period, compared with that of responsive rats. (Latent period (%): described by the formula (latent period (3rd, 7th, 14th) ‐ latent period(before))/ latent period(before)).
FIGURE 2
FIGURE 2
Transcriptome expression between VPA‐responsive and nonresponsive rats. (A) Procedure of transcriptome analysis. There were 264 differentially expressed genes (DEGs) in responsive and nonresponsive rats (green point represents downregulated genes, while red point represents upregulated genes). (B) GO enrichment. The 264 DEGs were enriched in the biological process (BP), cellular component (CC), and molecular function (MF) terms. Higher histogram in the inner circles represented lower p‐adjusted values, while, outer circles with red and blue indicated upregulated and downregulated DEGs. (C) Pathway analysis. Size of circles represented the number of gene enriched in the pathway, while, color varied from green to red indicated values of p‐adjusted from 0.05 to 0.25. (D) The thickness of PSD in CA1 region of VPA‐administered rats. Nonresponsive rats showed slightly higher thickness of PSD than that in responsive rats. (The red arrow represents the PSD, each group with n = 3).
FIGURE 3
FIGURE 3
Homer1b/c associated with VPA resistance. (A) Protein expression of Homer1 in the hippocampi of sham (administered with saline), responsive, and nonresponsive rats. (B) Schematic figures of Homer1a and Homer1b/c. Homer1a (short splicing form) and Homer1b/c (long form) share a common enabled/vasodilator‐stimulated phosphoprotein homology (EVH1) domain; however, Homer1b/c contains an additional coiled‐coil domain. (C) mRNA expression of Homer1a and Homer1b/c in the hippocampus. VPA‐responsive rats showed lower expression of Homer1b/c, compared with that in sham and nonresponsive rats. However, there was no difference in Homer1a (D) Representative colocalization images and correlation analysis of Homer1b/c, NeuN (neurons), and GFAP (astrocytes) in the CA1 and CA3 regions of nonresponsive rats. Homer1b/c was mainly expressed in neurons of the CA3 region (overlap coefficient r = 0.636), and only slightly expressed in astrocytes (r = 0.447). Bar scale = 20 μm.
FIGURE 4
FIGURE 4
VPA inhibited glutamate‐induced injury of mouse neuron cell line HT22. (A) Cell viability of glutamate and VPA on HT22 cells. The administration of glutamate (40 mM for 12 or 24 h) or VPA (10 mM for 24 h) significantly inhibited the cell viability of HT22, compared with the control group. (B‐C) Effects of VPA on glutamate‐induced injury. Administration of 5 mM of glutamate for 12 h resulted in significantly higher mean fluorescence intensity of DCFH‐DA (indicator of reactive oxygen species, ROS) and LDH release simultaneously, compared with the control group (B), while further treatment with 1 mM of VPA for 24 h showed decreased ROS production and LDH release, compared with those without VPA (C), bar scale = 100 μm.
FIGURE 5
FIGURE 5
Homer1b/c associated with VPA efficacy in glutamate‐treated HT22 cells. (A) Experimental procedure. HT22 cells were transfected with plasmids encoding with Homer1b/c or siRNA to induce Homer1b/c overexpression or silence Homer1b/c for 24 h followed by glutamate administration for 12 h and VPA for 24 h, successively. (B‐D) Mean fluorescence intensity of ROS, LDH release, and calcium content in the empty‐plasmid (EP) and Homer1b/c overexpression group. In the Homer1b/c overexpression cells, 1 mM of VPA did not improve the ROS production, LDH release, and calcium content compared with glutamate‐induced cells. (E) ROS production in the control‐siRNA (NC‐siRNA) and si‐Homer1b/c group. VPA could inhibit the ROS production in the Homer1b/c‐knockdown HT22 cell. Bar scale = 100 μm.
FIGURE 6
FIGURE 6
Overexpression of Homer1b/c interrupted the protein expression of mGluR1 and mGluR5 (A‐B) The expression of mGluR1 and mGluR5 in the HT22 cells. The expression of mGluR1 and mGluR5 in the EP cells was dramatically decreased in the VPA‐treated group compared with the glutamate‐treated group. However, administration of VPA to Homer1b/c‐overexpression HT22 cells did not induce any changes. Bar scale = 20 μm.

Similar articles

Cited by

References

    1. Singh A, Trevick S. The Epidemiology of Global Epilepsy. Neurol Clin. 2016;34(4):837‐847. - PubMed
    1. Voll A, Hernandez‐Ronquillo L, Buckley S, Tellez‐Zenteno JF. Predicting drug resistance in adult patients with generalized epilepsy: A case‐control study. Epilepsy Behav. 2015;53:126‐130. - PubMed
    1. Janson MT, Bainbridge JL. Continuing Burden of Refractory Epilepsy. Ann Pharmacother. 2021;55(3):406‐408. - PubMed
    1. Iannone LF, Arena G, Battaglia D, et al. Results From an Italian Expanded Access Program on Cannabidiol Treatment in Highly Refractory Dravet Syndrome and Lennox‐Gastaut Syndrome. Front Neurol. 2021;12:673135. - PMC - PubMed
    1. Rakitin A, Koks S, Haldre S. Valproate modulates glucose metabolism in patients with epilepsy after first exposure. Epilepsia. 2015;56(11):e172‐e175. - PubMed

Publication types