. 2023 Mar;71(3):571-587.
doi: 10.1002/glia.24295. Epub 2022 Nov 10.

Microglia and astrocyte activation is region-dependent in the α-synuclein mouse model of Parkinson's disease

Affiliations

Microglia and astrocyte activation is region-dependent in the α-synuclein mouse model of Parkinson's disease

Leyre Basurco et al. Glia. 2023 Mar.

Abstract

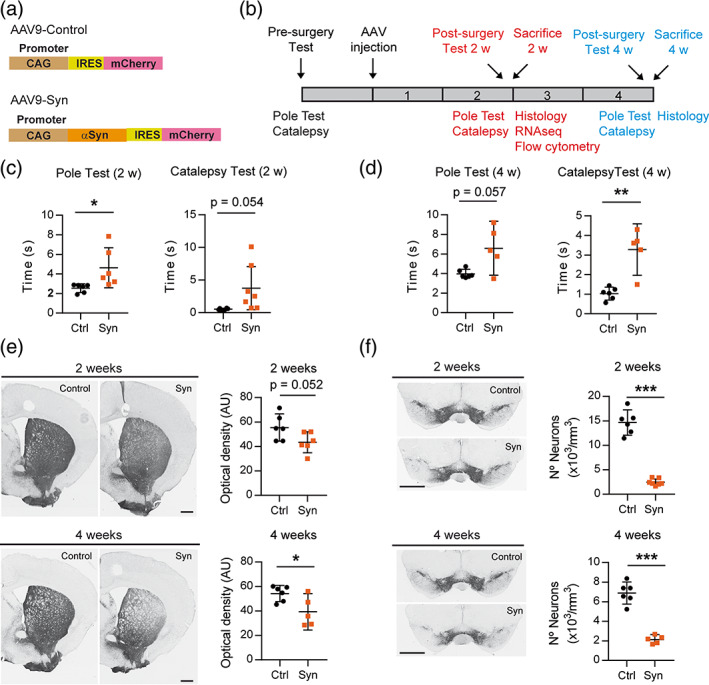
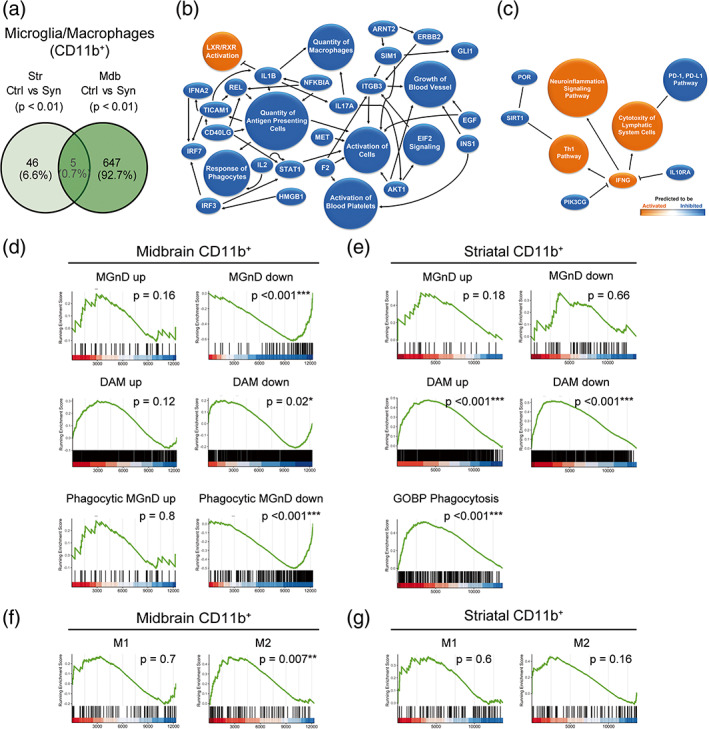
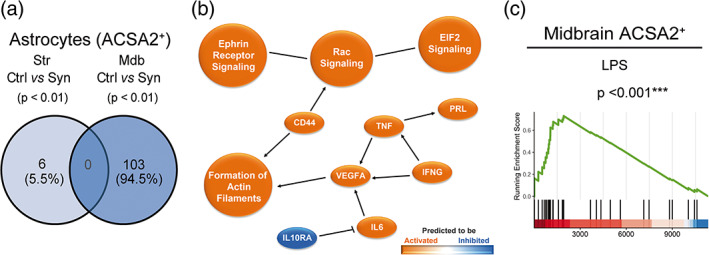
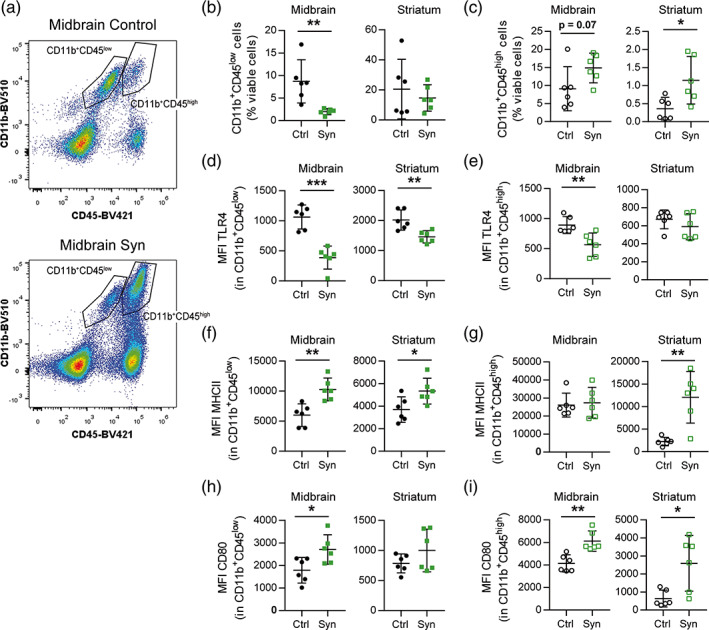
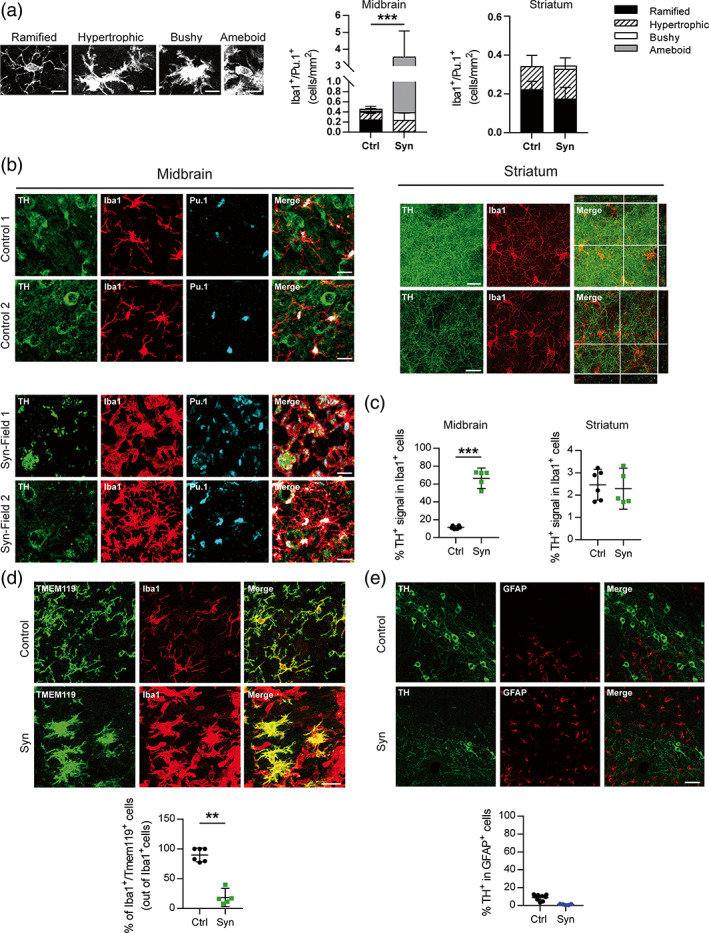
Inflammation is a common feature in neurodegenerative diseases that contributes to neuronal loss. Previously, we demonstrated that the basal inflammatory tone differed between brain regions and, consequently, the reaction generated to a pro-inflammatory stimulus was different. In this study, we assessed the innate immune reaction in the midbrain and in the striatum using an experimental model of Parkinson's disease. An adeno-associated virus serotype 9 expressing the α-synuclein and mCherry genes or the mCherry gene was administered into the substantia nigra. Myeloid cells (CD11b+ ) and astrocytes (ACSA2+ ) were purified from the midbrain and striatum for bulk RNA sequencing. In the parkinsonian midbrain, CD11b+ cells presented a unique anti-inflammatory transcriptomic profile that differed from degenerative microglia signatures described in experimental models for other neurodegenerative conditions. By contrast, striatal CD11b+ cells showed a pro-inflammatory state and were similar to disease-associated microglia. In the midbrain, a prominent increase of infiltrated monocytes/macrophages was observed and, together with microglia, participated actively in the phagocytosis of dopaminergic neuronal bodies. Although striatal microglia presented a phagocytic transcriptomic profile, morphology and cell density was preserved and no active phagocytosis was detected. Interestingly, astrocytes presented a pro-inflammatory fingerprint in the midbrain and a low number of differentially displayed transcripts in the striatum. During α-synuclein-dependent degeneration, microglia and astrocytes experience context-dependent activation states with a different contribution to the inflammatory reaction. Our results point towards the relevance of selecting appropriate cell targets to design neuroprotective strategies aimed to modulate the innate immune system during the active phase of dopaminergic degeneration.

Keywords: Parkinson's disease; astrocyte; inflammation; microglia; myeloid; neurodegeneration; synuclein.


Conflict of interest statement

The authors declare no conflicts of interest.

Figures

FIGURE 1
FIGURE 1
Overexpression of αSyn by the injection of AAV9 in the SN induces motor deficits and nigrostriatal degeneration in mice. (a) Two AAV9s were prepared, the AAV9‐Control that overexpresses the protein mCherry and the AAV9‐Syn virus that co‐expresses independently αSyn and mCherry in the infected neurons. The expression of both proteins was regulated by an ubiquitous promoter. (b) Schedule of AAV9 administration to mice, motor tests and procedures performed at 2 and 4 weeks (2 and 4 weeks, respectively). (c) Motor behavior evaluated at 2 weeks after AAV9 injection. Motor coordination was analyzed in the pole test quantifying the time required by the mice to turn down and descend the pole. Cataleptic behavior was evaluated in the bar test by measuring the time that the mice took to recover the position of the upper paws. (d) Motor behavior evaluated in the pole and in the bar test at 4 weeks. (e) Representative photomicrographs showing TH‐immunoreactivity in the striatum and photomicrographs showing TH+ dopaminergic terminals at 2 and 4 weeks. (f) Representative photomicrographs showing TH+ dopaminergic cell bodies in the midbrain and quantification of the positive cells at 2 and 4 weeks. The data represent the mean ± 95% CI from 5 to 6 animals per group. Statistical analysis: (c and d) Welch's test, (e and f) t‐test. *p < .05, **p < .01, ***p < .001. Magnification bar: (e and f) 1 mm
FIGURE 2
FIGURE 2
Transcriptomic analysis of myeloid cells purified from the striatum and the midbrain. Animals were sacrificed at 2 weeks after AAV9 administration in the SNpc. The striatum and the midbrain were dissected out and a cell suspension was prepared from these regions. Myeloid cells were separated based on the CD11b expression for RNA sequencing. (a) Venn diagram showing overlap of differentially expressed genes (p < .01) between CD11b+ cells from control and αSyn mice of the two regions. (n = 3 animals/group). (b) Graphical summary of the pathways, upstream regulators, and biological functions predicted to be altered in CD11b+ cells from the midbrain of αSyn mice. (c) Graphical summary of the pathways, upstream regulators, and biological functions predicted to be altered in CD11b+ cells from the striatum of αSyn mice. (d) Gene set enrichment analysis (GSEA) plots of the signatures enriched in midbrain myeloid cells of αSyn mice: Neurodegenerative microglia (MGnD), disease‐associated microglia (DAM) and phagocytic MGnD. GSEA was performed with the upregulated (“signature” up) and downregulated (“signature” down) genes of the signatures separately. (e) GSEA plots of the MGnD, DAM, and GOBP phagocytosis signatures enriched in striatal myeloid cells of αSyn overexpressing mice. GSEA was performed with the upregulated (“signature” up) and downregulated (“signature” down) genes of the MGnD and DAM signatures separately. (f) GSEA plots of the M1/M2 enrichment analysis in midbrain and (g) striatal myeloid cells of αSyn mice.
FIGURE 3
FIGURE 3
Transcriptomic analysis of astrocytes purified from the striatum and the midbrain of αSyn overexpressing mice. Animals were sacrificed at 2 weeks after AAV9 administration in the SNpc. The striatum and the midbrain were dissected out and a cell suspension was prepared from these regions. Astrocytes were separated based on ACSA2 expression for RNA sequencing. (a) Venn diagram showing overlap of differentially expressed genes (p < .01) between ACSA2+ cells from control and αSyn mice of the two regions(n = 3 animals/group). (b) Graphical summary of the pathways, upstream regulators and biological functions predicted to be altered in ACSA2+ cells from the midbrain of αSyn mice. (c) GSEA plot of the LPS reactive astrocyte signature enriched in midbrain astrocytes of αSyn mice.
FIGURE 4
FIGURE 4
Recruitment of myeloid cells and modulation of cell surface marker expression in the midbrain. Animals were sacrificed at 2 weeks after AAV9 administration in the SNpc. The striatum and the midbrain were dissected out and a cell suspension was prepared from these regions for flow cytometry analysis. (a) Gating strategy for CD11b+CD45low and CD11b+CD45high myeloid cells in control and αSyn mice. (b) Frequency of CD11b+CD45low and (c) CD11b+CD45high cells out of viable cells in the midbrain and striatum of control and αSyn mice. (d) MFI of TLR4 in CD11b+CD45low and (e) CD11b+CD45high cells. (f) MFI of MHCII in CD11b+CD45low and (g) CD11b+CD45high cells. (h) MFI of CD80 in CD11b+CD45low and (i) CD11b+CD45high cells. The data represent the mean ± 95% CI from 6 animals per group. Statistical analysis: (b, d, e, f, and h) t‐test, (c) midbrain and (i) Mann–Whitney test and (c) striatum and (g) Welch's t‐test. *p < .05, **p < .01, ***p < .001
FIGURE 5
FIGURE 5
Morphological and phagocytic analysis of glial cells from the striatum and the midbrain. Animals were perfused at 2 weeks after AAV9 administration by stereotaxic surgery in the SNpc (a) Four types of morphology were identified and quantified for Iba1+/Pu.1+ cells in the midbrain and striatum of control and αSyn mice: Ramified, hypertrophic, bushy, and amoeboid. Ramified microglia are characterized by long, thin processes and a small cell body. Hypertrophic morphology is characterized by long, thicker processes and a bigger cell body. Bushy microglia have a big cell body and short processes. Amoeboid microglia have a macrophage‐like morphology with few or no processes. (b) Representative images of TH/Iba1/Pu.1 immunofluorescence staining in the midbrain and striatum of control and αSyn mice. (c) Percentage of TH+ signal in Iba1+ cells. (d) Representative images of Tmem119/Iba1 immunofluorescence staining in the midbrain of control and αSyn overexpressing mice and percentage of Iba1+/Tmem119+ cells out of total Iba1+ cells. (e) Representative images of TH/GFAP immunofluorescence staining in the midbrain of control and αSyn mice and percentage of TH+ signal in GFAP+ cells. The data represent the mean ± 95% CI from 5 to 6 animals per group. Statistical analysis: (a) t‐test, (c) Welch's t‐test (d) t‐test. **p < .01, ***p < .001. Magnification bars: (a) 10 μm, (b and d) 20 μm, (e) 50 μm

Comment in

Similar articles

Cited by

References

    1. Abellanas, M. A. , Zamarbide, M. , Basurco, L. , Luquin, E. , Garcia‐Granero, M. , Clavero, P. , San Martin‐Uriz, P. , Vilas, A. , Mengua, E. , Hervas‐Stubbs, S. , & Aymerich, M. S. (2019). Midbrain microglia mediate a specific immunosuppressive response under inflammatory conditions. Journal of Neuroinflammation, 16, 233. - PMC - PubMed
    1. A‐Gonzalez, N. , Bensinger, S. J. , Hong, C. , Beceiro, S. , Bradley, M. N. , Zelcer, N. , Deniz, J. , Ramirez, C. , Díaz, M. , Gallardo, G. , de Galarreta, C. R. , Salazar, J. , Lopez, F. , Edwards, P. , Parks, J. , Andujar, M. , Tontonoz, P. , & Castrillo, A. (2009). Apoptotic cells promote their own clearance and immune tolerance through activation of the nuclear receptor LXR. Immunity, 31, 245–258. - PMC - PubMed
    1. Ahmed, I. , Tamouza, R. , Delord, M. , Krishnamoorthy, R. , Tzourio, C. , Mulot, C. , Nacfer, M. , Lambert, J. C. , Beaune, P. , Laurent‐Puig, P. , Loriot, M. A. , Charron, D. , & Elbaz, A. (2012). Association between Parkinson's disease and the HLA‐DRB1 locus. Movement Disorders, 27, 1104–1110. - PubMed
    1. Banjara, M. , & Ghosh, C. (2017). Sterile neuroinflammation and strategies for therapeutic intervention. Journal of Inflammation, 2017. - PMC - PubMed
    1. Batiuk, M. Y. , Martirosyan, A. , Wahis, J. , de Vin, F. , Marneffe, C. , Kusserow, C. , Koeppen, J. , Viana, J. F. , Oliveira, J. F. , Voet, T. , Ponting, C. P. , Belgard, T. G. , & Holt, M. G. (2020). Identification of region‐specific astrocyte subtypes at single cell resolution. Nature Communications, 11, 1220. - PMC - PubMed

Substances