. 2022 Nov 11;50(20):11858-11875.
doi: 10.1093/nar/gkac1025.

The stationary phase-specific sRNA FimR2 is a multifunctional regulator of bacterial motility, biofilm formation and virulence

Affiliations

The stationary phase-specific sRNA FimR2 is a multifunctional regulator of bacterial motility, biofilm formation and virulence

Nicole Raad et al. Nucleic Acids Res. .

Abstract

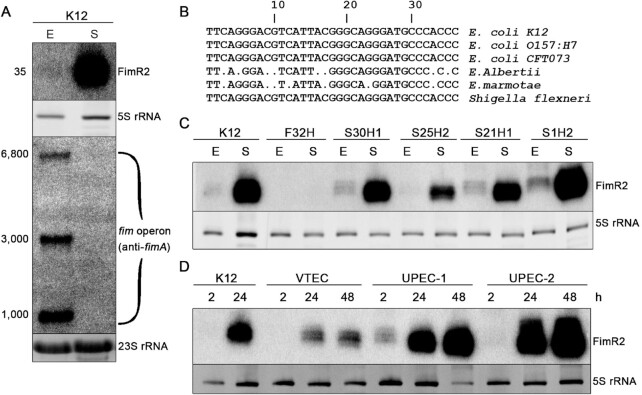
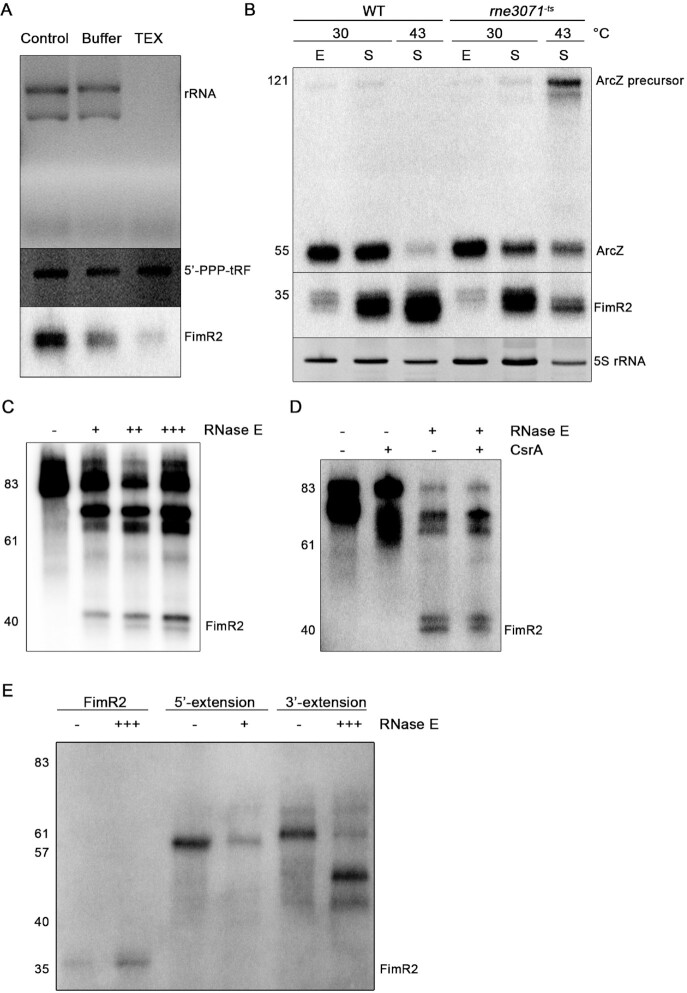
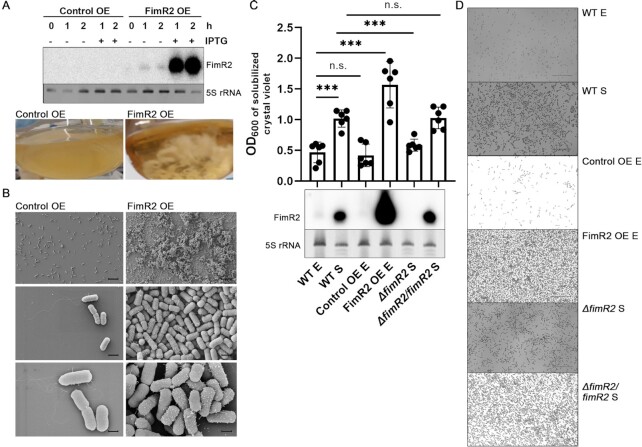
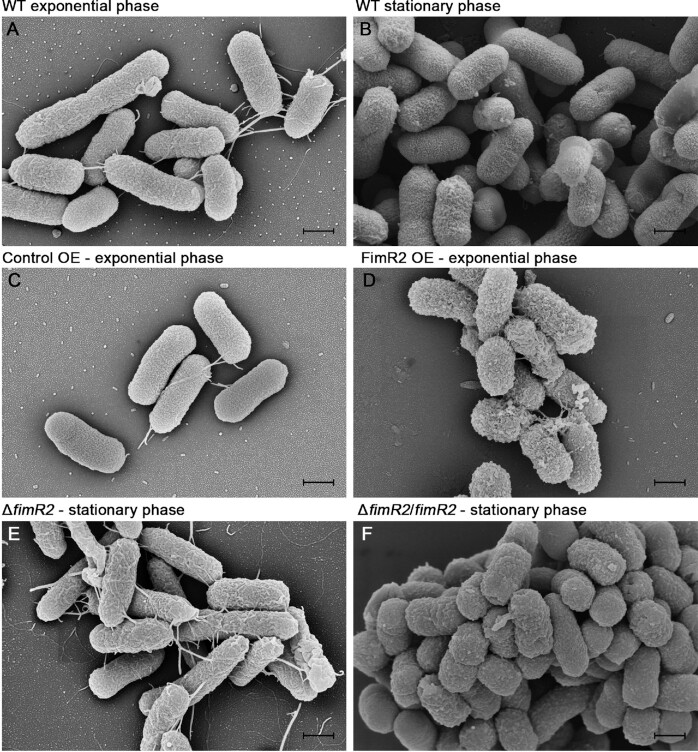
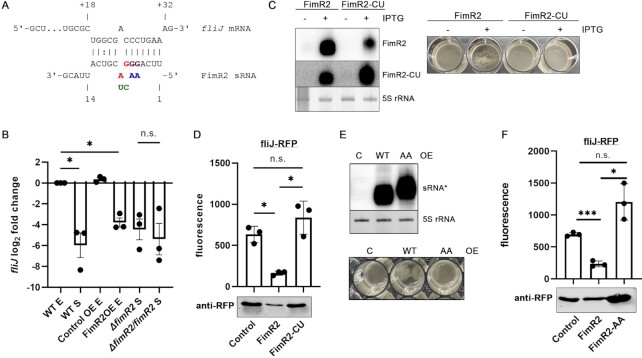
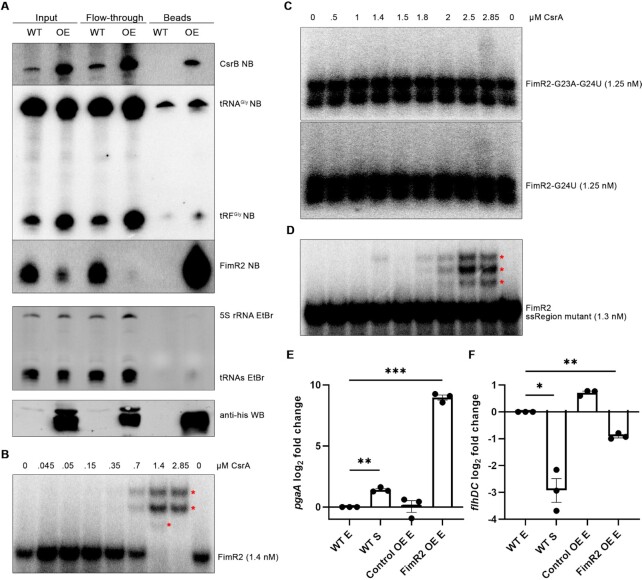
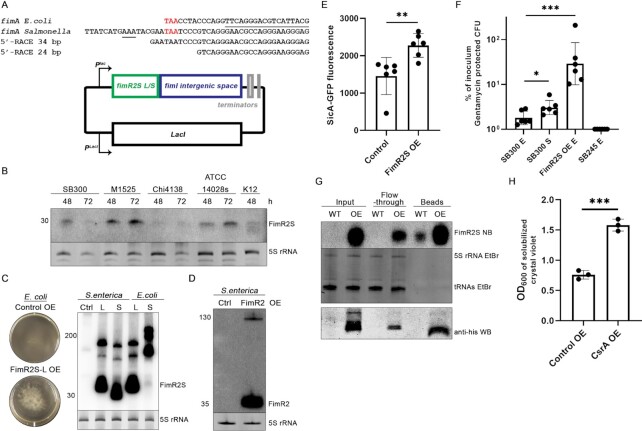
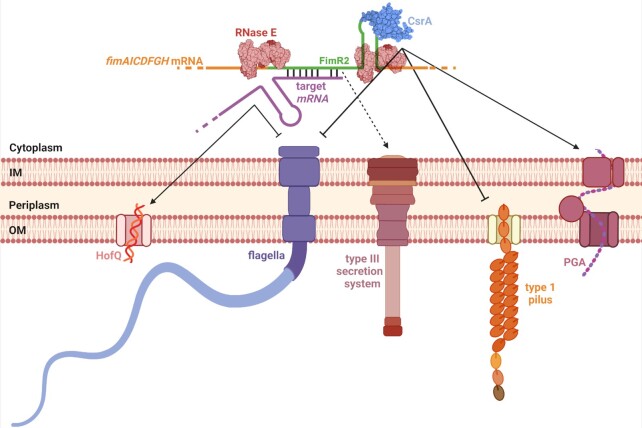
Bacterial pathogens employ a plethora of virulence factors for host invasion, and their use is tightly regulated to maximize infection efficiency and manage resources in a nutrient-limited environment. Here we show that during Escherichia coli stationary phase the 3' UTR-derived small non-coding RNA FimR2 regulates fimbrial and flagellar biosynthesis at the post-transcriptional level, leading to biofilm formation as the dominant mode of survival under conditions of nutrient depletion. FimR2 interacts with the translational regulator CsrA, antagonizing its functions and firmly tightening control over motility and biofilm formation. Generated through RNase E cleavage, FimR2 regulates stationary phase biology by fine-tuning target mRNA levels independently of the chaperones Hfq and ProQ. The Salmonella enterica orthologue of FimR2 induces effector protein secretion by the type III secretion system and stimulates infection, thus linking the sRNA to virulence. This work reveals the importance of bacterial sRNAs in modulating various aspects of bacterial physiology including stationary phase and virulence.


Figures

Figure 1.
Figure 1.
FimR2 is expressed in various E. coli strains. (A) Northern blot showing FimR2 and fimAICDFGH expression in the K-12 E. coli strain in exponential (E) and stationary (S) phase, respectively. Ethidium bromide staining of 5S rRNA and 23S rRNA are shown as loading controls on an 8% denaturing polyacrylamide gel and 1.2% agarose gel, respectively. Estimated transcript sizes are shown on the left in nucleotides. (B) Alignment of the FimR2 sequences from various enterobacterial strains. Sequential numbers indicate nucleotide positions. Dots indicate nucleotide mismatches compared to the K-12 strain. (C) Northern blot showing FimR2-phase dependent expression in ESBL E. coli strains. Total RNA samples from E (exponential phase) and S (stationary phase) are shown. Ethidium bromide staining of 5S rRNA is shown as a loading control. D. Northern blot analysis of FimR2 expression in VTEC, UPEC-1 and UPEC-2 strains. Total RNA samples from different time points of bacterial growth, 2, 24 and 48 h, are shown. Ethidium bromide staining of 5S rRNA is shown as a loading control.
Figure 2.
Figure 2.
FimR2 is processed by RNase E. (A) Ethidium bromide staining of ribosomal RNA and 5′-triphosphorylated tRNA fragment, and northern blot analysis of FimR2 upon TEX treatment. Total RNA samples were untreated (control), incubated with buffer, or with TEX. (B) Northern blot analysis of FimR2 and ArcZ sRNAs expression in WT (wild-type) and rne3071ts (RNase E temperature-sensitive) strains. E and S denote total RNA samples extracted from exponential phase and stationary phase, respectively, and from incubations at the indicated temperatures. Ethidium bromide staining of 5S rRNA is shown as a loading control. (C) Northern blot analysis of FimR2 following in vitro cleavage of a 5′- and 3′-extended precursor with (+) and without (–) increasing amounts of RNase E. (D) Northern blot analysis of FimR2 following in vitro cleavage of a 5′- and 3′-extended precursor with (+) or without (–) RNase E and CsrA. (E) Northern blot analysis of FimR2 following in vitro cleavage of the sRNA and its precursors carrying a 5′-extension or a 3′-extension with (+++) or without (–) RNase E. In panels (B–E), nucleotide sizes are indicated in numbers on the left.
Figure 3.
Figure 3.
FimR2 regulates biofilm formation. (A) Northern blot (top) of FimR2 expression in exponential phase following overexpression (OE) of the sRNA via IPTG induction. Pictures of resulting cultures are shown on the bottom. Control OE refers to the expression of a random short RNA sequence. Ethidium bromide staining of 5S rRNA is shown as a loading control. (B) Scanning electron micrographs of coverslip-formed biofilms of Control and FimR2 OE strains. Scale bars = 10 μm (top), 1 μm (middle), and 500 nm (bottom). (C) Quantitative biofilm assay (top) showing mean ± SD OD600 of solubilized crystal violet-staining from six biological replicates from WT (wild-type), Control OE, FimR2 OE (FimR2 overexpression), ΔfimR2 (fimR2 deletion), and ΔfimR2/fimR2 (fimR2 complementation) strains. Samples are shown from exponential (E) and stationary (S) phase. Unpaired two-tailed t-test with Welch's correction was used to determine significance with n.s and *** indicating not significant and significant results, respectively. The P-values are from bottom to top 0.0001, 0.6369, 0.0003, 0.0002 and 0.9202, respectively. Northern blot of FimR2 expression (bottom) in the same strains as those in the upper panel. Ethidium bromide staining of 5S rRNA is shown as a loading control. (D) Micrographs of air-liquid phase biofilms stained with crystal violet, under conditions mentioned in (C). Scale bar = 25 μm.
Figure 4.
Figure 4.
FimR2 alters bacterial outer membrane architecture. Scanning electron micrographs of E. coli K-12 strains in (A) WT exponential phase, (B) WT stationary phase, (C) Control OE (Control overexpression) in exponential phase, (D) FimR2 OE (FimR2 overexpression) in exponential phase, (E) ΔfimR2 in stationary phase and (F) ΔfimR2/fimR2 in stationary phase. Scale bar = 500 nm.
Figure 5.
Figure 5.
FimR2 regulates fliJ mRNA at the post-transcriptional level. (A) FimR2-fliJ predicted interaction. Positions of mutated nucleotides are indicated in red or purple and the introduced nucleobase changes in green (FimR2-CU mutant) or blue (FimR2-AA mutant). (B) RT-qPCR analysis of fliJ in WT, Control OE, FimR2 OE, ΔfimR2 and ΔfimR2/fimR2 strains. Total RNA samples from E (exponential phase) and S (stationary phase) are shown. Mean log2 fold change ± SEM are shown from 3 biological replicates. log2 fold change was based on comparison with WT E samples. Unpaired two-tailed t-test with Welch's correction was used to determine significance with n.s and * indicating not significant and significant results, respectively. The P-values are 0.0373, 0.0128 and 0.6379, respectively. (C) Northern blot analysis of FimR2 and FimR2-CU (left) showing the expression of the sRNAs upon induction with IPTG, using two distinct probes that anneal differently to each sRNA. Ethidium bromide staining of 5S rRNA is shown as a loading control. Pictures of bacterial cultures from the same conditions (right) showing the aggregation upon FimR2 overexpression. (D) Mean ± SD of fluorescence of the fliJ-RFP fusion protein following control, FimR2 or FimR2-CU overexpression (top) and RFP western-blot of the same samples (bottom). Three biological replicates were used for these experiments and background fluorescence from individual sRNA overexpression strains were subtracted from experimental values. Unpaired two-tailed t-test with Welch's correction was used to determine significance with n.s. and * indicating not significant and significant results, respectively. The P-values are as follows: 0.0112, 0.0268 and 0.2153. (E) Northern blot analysis of FimR2 and FimR2-AA (top) showing the expression of the sRNAs upon overexpression of either sRNA or a control plasmid. Ethidium bromide staining of 5S rRNA is shown as a loading control. The asterisk (*) refers to both FimR2 and FimR2-AA (a single probe that anneals to both sRNAs was used). Pictures of bacterial cultures from the same conditions (bottom) showing the aggregation upon FimR2 overexpression. (F) Mean ± SD of fluorescence of the fliJ-RFP fusion protein following control, FimR2 or FimR2-AA overexpression (top) and RFP western-blot of the same samples (bottom). Three biological replicates were used for these experiments and background fluorescence from individual sRNA overexpression strains were subtracted from experimental values. Unpaired two-tailed t-test with Welch's correction was used to determine significance with n.s. and * indicating not significant and significant results, respectively. The P-values from bottom to top are as follows: 0.0003, 0.0250 and 0.0892.
Figure 6.
Figure 6.
FimR2 sequesters CsrA from its targets. (A) Northern blot of CsrB, 5′-tRFGly and FimR2 (top) from CsrA-his10 CoIP fractions (top) and western blot of CsrA-his10 from the same samples (bottom). Samples shown are taken from the stationary phase of growth of WT and OE (CsrA-his10 overexpression) strains. Ethidium bromide staining of 5S rRNA and tRNAs are shown as loading controls. (B) EMSA of radioactively labelled FimR2 with increasing concentrations of purified CsrA-his10. (C) EMSA of radioactively labelled FimR2-G23A-G24U (top) and FimR2-G24U (bottom) with increasing concentrations of purified CsrA-his10. (D) EMSA of radioactively labelled FimR2 ssRegion mutant with increasing concentrations of purified CsrA-his10 (as in C). Upshifts in (B–D) are marked with red asterisks. (E) RT-qPCR analysis of pgaA and (F) flhDC expression from WT, Control OE, and FimR2 OE. Samples from E (exponential phase) and S (stationary phase) are shown. Mean log2 fold change ± SEM are shown for both transcripts from three biological replicates. log2 fold change was based on comparison with exponential phase samples. Unpaired two-tailed t-test with Welch's correction was used to determine significance with * indicating significant results. The P-values are (E) 0.0058 and 0.005, (F) 0.0221 and 0.0046.
Figure 7.
Figure 7.
Salmonella FimR2S is involved in infection. (A) 5′-RACE results mapped to S. enterica fimA sequence (top) and FimR2S expression plasmid (bottom). fimA sequences from E. coli and Salmonella are shown with the stop codons indicated in red. The first 18 nucleotides of E. coli FimR2 are underlined. The predicted sequence for RNase E cleavage (AAA) in the SalmonellafimA locus is underlined (32). Sizes of recovered transcripts are indicated in bp (base pairs). (B) Northern blot analysis of FimR2S in four Salmonella strains and the E. coli K-12 strain. Total RNA samples from different time points of bacterial growth, 48 and 72 h (hours), are shown. Ethidium bromide staining of 5S rRNA is shown as a loading control. (C) Pictures of Control and FimR2S-L OE in E. coli (left) and northern blot analysis of FimR2S expression in S. enterica and E. coli upon overexpression of FimR2S-L and FimR2S-S, the long and short FimR2S variants, respectively. Ctrl designate overexpression of the control. Ethidium bromide staining of 5S rRNA is shown as a loading control. The size of the different RNA molecules is indicated on the left. (D) Northern blot analysis of FimR2 expression in S. enterica under control and FimR2 OE conditions. Ethidium bromide staining of 5S rRNA is shown as a loading control. (E) Mean ± SD of sicA-GFP fluorescence without (Control) or with FimR2S OE from six biological replicates. Unpaired two-tailed t-test with Welch's correction was used to determine significance with ** indicating significant results and P-value of 0.0086 as compared to the control samples. (F) Mean ± SD of percentage of inoculum protected from gentamicin treatment following infection of HeLa cells with an initial inoculum of SL1344 (SB300) from E (exponential phase) and S (stationary phase), and FimR2S overexpression strains, from six replicate infections. Strain SB245 served as a non-invasive negative control. Calculations were done following counting of colony forming units (CFU) of protected cells and initial inocula. Unpaired two-tailed t-test with Welch's correction was used to determine significance with * indicating significant results. The P-values are, in order, 0.0280 and 0.0010. (G) Northern blot of FimR2S (top) from CsrA-his10 CoIP fractions and western blot of CsrA-his10 from the same samples (bottom). Samples shown are taken from the stationary phase of growth of WT (Control OE) and OE (CsrA-his10 overexpression) strains. Ethidium bromide staining of 5S rRNA and tRNAs are shown as loading controls. (H) Quantitative biofilm assay showing mean ± SD OD600 of solubilized crystal violet-staining from three biological replicates from Control OE and CsrA OE strains. Unpaired two-tailed t-test with Welch's correction was used to determine significance with *** indicating significant results (P-value = 0.005).
Figure 8.
Figure 8.
Model of FimR2 function. FimR2 sRNA is processed from the fimAICDFGH transcript in stationary phase by RNase E. On the one hand, the sRNA (green) interacts with the translational regulator CsrA and antagonizes its effects, upregulating PGA synthesis, and downregulating type 1 pilus and flagellar synthesis. FimR2 upregulates type III secretion likely through the sequestration of CsrA. On the other hand FimR2 regulates in parallel several transcripts through direct base-pairing, inhibiting flagellar synthesis and upregulating HofQ-mediated import of extracellular DNA for use in catabolic reactions. The crystal structure of RNase E catalytic domain (2C4R) and the NMR structure of CsrA (1Y00) were used (56,85). This figure was created with www.biorender.com.

Similar articles

Cited by

References

    1. Kaper J.B., Nataro J.P., Mobley H.L.T.. Pathogenic Escherichia coli. Nat. Rev. Microbiol. 2004; 2:123–140. - PubMed
    1. Galán J.E. Salmonella typhimurium and inflammation: a pathogen-centric affair. Nat. Rev. Microbiol. 2021; 19:716–725. - PMC - PubMed
    1. Sy B.M., Tree J.J.. Small RNA regulation of virulence in pathogenic Escherichia coli. Front. Cell. Infect. Microbiol. 2021; 10:622202. - PMC - PubMed
    1. Martínez L.C., Yakhnin H., Camacho M.I., Georgellis D., Babitzke P., Puente J.L., Bustamante V.H.. Integration of a complex regulatory cascade involving the SirA/BarA and csr global regulatory systems that controls expression of the salmonella SPI-1 and SPI-2 virulence regulons through hilD. Mol. Microbiol. 2011; 80:1637–1656. - PMC - PubMed
    1. Bhatt S., Edwards A.N., Nguyen H.T., Merlin D., Romeo T., Kalman D. The RNA binding protein CsrA is a pleiotropic regulator of the locus of enterocyte effacement pathogenicity island of enteropathogenic Escherichia coli. Infect. Immun. 2009; 77:3552–3568. - PMC - PubMed

Publication types

MeSH terms