. 2023 Jan 18;83(2):251-263.
doi: 10.1158/0008-5472.CAN-22-1159.

MEX3A Mediates p53 Degradation to Suppress Ferroptosis and Facilitate Ovarian Cancer Tumorigenesis

Affiliations

MEX3A Mediates p53 Degradation to Suppress Ferroptosis and Facilitate Ovarian Cancer Tumorigenesis

Cheng-Kai Wang et al. Cancer Res. .

Abstract

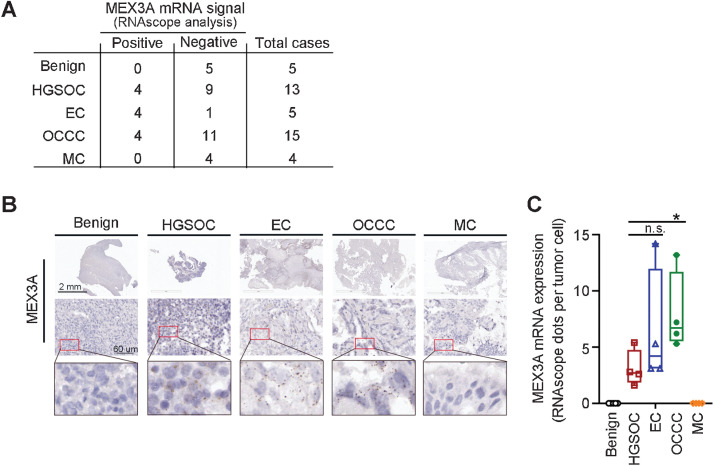
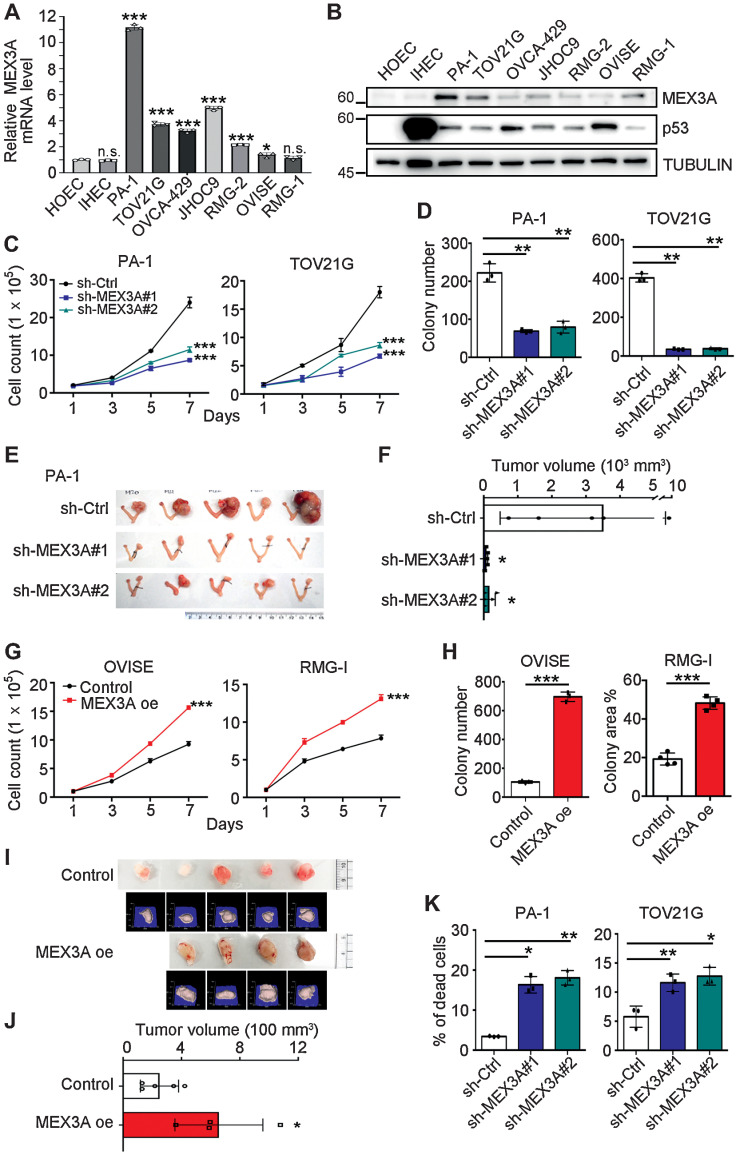
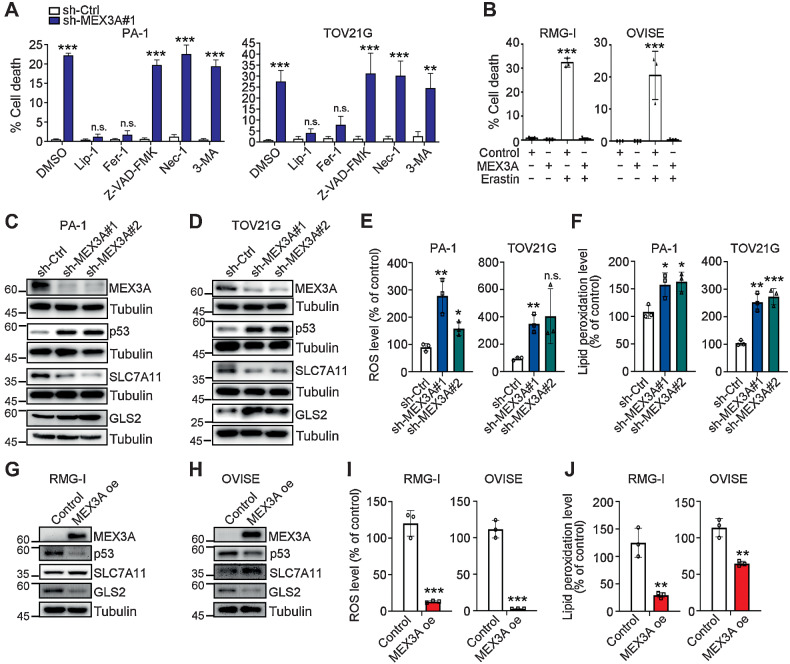
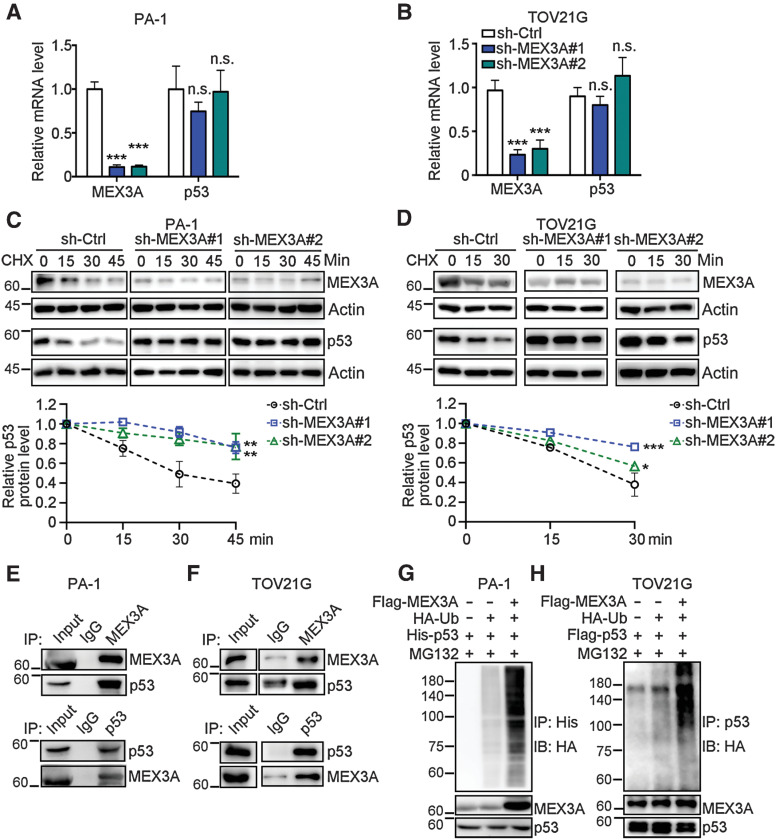
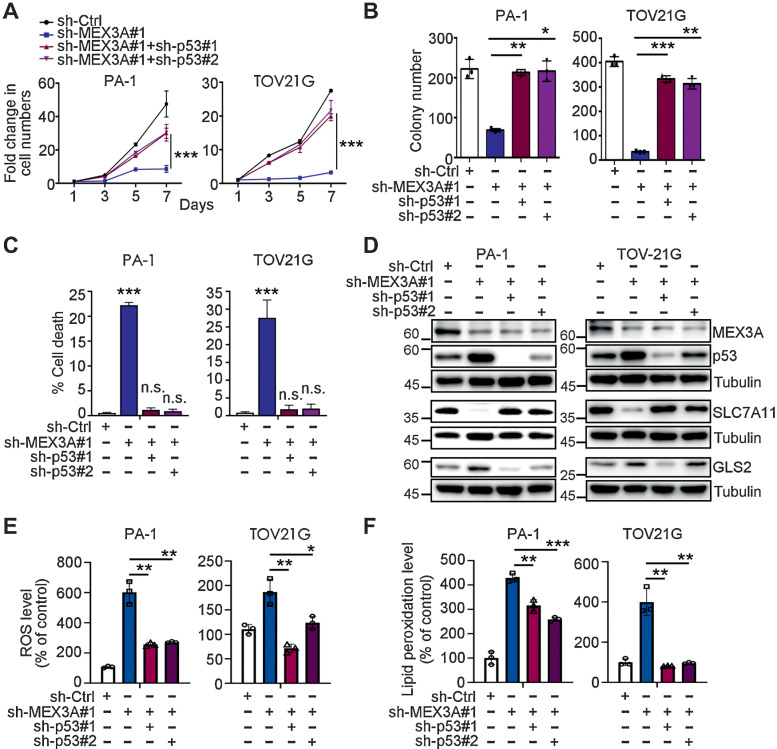
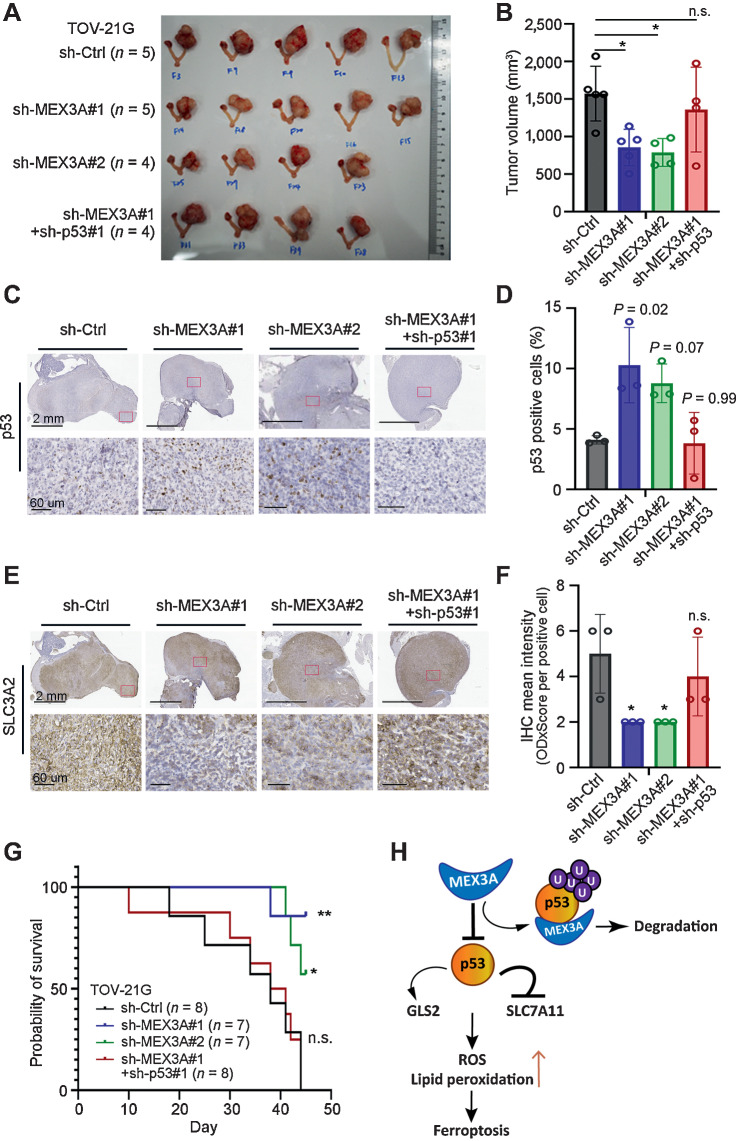
Epithelial ovarian cancer is a highly heterogeneous and malignant female cancer with an overall low survival rate. Mutations in p53 are prevalent in the major ovarian cancer histotype, high-grade serous ovarian carcinoma (HGSOC), while p53 mutations are much less frequent in other ovarian cancer subtypes, particularly in ovarian clear cell carcinoma (OCCC). Advanced stage OCCC with wild-type (WT) p53 has a worse prognosis and increased drug resistance, metastasis, and recurrence than HGSOC. The mechanisms responsible for driving the aggressiveness of WT p53-expressing ovarian cancer remain poorly understood. Here, we found that upregulation of MEX3A, a dual-function protein containing a RING finger domain and an RNA-binding domain, was critical for tumorigenesis in WT p53-expressing ovarian cancer. MEX3A overexpression enhanced the growth and clonogenicity of OCCC cell lines. In contrast, depletion of MEX3A in OCCC cells, as well as ovarian teratocarcinoma cells, reduced cell survival and proliferative ability. MEX3A depletion also inhibited tumor growth and prolonged survival in orthotopic xenograft models. MEX3A depletion did not alter p53 mRNA level but did increase p53 protein stability. MEX3A-mediated p53 protein degradation was crucial to suppress ferroptosis and enhance tumorigenesis. Consistently, p53 knockdown reversed the effects of MEX3A depletion. Together, our observations identified MEX3A as an important oncogenic factor promoting tumorigenesis in ovarian cancer cells expressing WT p53.

Significance: Degradation of p53 mediated by MEX3A drives ovarian cancer growth by circumventing p53 tumor suppressive functions, suggesting targeting MEX3A as a potential strategy for treating of ovarian cancer expressing WT p53.


Figures

Figure 1. Upregulation of MEX3A is observed in EC and OCCC subtypes, as well as HGSOC. A, Summary table of MEX3A mRNA expression detected using RNAscope analysis in an ovarian cancer cohort. B, Representative images of MEX3A RNAscope using benign and ovarian cancer tumor sections from patients. Red boxes indicate enlarged regions. Scale bars indicate 2 mm or 60 μm as shown in the images. C, Quantification and comparison of MEX3A mRNA (dots) detected by RNAscope in MEX3A-positive HGSOC, EC, and OCCC samples. Significant differences are based on unpaired t test. *, P < 0.05; n.s., not significant.
Figure 1.
Upregulation of MEX3A is observed in EC and OCCC subtypes, as well as HGSOC. A, Summary table of MEX3A mRNA expression detected using RNAscope analysis in an ovarian cancer cohort. B, Representative images of MEX3A RNAscope using benign and ovarian cancer tumor sections from patients. Red boxes indicate enlarged regions. Scale bars indicate 2 mm or 60 μm as shown in the images. C, Quantification and comparison of MEX3A mRNA (dots) detected by RNAscope in MEX3A-positive HGSOC, EC, and OCCC samples. Significant differences are based on unpaired t test. *, P < 0.05; n.s., not significant.
Figure 2. MEX3A promotes cell survival and tumorigenesis in ovarian cancer cells expressing WT p53. A, qRT-PCR analysis of MEX3A level in HOEC, IHEC, PA-1, and OCCC cells. RNA18S5 was used as an internal control. Three independent experiments were performed and data are means ± SD from one representative experiment (n = 3; *, P < 0.05; ***, P < 0.001; n.s., not significant). Significant differences are based on unpaired t test. B, IB of MEX3A and p53 protein expression with TUBULIN as a loading control. Blots shown are from one representative experiment of three replicates. C, Cell growth assays using control (sh-Ctrl) or MEX3A-depleted (sh-MEX3A #1 or #2) PA-1 and TOV21G cells. Data are shown as mean ± SD with P value based on two-way ANOVA test (n = 3; ***, P < 0.001). The experiments were repeated 3 times. D, Clonogenic assays using sh-Ctrl or sh-MEX3A PA-1 and TOV21G cells. Data are shown as mean ± SD with P value based on unpaired t test (n = 3; **, P < 0.01). The experiments were repeated 3 times. E and F, Orthotopic xenograft models in NOD/SCID mice using sh-Ctrl or sh-MEX3A PA-1 cells. Five mice were used for each group. Data are means ± SD, significant difference is based on unpaired T-test of the tumor size 8 weeks after the intra bursa injection. G, Cell growth assays using control or MEX3A overexpressing (oe) OVISE and RMG-1 cells. Data are shown as mean ± SD with p value based on two-way ANOVA-test (n = 3, ***, P < 0.001). The experiments were repeated 3 times. H, Clonogenic assays using control or MEX3A oe OVISE and RMG-1 cells. Data are shown as mean ± SD with p value based on unpaired t test (n = 4; ***, P < 0.001). The experiments were repeated 3 times. I and J, Subcutaneous xenograft models in NOD/SCID mice using control (n = 5) or MEX3A oe (n = 4) RMG-1 cells. Photographs and 3D reconstruction from stereographic tumor images are shown. Data are means ± SD, significant difference is based on unpaired t test of the tumor size 3 weeks after the injection. K, Annexin V/PI staining assays using sh-Ctrl or sh-MEX3A PA-1 and TOV21G cells. Data are shown as mean ± SD with P value based on unpaired t test (n = 3; *, P < 0.05; **, P < 0.01). The experiments were repeated 3 times.
Figure 2.
MEX3A promotes cell survival and tumorigenesis in ovarian cancer cells expressing WT p53. A, qRT-PCR analysis of MEX3A level in HOEC, IHEC, PA-1, and OCCC cells. RNA18S5 was used as an internal control. Three independent experiments were performed and data are means ± SD from one representative experiment (n = 3). *, P < 0.05; ***, P < 0.001. n.s., not significant. Significant differences are based on unpaired t test. B, IB of MEX3A and p53 protein expression with TUBULIN as a loading control. Blots shown are from one representative experiment of three replicates. C, Cell growth assays using control (sh-Ctrl) or MEX3A-depleted (sh-MEX3A #1 or #2) PA-1 and TOV21G cells. Data are shown as mean ± SD with P value based on two-way ANOVA test (n = 3). ***, P < 0.001. The experiments were repeated 3 times. D, Clonogenic assays using sh-Ctrl or sh-MEX3A PA-1 and TOV21G cells. Data are shown as mean ± SD with P value based on unpaired t test (n = 3). **, P < 0.01. The experiments were repeated 3 times. E and F, Orthotopic xenograft models in NOD/SCID mice using sh-Ctrl or sh-MEX3A PA-1 cells. Five mice were used for each group. Data are means ± SD, significant difference is based on unpaired T-test of the tumor size 8 weeks after the intra bursa injection. G, Cell growth assays using control or MEX3A overexpressing (oe) OVISE and RMG-1 cells. Data are shown as mean ± SD with p value based on two-way ANOVA-test (n = 3). ***, P < 0.001. The experiments were repeated 3 times. H, Clonogenic assays using control or MEX3A oe OVISE and RMG-1 cells. Data are shown as mean ± SD with p value based on unpaired t test (n = 4). ***, P < 0.001. The experiments were repeated 3 times. I and J, Subcutaneous xenograft models in NOD/SCID mice using control (n = 5) or MEX3A oe (n = 4) RMG-1 cells. Photographs and 3D reconstruction from stereographic tumor images are shown. Data are means ± SD, significant difference is based on unpaired t test of the tumor size 3 weeks after the injection. K, Annexin V/ PI staining assays using sh-Ctrl or sh-MEX3A PA-1 and TOV21G cells. Data are shown as mean ± SD with P value based on unpaired t test (n = 3). *, P < 0.05; **, P < 0.01. The experiments were repeated 3 times.
Figure 3. MEX3A depletion leads to ferroptosis phenotypes in WT p53 ovarian cancer cells. A, Fixable Viability Dye staining assays using sh-Ctrl or sh-MEX3A PA-1 and TOV21G cells treated with ferroptosis inhibitors (400 nmol/L Lip-1 and 5 μmol/L Fer-1), apoptosis inhibitor (10 μmol/L Z-VAD-FMK), necrosis inhibitor (10 μmol/L Nec-1), or autophagy inhibitor (1 mmol/L 3-MA). Data are shown as mean ± SD with P value based on unpaired t test (n = 4; *, P < 0.05; **, P < 0.01; n.s., not significant). The experiments were repeated 3 times. B, Fixable Viability Dye staining assays using control or MEX3A oe RMG-1 and OVISE cells treated with ferroptosis inducer (25 μmol/L and 0.1 μmol/L Erastin, respectively). Data formatting is as described for A. (n = 3; ***, P < 0.001). C and D, IB of p53, SLC7A11, and GLS2 protein expression using sh-Ctrl or sh-MEX3A PA-1 (C) and TOV21G (D) cells. TUBULIN was used as a loading control. Blots shown are from one representative experiment of three replicates. E, Reactive oxygen species (ROS) level in the sh-Ctrl or sh-MEX3A PA-1 and TOV21G cells were detected by CM-H2DCFDA. Relative CM-H2DCFDA mean fluorescence intensity is presented as percent of control. Three independent experiments were performed and data are means ± SD from one representative experiment (n = 3). Significant differences are based on unpaired t test (n = 3; *, P < 0.05; **, P < 0.01; n.s., not significant). F, Lipid peroxidation level in the sh-Ctrl or sh-MEX3A PA-1 and TOV21G cells detected by BODIPY-C11 staining. Relative BODIPY-C11 mean fluorescence intensity is presented as percent of control. Three independent experiments were performed and data are means ± SD from one representative experiment (n = 3). Significant differences are based on unpaired t test (n = 3; *, P < 0.05; **, P < 0.01; ***, P < 0.001). G and H, IB of p53, SLC7A11, and GLS2 protein expression using control or MEX3A oe RMG-1 (G) and OVISE (H) cells. TUBULIN was used as a loading control. Blots shown are from one representative experiment of three replicates. I, ROS level in the control or MEX3A oe RMG-1 and OVISE cells detected by CM-H2DCFDA. Data formatting is as described for E. J, Lipid peroxidation level in the control or MEX3A oe RMG-1 and OVISE cells detected by BODIPY-C11 staining. Data formatting is as described for F.
Figure 3.
MEX3A depletion leads to ferroptosis phenotypes in WT p53 ovarian cancer cells. A, Fixable Viability Dye staining assays using sh-Ctrl or sh-MEX3A PA-1 and TOV21G cells treated with ferroptosis inhibitors (400 nmol/L Lip-1 and 5 μmol/L Fer-1), apoptosis inhibitor (10 μmol/L Z-VAD-FMK), necrosis inhibitor (10 μmol/L Nec-1), or autophagy inhibitor (1 mmol/L 3-MA). Data are shown as mean ± SD with P value based on unpaired t test (n = 4). *, P < 0.05; **, P < 0.01. n.s., not significant. The experiments were repeated 3 times. B, Fixable Viability Dye staining assays using control or MEX3A oe RMG-1 and OVISE cells treated with ferroptosis inducer (25 μmol/L and 0.1 μmol/L Erastin, respectively). Data formatting is as described for A. (n = 3). ***, P < 0.001. C and D, IB of p53, SLC7A11, and GLS2 protein expression using sh-Ctrl or sh-MEX3A PA-1 (C) and TOV21G (D) cells. TUBULIN was used as a loading control. Blots shown are from one representative experiment of three replicates. E, Reactive oxygen species (ROS) level in the sh-Ctrl or sh-MEX3A PA-1 and TOV21G cells were detected by CM-H2DCFDA. Relative CM-H2DCFDA mean fluorescence intensity is presented as percent of control. Three independent experiments were performed and data are means ± SD from one representative experiment (n = 3). Significant differences are based on unpaired t test (n = 3). *, P < 0.05; **, P < 0.01. n.s., not significant. F, Lipid peroxidation level in the sh-Ctrl or sh-MEX3A PA-1 and TOV21G cells detected by BODIPY-C11 staining. Relative BODIPY-C11 mean fluorescence intensity is presented as percent of control. Three independent experiments were performed and data are means ± SD from one representative experiment (n = 3). Significant differences are based on unpaired t test (n = 3). *, P < 0.05; **, P < 0.01; ***, P < 0.001. G and H, IB of p53, SLC7A11, and GLS2 protein expression using control or MEX3A oe RMG-1 (G) and OVISE (H) cells. TUBULIN was used as a loading control. Blots shown are from one representative experiment of three replicates. I, ROS level in the control or MEX3A oe RMG-1 and OVISE cells detected by CM-H2DCFDA. Data formatting is as described for E. J, Lipid peroxidation level in the control or MEX3A oe RMG-1 and OVISE cells detected by BODIPY-C11 staining. Data formatting is as described for F.
Figure 4. MEX3A-promotes ubiquitination to destabilize p53. A and B, qRT-PCR analysis of MEX3A and p53 expression in sh-Ctrl or sh-MEX3A PA-1 (A) and TOV21G (B) cells. RNA18S5 was used as an internal control. Three independent experiments were performed and data are means ± SD from one representative experiment. Significant differences are based on unpaired t test (n = 3; ***, P < 0.001; n.s., not significant). C and D, Time course assay using CHX (20 μmol/L) treated sh-Ctrl or sh-MEX3A PA-1 (C) and TOV21G (D) cells. The levels of endogenous MEX3A and p53 were determined using IB analysis. ACTIN was used as a loading control. For each cell, quantification of relative endogenous p53 protein levels from three independent experiments was shown. Data are means ± SD. Significant differences are based on two-way ANOVA test (*, P < 0.05; **, P < 0.01; ***, P < 0.001). E and F, Co-immunoprecipitation (Co-IP) and reciprocal Co-IP assays of MEX3A and p53 using PA-1 (E) and TOV21G (F) cells. Cell lysates were IP with indicated antibodies and analyzed by IB assay. Normal IgG was used as an IP control. G, IP-IB of ubiquitinated p53 using PA-1 cells transfected with Flag-tagged MEX3A, His-tagged p53 and/or HA-tagged ubiquitin and treated with MG132 (20 μmol/L). Total. His-p53 proteins were immunoprecipitated and ubiquitinated His-p53 species detected. H, IP-IB of ubiquitinated p53 using TOV21G cells transfected with Flag-tagged MEX3A, Flag-tagged p53 and/or HA-tagged ubiquitin and treated with MG132 (20 μmol/L). Total p53 proteins were immunoprecipitated and ubiquitinated p53 species detected.
Figure 4.
MEX3A-promotes ubiquitination to destabilize p53. A and B, qRT-PCR analysis of MEX3A and p53 expression in sh-Ctrl or sh-MEX3A PA-1 (A) and TOV21G (B) cells. RNA18S5 was used as an internal control. Three independent experiments were performed and data are means ± SD from one representative experiment. Significant differences are based on unpaired t test (n = 3). ***, P < 0.001. n.s., not significant. C and D, Time course assay using CHX (20 μmol/L) treated sh-Ctrl or sh-MEX3A PA-1 (C) and TOV21G (D) cells. The levels of endogenous MEX3A and p53 were determined using IB analysis. ACTIN was used as a loading control. For each cell, quantification of relative endogenous p53 protein levels from three independent experiments was shown. Data are means ± SD. Significant differences are based on two-way ANOVA test. *, P < 0.05; **, P < 0.01; ***, P < 0.001. E and F, Coimmunoprecipitation and reciprocal coimmunoprecipitation assays of MEX3A and p53 using PA-1 (E) and TOV21G (F) cells. Cell lysates were IP with indicated antibodies and analyzed by IB assay. Normal IgG was used as an IP control. G, IP-IB of ubiquitinated p53 using PA-1 cells transfected with Flag-tagged MEX3A, His-tagged p53 and/or HA-tagged ubiquitin and treated with MG132 (20 μmol/L). Total. His-p53 proteins were immunoprecipitated and ubiquitinated His-p53 species detected. H, IP-IB of ubiquitinated p53 using TOV21G cells transfected with Flag-tagged MEX3A, Flag-tagged p53 and/or HA-tagged ubiquitin and treated with MG132 (20 μmol/L). Total p53 proteins were immunoprecipitated and ubiquitinated p53 species detected.
Figure 5. p53 knockdown reverses the increased ferroptosis phenotype of MEX3A-depleted WT p53 ovarian cancer cells. A, Cell growth assays using sh-Ctrl, sh-MEX3A or MEX3A/p53-double knockdown PA-1 and TOV21G cells. Data are shown as mean ± SD with P value based on two-way ANOVA test (n = 3; ***, P < 0.001). The experiments were repeated 3 times. B, Clonogenic assays using sh-Ctrl, sh-MEX3A, or MEX3A/p53-double knockdown PA-1 and TOV21G cells. Data are shown as mean ± SD with P value based on unpaired t test (n = 3; *, P < 0.05; **, P < 0.01; ***, P < 0.001). The experiments were repeated 3 times. C, Fixable Viability Dye staining assays using sh-Ctrl, sh-MEX3A, or MEX3A/p53-double knockdown PA-1 and TOV21G cells. Data are shown as mean ± SD with P value based on unpaired t test (n = 3; ***, P < 0.001; n.s., not significant). The experiments were repeated 3 times. D, IB of MEX3A, p53, SLC7A11, and GLS2 protein expression using sh-Ctrl, sh-MEX3A, or MEX3A/p53-double knockdown PA-1 and TOV21G cells. TUBULIN was used as a loading control. Blots shown are from one representative experiment of three replicates. E, ROS level in sh-Ctrl, sh-MEX3A or MEX3A/p53-double knockdown PA-1 and TOV21G cells detected by CM-H2DCFDA. Relative CM-H2DCFDA mean fluorescence intensity is presented as percent of control. Three independent experiments were performed and data are means ± SD from one representative experiment. Significant differences are based on unpaired t test (n = 3; *, P < 0.05; **, P < 0.01). F, Lipid peroxidation level in sh-Ctrl, sh-MEX3A, or MEX3A/p53-double knockdown PA-1 and TOV21G detected by BODIPY-C11 staining. Relative BODIPY-C11 mean fluorescence intensity is presented as percent of control. Three independent experiments were performed and data are means ± SD from one representative experiment. Significant differences are based on unpaired t test (n = 3; **, P < 0.01; ***, P < 0.001).
Figure 5.
p53 knockdown reverses the increased ferroptosis phenotype of MEX3A-depleted WT p53 ovarian cancer cells. A, Cell growth assays using sh-Ctrl, sh-MEX3A or MEX3A/p53-double knockdown PA-1 and TOV21G cells. Data are shown as mean ± SD with P value based on two-way ANOVA test (n = 3). ***, P < 0.001. The experiments were repeated 3 times. B, Clonogenic assays using sh-Ctrl, sh-MEX3A, or MEX3A/p53-double knockdown PA-1 and TOV21G cells. Data are shown as mean ± SD with P value based on unpaired t test (n = 3). *, P < 0.05; **, P < 0.01; ***, P < 0.001. The experiments were repeated 3 times. C, Fixable Viability Dye staining assays using sh-Ctrl, sh-MEX3A, or MEX3A/p53-double knockdown PA-1 and TOV21G cells. Data are shown as mean ± SD with P value based on unpaired t test (n = 3). ***, P < 0.001. n.s., not significant. The experiments were repeated 3 times. D, IB of MEX3A, p53, SLC7A11, and GLS2 protein expression using sh-Ctrl, sh-MEX3A, or MEX3A/p53-double knockdown PA-1 and TOV21G cells. TUBULIN was used as a loading control. Blots shown are from one representative experiment of three replicates. E, ROS level in sh-Ctrl, sh-MEX3A or MEX3A/p53-double knockdown PA-1 and TOV21G cells detected by CM-H2DCFDA. Relative CM-H2DCFDA mean fluorescence intensity is presented as percent of control. Three independent experiments were performed and data are means ± SD from one representative experiment. Significant differences are based on unpaired t test (n = 3). *, P < 0.05; **, P < 0.01. F, Lipid peroxidation level in sh-Ctrl, sh-MEX3A, or MEX3A/p53-double knockdown PA-1 and TOV21G detected by BODIPY-C11 staining. Relative BODIPY-C11 mean fluorescence intensity is presented as percent of control. Three independent experiments were performed and data are means ± SD from one representative experiment. Significant differences are based on unpaired t test (n = 3). **, P < 0.01; ***, P < 0.001.
Figure 6. p53 downregulation is required for MEX3A to promote tumorigenesis and drug resistance in WT p53 ovarian cancer. A and B, Orthotopic xenograft tumors derived from TOV21G cells without or with MEX3A depletion or MEX3A/p53-double knockdown (B). Tumor volume was plotted (C). Data are presented as mean ± SD. Significant difference is based on unpaired t test (*, P < 0.05; n.s., not significant). C–F, Representative images of p53 (C and D) and SLC3A2 (E and F) IHC staining using serial tumor sections from the orthotopic xenograft mice in A. Red boxes indicate the enlarged regions. Scale bars indicate 2 mm or 60 μmol/L as shown in the images. For each group, numbers of p53-positive cells (D) and SLC3A2 expression level (F) from three tumors were evaluated. Data are presented as mean ± SD. Significant difference compared with the sh-Ctrl group is based on unpaired t test (*, P < 0.05; n.s., not significant). G, Kaplan–Meier overall survival analysis of NOD/SCID mice intra bursal injected with sh-Ctrl (black line), sh-MEX3A (blue and green lines), or MEX3A/p53-double knockdown (sh-MEX3A#1+sh-p53#1, red line) TOV21G cells. Significant differences are based on log-rank test (*, P < 0.05; **, P < 0.01; n.s., not significant). H, Model of MEX3A-mediated ferroptosis inhibition in ovarian cancer harboring WT p53. p53 induces ferroptosis by repressing SLC7A11 and upregulating GLS2 expression. In WT p53 ovarian cancer cells, MEX3A destabilize p53 protein by ubiquitination. Downregulation of WT p53 protein is essential for MEX3A to inhibit ferroptosis-induced cell death.
Figure 6.
p53 downregulation is required for MEX3A to promote tumorigenesis and drug resistance in WT p53 ovarian cancer. A and B, Orthotopic xenograft tumors derived from TOV21G cells without or with MEX3A depletion or MEX3A/p53-double knockdown (B). Tumor volume was plotted (C). Data are presented as mean ± SD. Significant difference is based on unpaired t test. *, P < 0.05. n.s., not significant. C–F, Representative images of p53 (C and D) and SLC3A2 (E and F) IHC staining using serial tumor sections from the orthotopic xenograft mice in A. Red boxes indicate the enlarged regions. Scale bars, 2 mm or 60 μm as shown in the images. For each group, numbers of p53-positive cells (D) and SLC3A2 expression level (F) from three tumors were evaluated. Data are presented as mean ± SD. Significant difference compared with the sh-Ctrl group is based on unpaired t test. *, P < 0.05. n.s., not significant. G, Kaplan–Meier overall survival analysis of NOD/SCID mice intrabursally injected with sh-Ctrl (black line), sh-MEX3A (blue and green lines), or MEX3A/p53-double knockdown (sh-MEX3A#1+sh-p53#1, red line) TOV21G cells. Significant differences are based on log-rank test. *, P < 0.05; **, P < 0.01. n.s., not significant. H, Model of MEX3A-mediated ferroptosis inhibition in ovarian cancer harboring WT p53. p53 induces ferroptosis by repressing SLC7A11 and upregulating GLS2 expression. In WT p53 ovarian cancer cells, MEX3A destabilize p53 protein by ubiquitination. Downregulation of WT p53 protein is essential for MEX3A to inhibit ferroptosis-induced cell death.

References

    1. Torre LA, Bray F, Siegel RL, Ferlay J, Lortet-Tieulent J, Jemal A. Global cancer statistics, 2012. CA Cancer J Clin 2015;65:87–108. - PubMed
    1. Doherty JA, Peres LC, Wang C, Way GP, Greene CS, Schildkraut JM. Challenges and opportunities in studying the epidemiology of ovarian cancer subtypes. Curr Epidemiol Rep 2017;4:211–20. - PMC - PubMed
    1. Reid BM, Permuth JB, Sellers TA. Epidemiology of ovarian cancer: a review. Cancer Biol Med 2017;14:9–32. - PMC - PubMed
    1. Walsh T, Casadei S, Lee MK, Pennil CC, Nord AS, Thornton AM, et al. . Mutations in 12 genes for inherited ovarian, fallopian tube, and peritoneal carcinoma identified by massively parallel sequencing. Proc Natl Acad Sci USA 2011;108:18032–7. - PMC - PubMed
    1. Seidman JD, Horkayne-Szakaly I, Haiba M, Boice CR, Kurman RJ, Ronnett BM. The histologic type and stage distribution of ovarian carcinomas of surface epithelial origin. Int J Gynecol Pathol 2004;23:41–4. - PubMed

Publication types

MeSH terms