Meta-Analysis
. 2022 Oct 29;12(11):938.
doi: 10.3390/bios12110938.

An Experimental Framework for Developing Point-of-Need Biosensors: Connecting Bio-Layer Interferometry and Electrochemical Impedance Spectroscopy

Affiliations
Meta-Analysis

An Experimental Framework for Developing Point-of-Need Biosensors: Connecting Bio-Layer Interferometry and Electrochemical Impedance Spectroscopy

Sadia Fida Ullah et al. Biosensors (Basel). .

Abstract

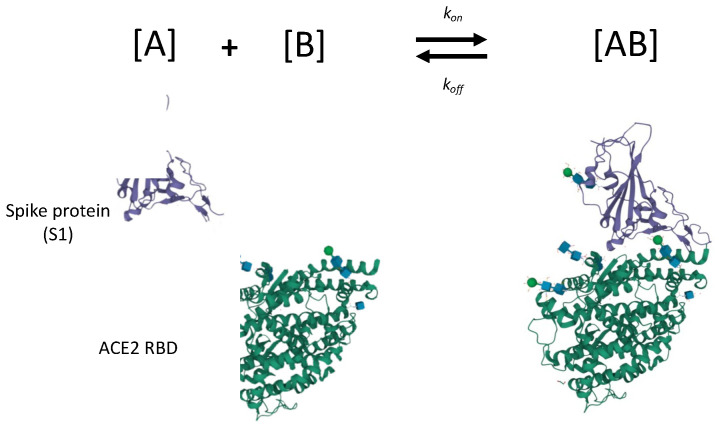
Biolayer interferometry (BLI) is a well-established laboratory technique for studying biomolecular interactions important for applications such as drug development. Currently, there are interesting opportunities for expanding the use of BLI in other fields, including the development of rapid diagnostic tools. To date, there are no detailed frameworks for implementing BLI in target-recognition studies that are pivotal for developing point-of-need biosensors. Here, we attempt to bridge these domains by providing a framework that connects output(s) of molecular interaction studies with key performance indicators used in the development of point-of-need biosensors. First, we briefly review the governing theory for protein-ligand interactions, and we then summarize the approach for real-time kinetic quantification using various techniques. The 2020 PRISMA guideline was used for all governing theory reviews and meta-analyses. Using the information from the meta-analysis, we introduce an experimental framework for connecting outcomes from BLI experiments (KD, kon, koff) with electrochemical (capacitive) biosensor design. As a first step in the development of a larger framework, we specifically focus on mapping BLI outcomes to five biosensor key performance indicators (sensitivity, selectivity, response time, hysteresis, operating range). The applicability of our framework was demonstrated in a study of case based on published literature related to SARS-CoV-2 spike protein to show the development of a capacitive biosensor based on truncated angiotensin-converting enzyme 2 (ACE2) as the receptor. The case study focuses on non-specific binding and selectivity as research goals. The proposed framework proved to be an important first step toward modeling/simulation efforts that map molecular interactions to sensor design.

Keywords: SARS-CoV-2; analytical sensing; binding kinetics; biosensor design; molecular affinity; protein–protein interaction.


Conflict of interest statement

The authors declare no conflict of interest.

Figures

Figure 8
Figure 8
Schematic for binding of recombinant spike protein (subunit 1 core; recognition binding motif (RBM) not shown) and truncated ACE2 recognition binding domain (RBD). Each recombinant protein is truncated for experimental isolation of binding kinetics (e.g., enzymatic portion of ACE2 is cleaved). Most experimental studies focus on binding truncated ACE2 RBD with spike protein subunit 1 (shown here), and subunit 2, but few focus on inactivated SARS-CoV-2 virion. Crystal structures of spike protein subunit 1 and ACE2 are courtesy of Shang et al. [92]; program by Sehnal et al. [28] used for modification and export.
Figure 1
Figure 1
There is a need for frameworks which delineate the relationship between biomolecular interaction studies and biosensor development. High throughput instruments and in silico models for studying biomolecular interactions facilitate detailed characterization of receptor-target affinity under controlled conditions. Biosensor performance is based on knowledge of biomolecular interactions and kinetics, but have relatively low throughput. This article reviews key literature and proposes an experimental approach which may initiate development of a biosensor development framework. We propose one aspect of such a larger framework, focusing on experimental data and we establish an eight-step process. We apply this in a case study that focuses on SARS-CoV-2, utilizing biosensor development data collected from 2020–2022 in response to the COVID-19 pandemic.
Figure 2
Figure 2
Meta-analysis focused on literature that discusses biomolecular interactions and/or biosensor design.
Figure 3
Figure 3
Symbolic and particulate schematics for (A) binding (top) and (B) binding + reaction (bottom). Although the derivation of the two model systems uses a similar approach, the mathematical underpinnings are quite different, and derivation is based on mutually exclusive assumptions. In panel A, the particulate representation uses a generic monomer as receptor (ligand) and truncated epitope (target). Binding (complex formation) is represented as the blue halo. In panel B, the particulate representation depicts oxidation of β-D-glucose (red halo) to gluconolactone (green halo) and hydrogen peroxide (yellow halo) by the enzyme glucose oxidase (Gox), oxygen (O2) is not shown. 3D structure is available in the Protein Data Base (PDB), according to Wohlfahrtet et al. [27] and Sehnal et al. [28].
Figure 4
Figure 4
Experimental steps and representative (ideal) sensorgrams in a BLI assay based on Streptavidin fibers (SA biosensors) biosensors. Experimental steps showing the initial baseline in buffer (1), ligand loading using the streptavidin-biotin coupling method (2), baseline equilibration for drift correction in buffer (3), association with target analyte (4), and dissociation of ligand-analyte complex (5) (Figure created in BioRender (accessed on 5 May 2022)). Note that the loading plot shown here is for 100% surface coverage, which is not ideal for kinetic studies due to steric hindrance.
Figure 5
Figure 5
Plate layout for a typical BLI binding kinetics experimental plan in a 96 microwell format.
Figure 6
Figure 6
Framework for using structural predictions and receptor-target interaction studies (current rational design framework) to guide biosensor development. The three key domains of are structural analysis of ligand(s), experimental interaction studies, and biosensor development. These often occur in iteration, and the diagram is not intended to be restrictive by use of arrows. The proposed framework is outcome-based and focuses on six key performance indicators (KPI).
Figure 7
Figure 7
Flowchart for applying framework. Experimental design and iteration in steps 5–7 should always consider the study goal, intended use, and research question of the study as a guide for decision-making. This process also facilitates updating the quality literature review (use of PRISMA framework is highly suggested). Green arrows indicate that the prototype meets the requirements, and we can move to the next process step. Red arrows indicate that the prototype does not meet the specified requirements and an iteration to prior step(s) is required.
Figure 9
Figure 9
BLI sensorgrams for ACE2xDELTA in bicarbonate buffer at 30 °C. (A) Representative sensogram for ACE2xDELTA in bicarbonate buffer at 30 °C. Regions of ligand loading, analyte association, and disassociation are indicated at the top of the time series plot. The assay was conducted over concentrations that span the binding regime and the titration regime. (B) Association and dissociation curve for DELTA using [biot]ACE2 on SAV-coated fibers as the ligand in bicarbonate buffer at 30 °C.
Figure 10
Figure 10
Representative association and dissociation curves for binding assay of ACE2 (ligand) towards target-analyte (SARS-CoV-2) and non-target analytes (Seasonal viruses).
Figure 11
Figure 11
Representative capacitance response of ACE2-based biosensor for matrix effects (saliva target-free), negative control (common cold virus at 1000 copies/mL), and target (SARS-CoV-2 DELTA at 1000 copies/mL). Error bars represent standard deviation from the mean measurement (n = 3). Same letters represent groups with no significant difference (p < 0.05).

Similar articles

Cited by

References

    1. Petersen R.L. Strategies Using Bio-Layer Interferometry Biosensor Technology for Vaccine Research and Development. Biosensors. 2017;7:49. doi: 10.3390/bios7040049. - DOI - PMC - PubMed
    1. Kumar N., Shetti N.P., Jagannath S., Aminabhavi T.M. Electrochemical sensors for the detection of SARS-CoV-2 virus. Chem. Eng. J. 2022;430:3. doi: 10.1016/j.cej.2021.132966. - DOI - PMC - PubMed
    1. Goud K.Y., Reddy K.K., Khorshed A., Kumar V.S., Mishra R.K., Oraby M., Ibrahim A.H., Kim H., Gobi K.V. Electrochemical diagnostics of infectious viral diseases: Trends and challenges. Biosens. Bioelectron. 2021;180:113112. doi: 10.1016/j.bios.2021.113112. - DOI - PMC - PubMed
    1. Murali S., Rustandi R.R., Zheng X., Payne A., Shang L. Applications of Surface Plasmon Resonance and Biolayer Interferometry for Virus–Ligand Binding. Viruses. 2022;14:717. doi: 10.3390/v14040717. - DOI - PMC - PubMed
    1. Stoltenburg R., Schubert T., Strehlitz B. In vitro Selection and Interaction Studies of a DNA Aptamer Targeting Protein A. PLoS ONE. 2015;10:e0134403. doi: 10.1371/journal.pone.0134403. - DOI - PMC - PubMed

Publication types

Substances