. 2022 Nov 7;12(11):980.
doi: 10.3390/bios12110980.

Lateral Flow Microimmunoassay (LFµIA) for the Reliable Quantification of Allergen Traces in Food Consumables

Affiliations

Lateral Flow Microimmunoassay (LFµIA) for the Reliable Quantification of Allergen Traces in Food Consumables

Amadeo Sena-Torralba et al. Biosensors (Basel). .

Abstract

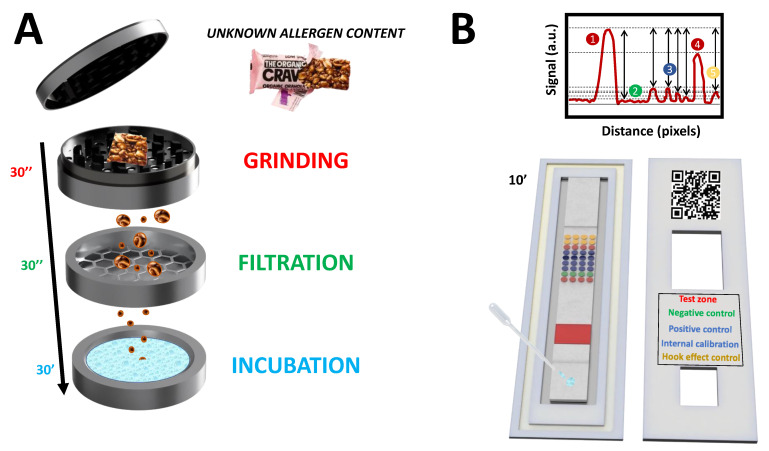
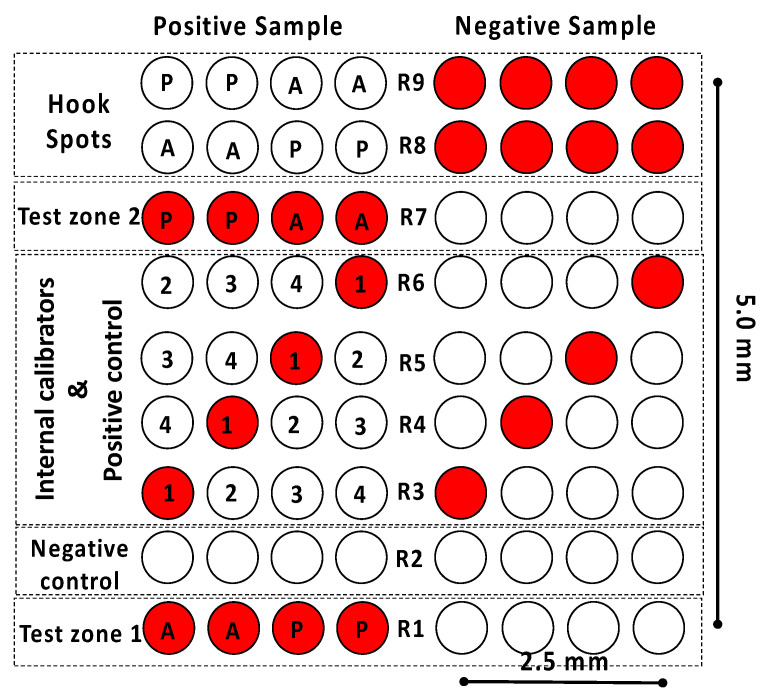
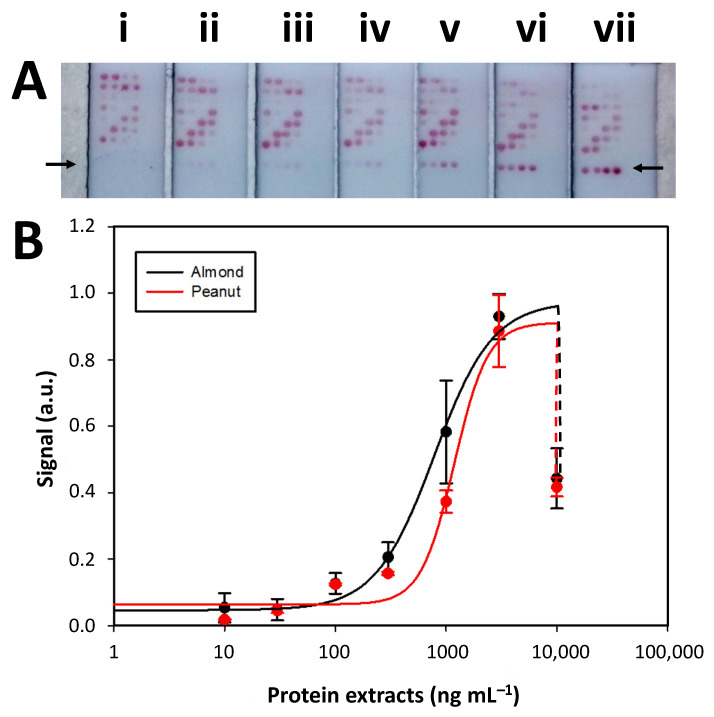
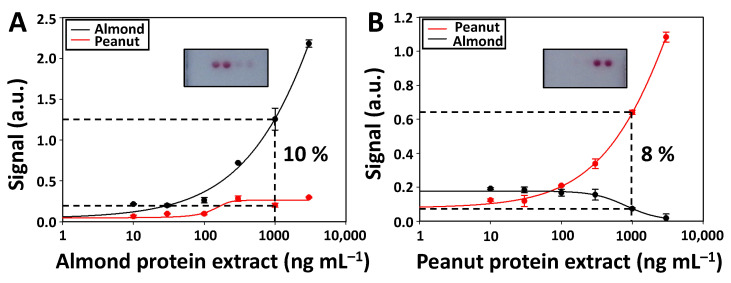
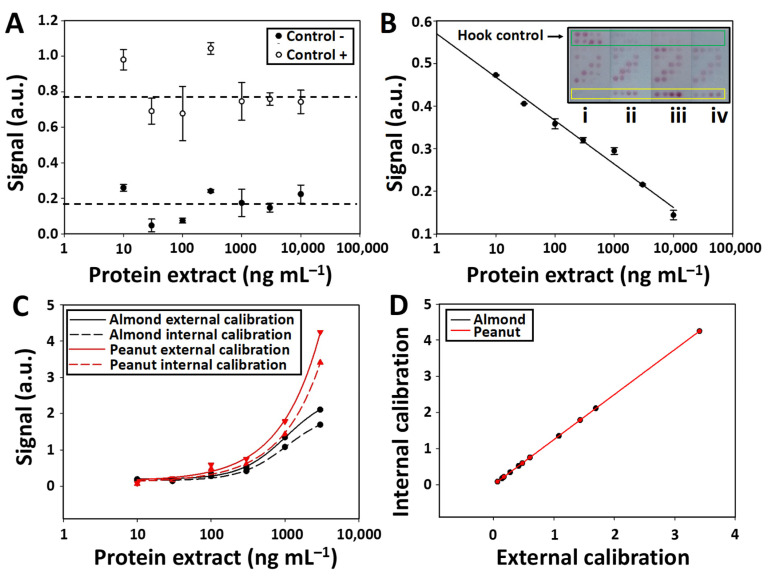
Quality assurance and food safety are of great concern within the food industry because of unknown quantities of allergens often present in food. Therefore, there is an ongoing need to develop rapid, sensitive, and easy to use methods that serve as an alternative to mass spectrometry and enzyme-linked immunosorbent assay (ELISA) for monitoring food safety. Lateral flow immunoassay is one of the most used point-of-need devices for clinical, environmental, and food safety applications. Compared to traditional methods, it appears to be a simple and fast alternative for detecting food allergens. However, its reliability is frequently questioned due to the lack of quantitative information. In this study, a lateral flow microimmunoassay (LFµIA) is presented that integrates up to 36 spots in microarray format in a single strip, providing semi-quantitative information about the level of allergens, positive and negative controls, internal calibration, and hook effect. The LFµIA has been evaluated for the on-site simultaneous and reliable quantification of almond and peanut allergens as a proof of concept, demonstrating high sensitivity (185 and 229 µg/kg, respectively), selectivity (77%), and accuracy (RSD 5-25%) when analyzing commercial allergen-suspicious food consumables.

Keywords: food-borne allergens; internal calibration; lateral flow immunoassay; microarray; multiplexing; nanoparticles; smartphone.


Conflict of interest statement

The authors declare no conflict of interest.

Figures

Figure 1
Figure 1
Schematic representation of (A) the portable device that contains all the elements required for the on-site extraction of the allergenic proteins. Specifically, these elements enable the grinding (30 s), filtration (30 s), and incubation of the sample with the extraction buffer for 30 min. (B) The proposed AuNPs-based LFµIA with microarray layout contains replicate assays for the in-situ detection of peanut and almond allergens, an internal signal calibration, and positive, negative, and hook effect control assays in 10 min.
Figure 2
Figure 2
Schematic representation of the microarray layout, representing the expected results of positive and negative samples. In test zones 1 and 2, the antibody against almond (A) and peanut proteins (P) are immobilized in rows R1 and R7, respectively, bovine serum albumin (negative control) in row R2, the secondary antibody against rabbit IgG (internal calibrators 1–4) in rows R3–R6, and almond and peanut proteins in rows R8 and R9 (hook spots).
Figure 3
Figure 3
(A) Picture of the LFµIA strips after simultaneously detecting (i) 0, (ii) 10, (iii) 30, (iv) 100, (v) 300, (vi) 1000, and (vii) 3000 ng mL−1 of almond- and peanut-extracted proteins. (B) Normalized (min–max) calibration curves obtained when quantifying the mean signal generated in test zone 1 (row R1). Error bars show the standard deviation of 3 replicates.
Figure 4
Figure 4
Cross-reactivity (%) between the assays corresponding to the first test zone (row 1) when analyzing 1000 ng mL−1 of (A) almond and (B) peanut protein extract. Inset showing the picture of the first test zone (row 1) after performing the cross-reactivity assay with 1000 ng mL−1 of almond and peanut protein extract. The signals correspond to the mean value of 3 replicates, while the error bars show the standard deviation.
Figure 5
Figure 5
(A) Normalized (min–max) mean signal intensities in the positive (spots 3A, 4B, 5C, 6D) and negative (row R2) control assays. (B) Normalized mean signal intensities in the hook effect control assays (rows R8 and R9) when detecting serial dilutions of the protein extracts (10, 30, 100, 300, 1000, 3000, and 10,000 ng mL−1). (B inset) Picture of the strips after the detection (i) 0, (ii) 1000, (iii) 3000, and (iv) 10,000 ng mL−1 of the protein extracts. (C) Comparison of the mean signal ratio of the internal calibration curves (rows R3–R6) with the signal intensities of the external calibration curves (row R1) achieved when detecting serial dilutions of the protein extracts (10, 30, 100, 300, 1000, 3000, and 10,000 ng mL−1). (D) Mean signal intensity relationship between the internal and external calibration curves. Error bars show the standard deviation of 3 replicates.

Similar articles

Cited by

References

    1. Ebisawa M., Pawankar R. Food Allergy—A Rising Global Health Problem; Proceedings of the World Allergy Week; Virtual. 8–14 April 2013.
    1. Protect Yourself from Food Allergies. [(accessed on 18 June 2021)]; Available online: https://www.foodsafety.gov/blog/protect-yourself-food-allergies.
    1. United States Anaphylaxis Markets, 2020–2021 & Forecast to 2027. [(accessed on 18 June 2021)]. Available online: https://www.prnewswire.com/news-releases/united-states-anaphylaxis-marke....
    1. r-biopharm RIDA®QUICK Gliadin Art. No. R7003. [(accessed on 18 June 2021)]. Available online: https://food.r-biopharm.com/es/productos/ridaquick-gliadin2/
    1. Romerlabs AgraStrip: Allergen Lateral Flow Devices. [(accessed on 18 June 2021)]. Available online: https://www.romerlabs.com/shop/inter_en/test-kits/lateral-flow-devices/a...