Review
. 2022 Nov 7;12(11):982.
doi: 10.3390/bios12110982.

MXene-Based Nucleic Acid Biosensors for Agricultural and Food Systems

Affiliations
Review

MXene-Based Nucleic Acid Biosensors for Agricultural and Food Systems

Weizheng Wang et al. Biosensors (Basel). .

Abstract

MXene is a two-dimensional (2D) nanomaterial that exhibits several superior properties suitable for fabricating biosensors. Likewise, the nucleic acid (NA) in oligomerization forms possesses highly specific biorecognition ability and other features amenable to biosensing. Hence the combined use of MXene and NA is becoming increasingly common in biosensor design and development. In this review, MXene- and NA-based biosensors are discussed in terms of their sensing mechanisms and fabrication details. MXenes are introduced from their definition and synthesis process to their characterization followed by their use in NA-mediated biosensor fabrication. The emphasis is placed on the detection of various targets relevant to agricultural and food systems, including microbial pathogens, chemical toxicants, heavy metals, organic pollutants, etc. Finally, current challenges and future perspectives are presented with an eye toward the development of advanced biosensors with improved detection performance.

Keywords: MXene; agricultural and food system; biosensors; contaminants; nucleic acid.


Conflict of interest statement

The authors declare no conflict of interest.

Figures
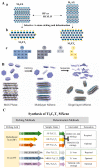
Figure 1
Figure 1
(A) MAX phase and its etched products. (a) Three typical MAX phase structures with selective etching sites (atoms in red). (b) Selectively etched products (MXene) with surface modification (atoms in yellow). (c) Atoms in MAX phases and MXene structures. Redrawn based on Ref. [11]. (B) Illustration for MXene top-down synthesized process from its precursor. Reproduced from Ref. [18]. (C) General idea for MXene top-down etched from MAX phases with two typical routes. Redrawn with permission from Ref. [21].
Figure 2
Figure 2
(A). (a) Schematic of Ti3C2Tx MXene synthesis via HF-etching. The SEM images for (b) Ti3AlC2 MAX phase, (c) multilayer Ti3C2Tx MXene, (d) delaminated Ti3C2Tx MXene nanosheets. Reproduced with permission from Refs. [24,28]. (B). (a) Ti2C MXene synthesis process. (b,c) TEM for exfoliated Ti2C MXene nanosheets. Reproduced with permission from Ref. [30]. (d) X-ray diffraction spectra for Ti3C2 MXene its MAX phase precursor. Reproduced with permission from Ref. [31].
Figure 2
Figure 2
(A). (a) Schematic of Ti3C2Tx MXene synthesis via HF-etching. The SEM images for (b) Ti3AlC2 MAX phase, (c) multilayer Ti3C2Tx MXene, (d) delaminated Ti3C2Tx MXene nanosheets. Reproduced with permission from Refs. [24,28]. (B). (a) Ti2C MXene synthesis process. (b,c) TEM for exfoliated Ti2C MXene nanosheets. Reproduced with permission from Ref. [30]. (d) X-ray diffraction spectra for Ti3C2 MXene its MAX phase precursor. Reproduced with permission from Ref. [31].
Figure 3
Figure 3
(A) Illustrative diagram for the Mo2C products growth under the high and low flow rates of CH4 gas. (B) Surface morphology of synthesis crystals: (a,c) Mo2C crystals’ physical distribution on Cu surface and graphene under optical images under low (a) and high (c) CH4 flow rates; (b,d) topological image of hexagonal Mo2C structures on the Cu surface, (b,d) graphene surface. Reproduced with permission from Ref. [42].
Figure 4
Figure 4
(A) Chemical structures of nucleic acids: (a) DNA and RNA nucleotide, (b) locked nucleic acid, (c) peptide nucleic acid. (B) Schematic illustration of aptamer selection by positive and negative SELEX methods. Reproduced with permission from Ref. [60]. Copyright 2022, Elsevier.
Figure 5
Figure 5
(A). The DNA general construct in the library for selection of DNAzyme specific to Legionella pneumphila. (B) The random domain of selective Legionella pneumphila DNAzyme. (C) Representative construction of selected DNAzyme. R: Adenosine ribonucleotide, F: Fluorescein tail molecules, Q: quencher tail molecules (DABCYL). Redrawn based on Ref. [75].
Figure 6
Figure 6
(A) Scheme of fluorescent aptasensor for dual-targets detection with its signal amplification strategy. (B) (a,b) the fluorescence intensity of the aptasensor in the presence of VP (a) and ST (b). Inset: linear range for this aptasensor for two corresponding foodborne pathogens. Reproduced with permission from Ref. [81].
Figure 7
Figure 7
(A) (a) Diagram of the assembly process of electrochemical aptasensor for OTA analysis. (b) Voltammetric response of aptasensor in the presence of different OTA concentrations. (c) Relationship between the electrochemical response and OTA concentration. Inset. The linear relationship between the response and OTA concentration. Reproduced with permission from Ref. [87]. Copyright 2022, Elsevier. (B) (a) The construction of CRISPR/Cas12a-based fluorescent biosensor for AFB1 determination. (b) Measurement of AFB1 level in 12 peanut samples by the constructed fluorescent biosensor. (c) Pictures of 12 peanut samples tested positive (red) and negative (green). Reproduced from Ref. [92].
Figure 7
Figure 7
(A) (a) Diagram of the assembly process of electrochemical aptasensor for OTA analysis. (b) Voltammetric response of aptasensor in the presence of different OTA concentrations. (c) Relationship between the electrochemical response and OTA concentration. Inset. The linear relationship between the response and OTA concentration. Reproduced with permission from Ref. [87]. Copyright 2022, Elsevier. (B) (a) The construction of CRISPR/Cas12a-based fluorescent biosensor for AFB1 determination. (b) Measurement of AFB1 level in 12 peanut samples by the constructed fluorescent biosensor. (c) Pictures of 12 peanut samples tested positive (red) and negative (green). Reproduced from Ref. [92].
Figure 8
Figure 8
(A) (a) Illustration of STR electrochemical aptasensor construction. (b) Electrochemical response for six replications of STR detection. (c) Aptasensor stability after storing for 21 days. (d) Response of electrochemical signal for STR and interference evaluation. Reproduced with permission from Ref. [103]. Copyright 2022, Elsevier. (B) (a) Illustration of electrochemiluminescent (ECL) DNAzyme-based biosensor assembly for Pb2+ detection. (b) Responses of ECL of assembled DNAzyme-based biosensor in the presence of various Pb2+ concentrations. (c) The linear range of ECL biosensors for Pb2+ measurement. Reproduced with permission from Ref. [107].

Similar articles

Cited by

References

    1. Wang W., You Y., Gunasekaran S. LSPR-based colorimetric biosensing for food quality and safety. Compr. Rev. Food Sci. Food Saf. 2021;20:5829–5855. doi: 10.1111/1541-4337.12843. - DOI - PubMed
    1. Willemsen L., Wichers J., Xu M., Van Hoof R., Van Dooremalen C., Van Amerongen A., Peters J. Biosensing Chlorpyrifos in Environmental Water Samples by a Newly Developed Carbon Nanoparticle-Based Indirect Lateral Flow Assay. Biosensors. 2022;12:735. doi: 10.3390/bios12090735. - DOI - PMC - PubMed
    1. Lubin A.A., Plaxco K.W. Folding-based electrochemical biosensors: The case for responsive nucleic acid architectures. Acc. Chem. Res. 2010;43:496–505. doi: 10.1021/ar900165x. - DOI - PMC - PubMed
    1. McConnell E.M., Cozma I., Morrison D., Li Y. Biosensors made of synthetic functional nucleic acids toward better human health. Anal. Chem. 2019;92:327–344. doi: 10.1021/acs.analchem.9b04868. - DOI - PubMed
    1. Manzanares-Palenzuela C.L., Martín-Fernández B., López M.S.-P., López-Ruiz B. Electrochemical genosensors as innovative tools for detection of genetically modified organisms. TrAC Trends Anal. Chem. 2015;66:19–31. doi: 10.1016/j.trac.2014.10.006. - DOI

LinkOut - more resources