

Impact of Scala Tympani Geometry on Insertion Forces during Implantation
- PMID: 36354508
- PMCID: PMC9688204
- DOI: 10.3390/bios12110999
Impact of Scala Tympani Geometry on Insertion Forces during Implantation
Abstract
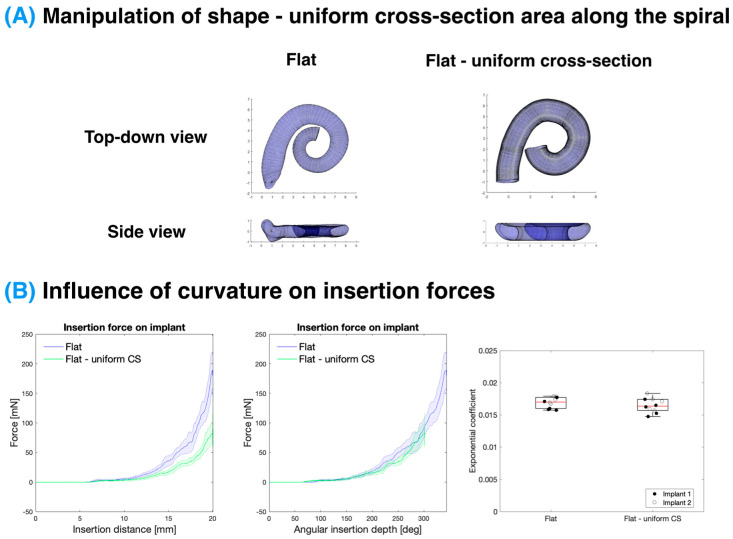
(1) Background: During a cochlear implant insertion, the mechanical trauma can cause residual hearing loss in up to half of implantations. The forces on the cochlea during the insertion can lead to this mechanical trauma but can be highly variable between subjects which is thought to be due to differing anatomy, namely of the scala tympani. This study presents a systematic investigation of the influence of different geometrical parameters of the scala tympani on the cochlear implant insertion force. The influence of these parameters on the insertion forces were determined by testing the forces within 3D-printed, optically transparent models of the scala tympani with geometric alterations. (2) Methods: Three-dimensional segmentations of the cochlea were characterised using a custom MATLAB script which parametrised the scala tympani model, procedurally altered the key shape parameters (e.g., the volume, vertical trajectory, curvature, and cross-sectional area), and generated 3D printable models that were printed using a digital light processing 3D printer. The printed models were then attached to a custom insertion setup that measured the insertion forces on the cochlear implant and the scala tympani model during a controlled robotic insertion. (3) Results: It was determined that the insertion force is largely unaffected by the overall size, curvature, vertical trajectory, and cross-sectional area once the forces were normalised to an angular insertion depth. A Capstan-based model of the CI insertion forces was developed and matched well to the data acquired. (4) Conclusion: By using accurate 3D-printed models of the scala tympani with geometrical alterations, it was possible to demonstrate the insensitivity of the insertion forces to the size and shape of the scala tympani, after controlling for the angular insertion depth. This supports the Capstan model of the cochlear implant insertion force which predicts an exponential growth of the frictional force with an angular insertion depth. This concludes that the angular insertion depth, rather than the length of the CI inserted, should be the major consideration when evaluating the insertion force and associated mechanical trauma caused by cochlear implant insertion.
Keywords: 3D printing; cochlear implant; insertion forces; micro-CT; scala tympani.
Conflict of interest statement
The authors declare no conflict of interest.
Figures


Similar articles
-
[Design of Scalable Model of Cochlear Scala Tympani].Zhongguo Yi Liao Qi Xie Za Zhi. 2021 Nov 30;45(6):622-627. doi: 10.3969/j.issn.1671-7104.2021.06.008. Zhongguo Yi Liao Qi Xie Za Zhi. 2021. PMID: 34862774 Chinese.
-
Effect of embedded dexamethasone in cochlear implant array on insertion forces in an artificial model of scala tympani.Otol Neurotol. 2015 Feb;36(2):354-8. doi: 10.1097/MAO.0000000000000521. Otol Neurotol. 2015. PMID: 25098590
-
Anatomically and mechanically accurate scala tympani model for electrode insertion studies.Hear Res. 2023 Mar 15;430:108707. doi: 10.1016/j.heares.2023.108707. Epub 2023 Jan 25. Hear Res. 2023. PMID: 36773540
-
The rational for a mid-scala electrode array.Eur Ann Otorhinolaryngol Head Neck Dis. 2016 Jun;133 Suppl 1:S61-2. doi: 10.1016/j.anorl.2016.05.002. Epub 2016 May 27. Eur Ann Otorhinolaryngol Head Neck Dis. 2016. PMID: 27246747 Review.
-
Scalar Translocation Comparison Between Lateral Wall and Perimodiolar Cochlear Implant Arrays - A Meta-Analysis.Laryngoscope. 2021 Jun;131(6):1358-1368. doi: 10.1002/lary.29224. Epub 2020 Nov 7. Laryngoscope. 2021. PMID: 33159469 Free PMC article.
Cited by
-
Incomplete Partition Type II Cochlear Malformations: Delineating the Three-Dimensional Structure from Digitized Human Histopathological Specimens.Otol Neurotol. 2023 Oct 1;44(9):881-889. doi: 10.1097/MAO.0000000000003999. Epub 2023 Aug 23. Otol Neurotol. 2023. PMID: 37621122 Free PMC article.
-
Hemagglutination Assay via Optical Density Characterization in 3D Microtrap Chips.Biosensors (Basel). 2023 Jul 14;13(7):733. doi: 10.3390/bios13070733. Biosensors (Basel). 2023. PMID: 37504130 Free PMC article.
-
First clinical implementation of insertion force measurement in cochlear implantation surgery.Front Neurol. 2024 Apr 22;15:1400455. doi: 10.3389/fneur.2024.1400455. eCollection 2024. Front Neurol. 2024. PMID: 38711559 Free PMC article.
-
Preclinical evaluation of a hydraulic actuation system with guide tube for robotic cochlear implant electrode insertion.Biomed Eng Online. 2025 Feb 14;24(1):19. doi: 10.1186/s12938-025-01338-z. Biomed Eng Online. 2025. PMID: 39953541 Free PMC article.
-
Models of Cochlea Used in Cochlear Implant Research: A Review.Ann Biomed Eng. 2023 Jul;51(7):1390-1407. doi: 10.1007/s10439-023-03192-3. Epub 2023 Apr 22. Ann Biomed Eng. 2023. PMID: 37087541 Free PMC article. Review.
References
-
- Deafness and Hearing Loss. [(accessed on 22 June 2022)]. Available online: https://www.who.int/news-room/fact-sheets/detail/deafness-and-hearing-loss.
-
- Vos T., Allen C., Arora M., Barber R.M., Bhutta Z.A., Brown A., Carter A., Casey D.C., Charlson F.J., Chen A.Z., et al. Global, regional, and national incidence, prevalence, and years lived with disability for 310 diseases and injuries, 1990–2015: A systematic analysis for the Global Burden of Disease Study 2015. Lancet. 2016;388:1545–1602. doi: 10.1016/S0140-6736(16)31678-6. - DOI - PMC - PubMed
-
- Adigun O.T. Depression and Individuals with Hearing Loss: A Systematic Review. J. Psychol. Psychother. 2017;7:1000323. doi: 10.4172/2161-0487.1000323. - DOI
-
- Cosh S., Carriere I., Daien V., Amieva H., Tzourio C., Delcourt C., Helmer C., the Sense-Cog Consortium The relationship between hearing loss in older adults and depression over 12 years: Findings from the Three-City prospective cohort study. Int. J. Geriatr. Psychiatry. 2018;33:1654–1661. doi: 10.1002/gps.4968. - DOI - PubMed
-
- Cosh S., Carriere I., Delcourt C., Helmer C., the Sense-Cog Consortium A dimensional approach to understanding the relationship between self-reported hearing loss and depression over 12 years: The Three-City study. Aging Ment. Health. 2021;25:954–961. doi: 10.1080/13607863.2020.1727845. - DOI - PubMed
MeSH terms
Grants and funding
LinkOut - more resources
Full Text Sources
Medical
