

Higher Concentrations of Folic Acid Cause Oxidative Stress, Acute Cytotoxicity, and Long-Term Fibrogenic Changes in Kidney Epithelial Cells
- PMID: 36354958
- PMCID: PMC10314330
- DOI: 10.1021/acs.chemrestox.2c00258
Higher Concentrations of Folic Acid Cause Oxidative Stress, Acute Cytotoxicity, and Long-Term Fibrogenic Changes in Kidney Epithelial Cells
Abstract
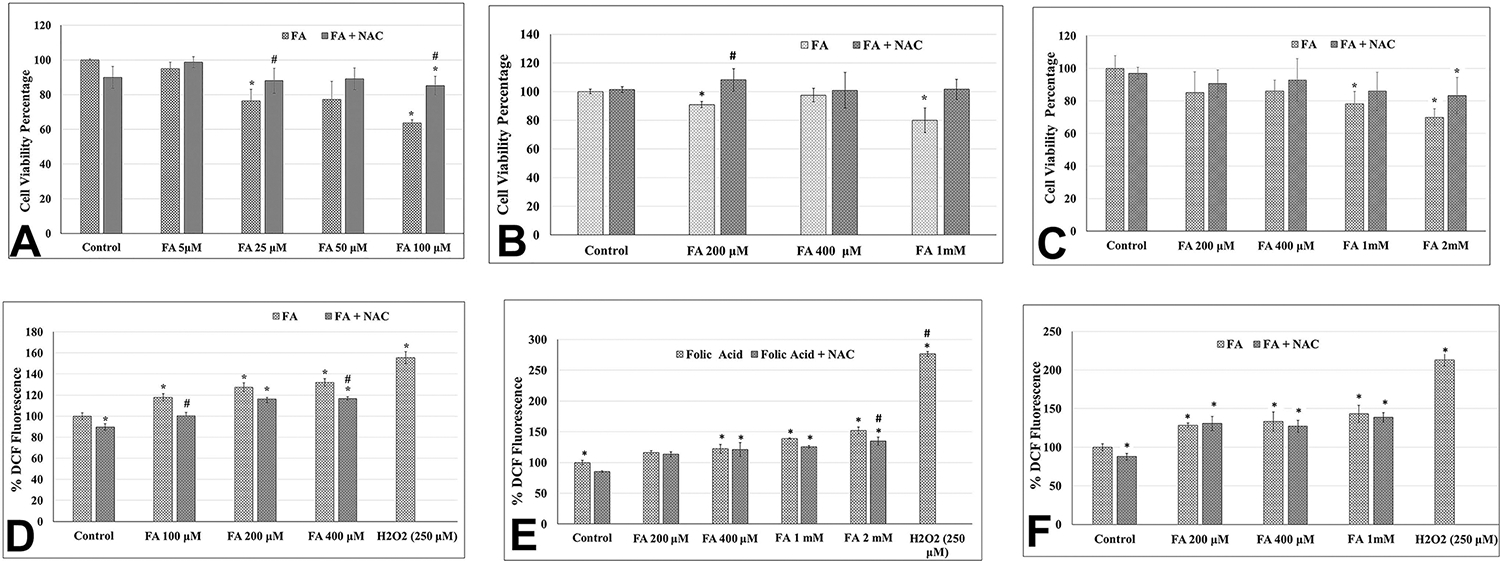
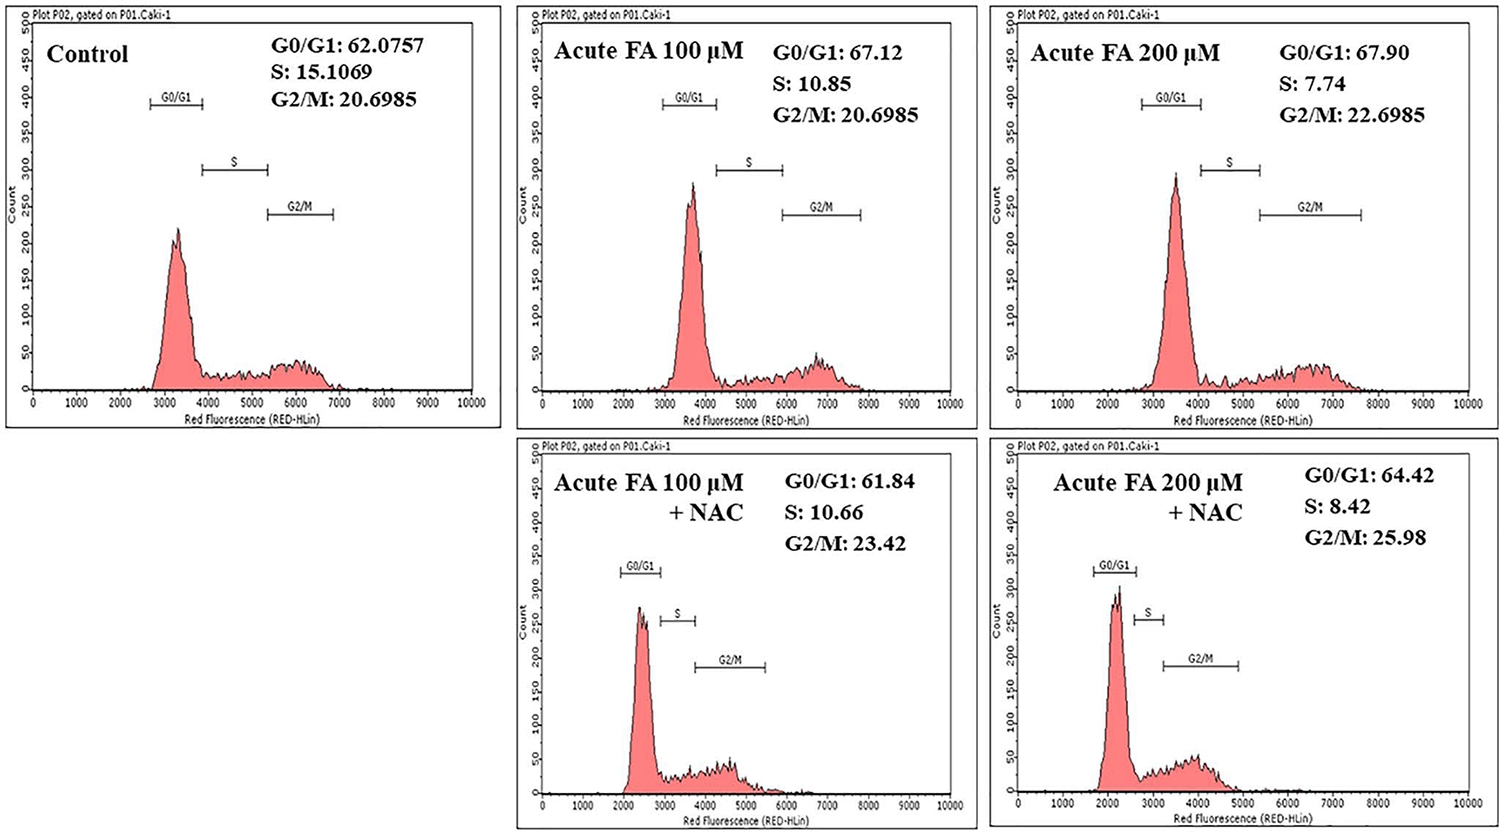
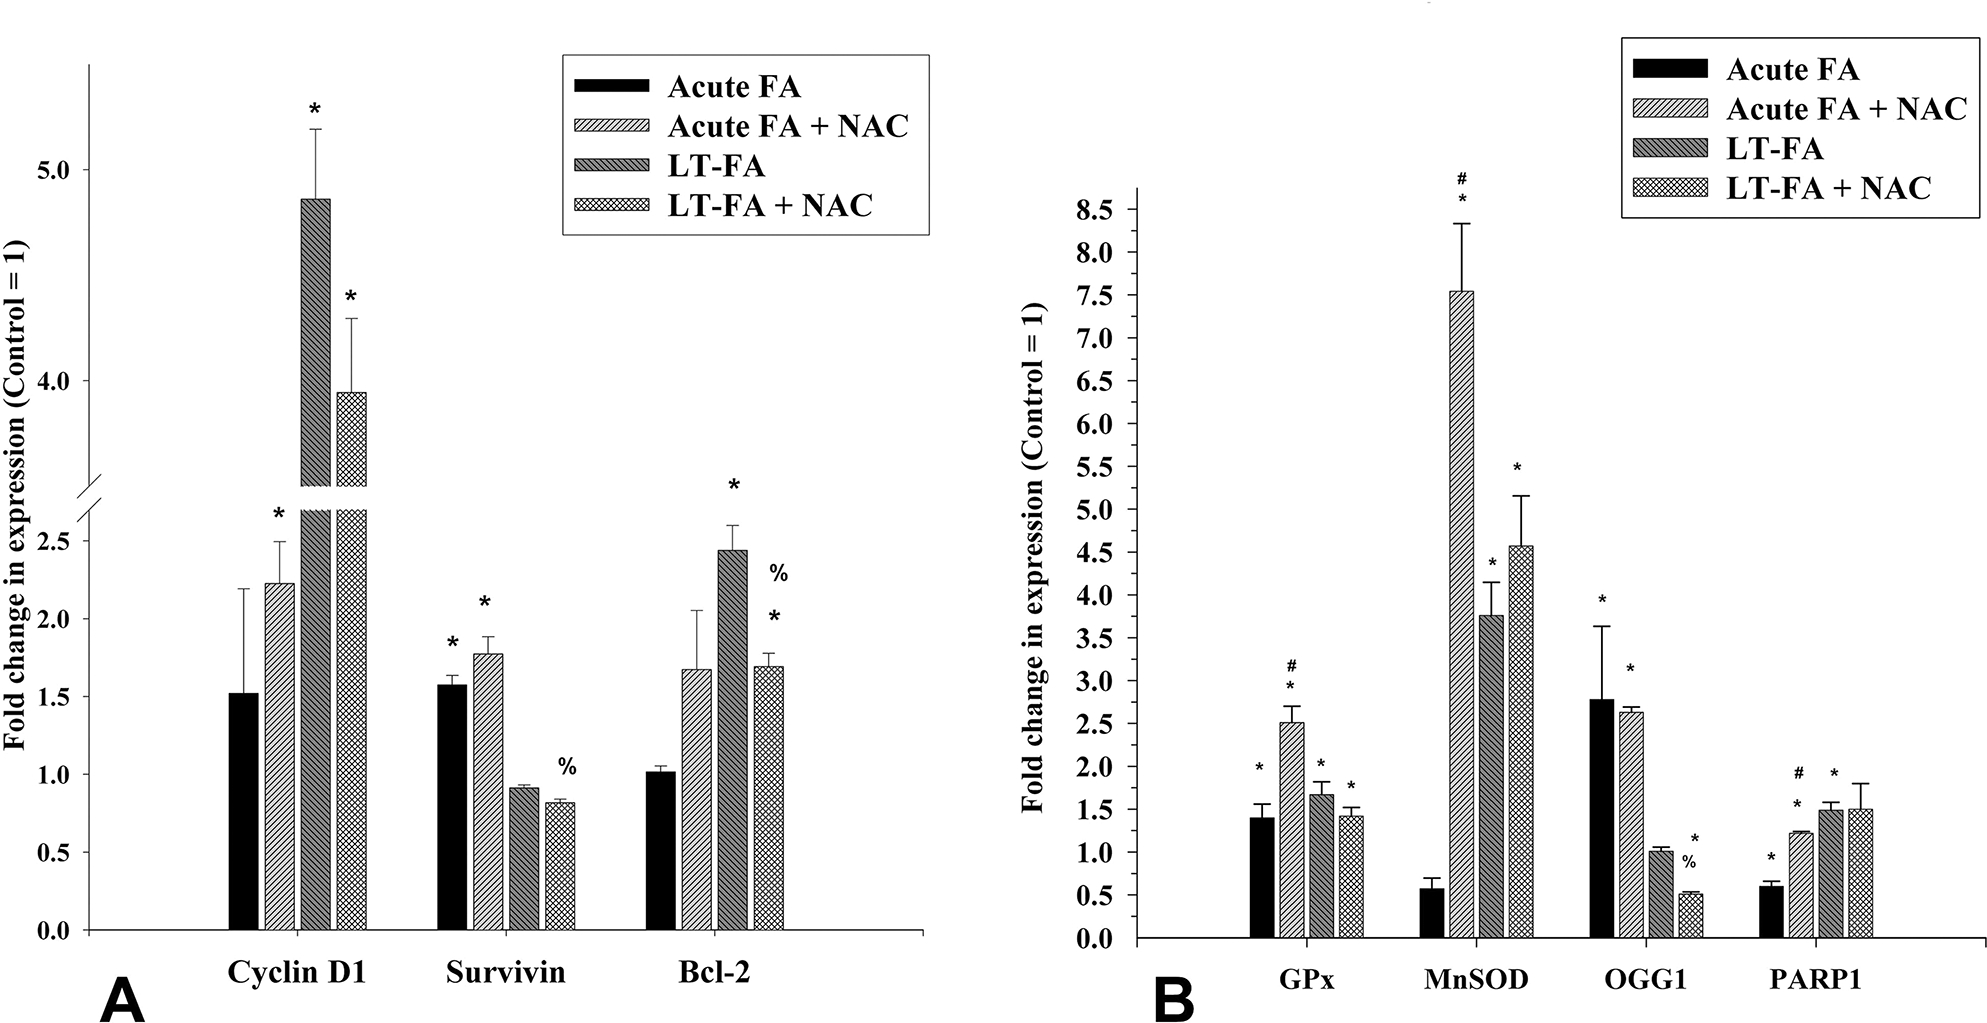
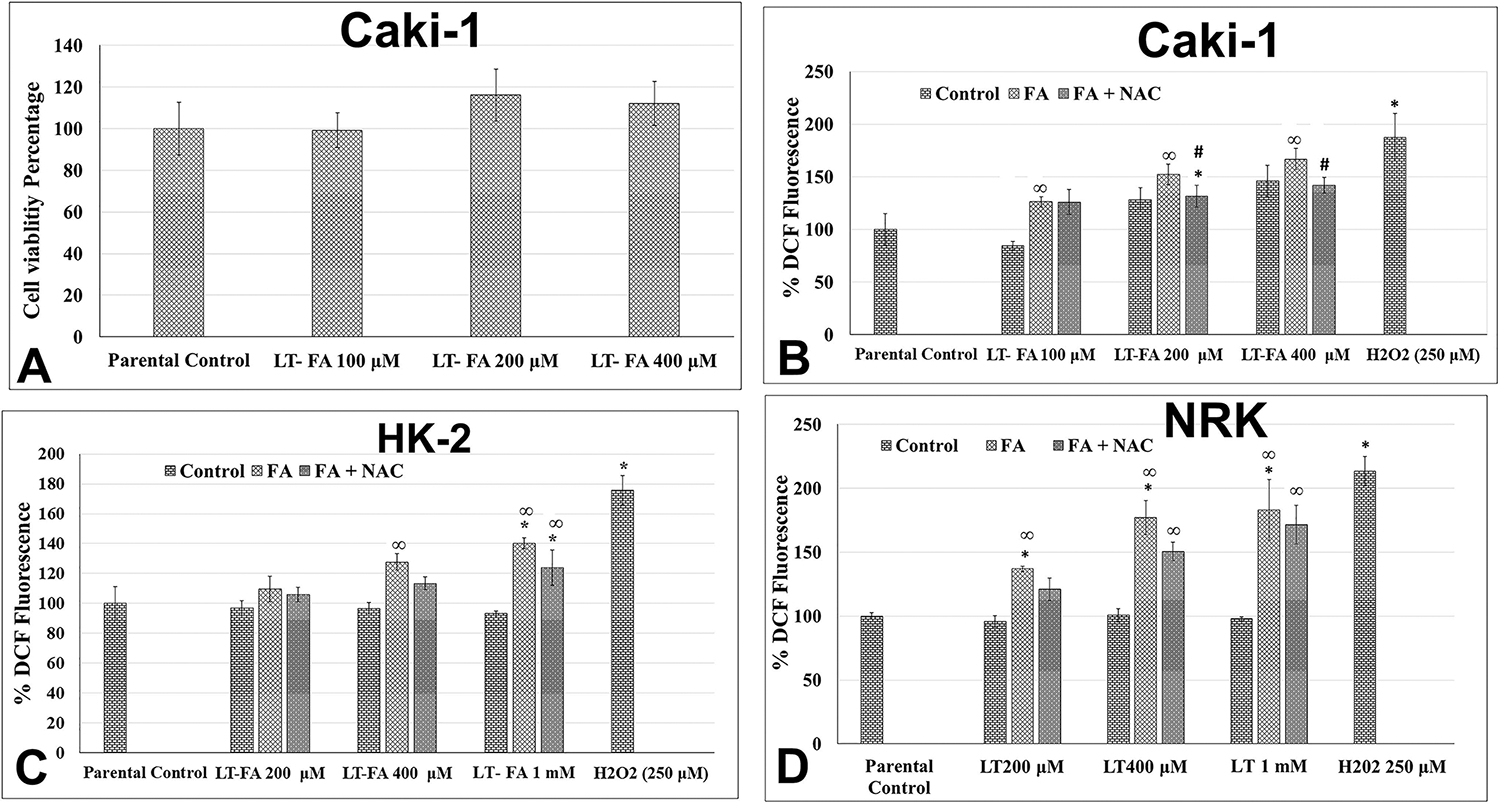
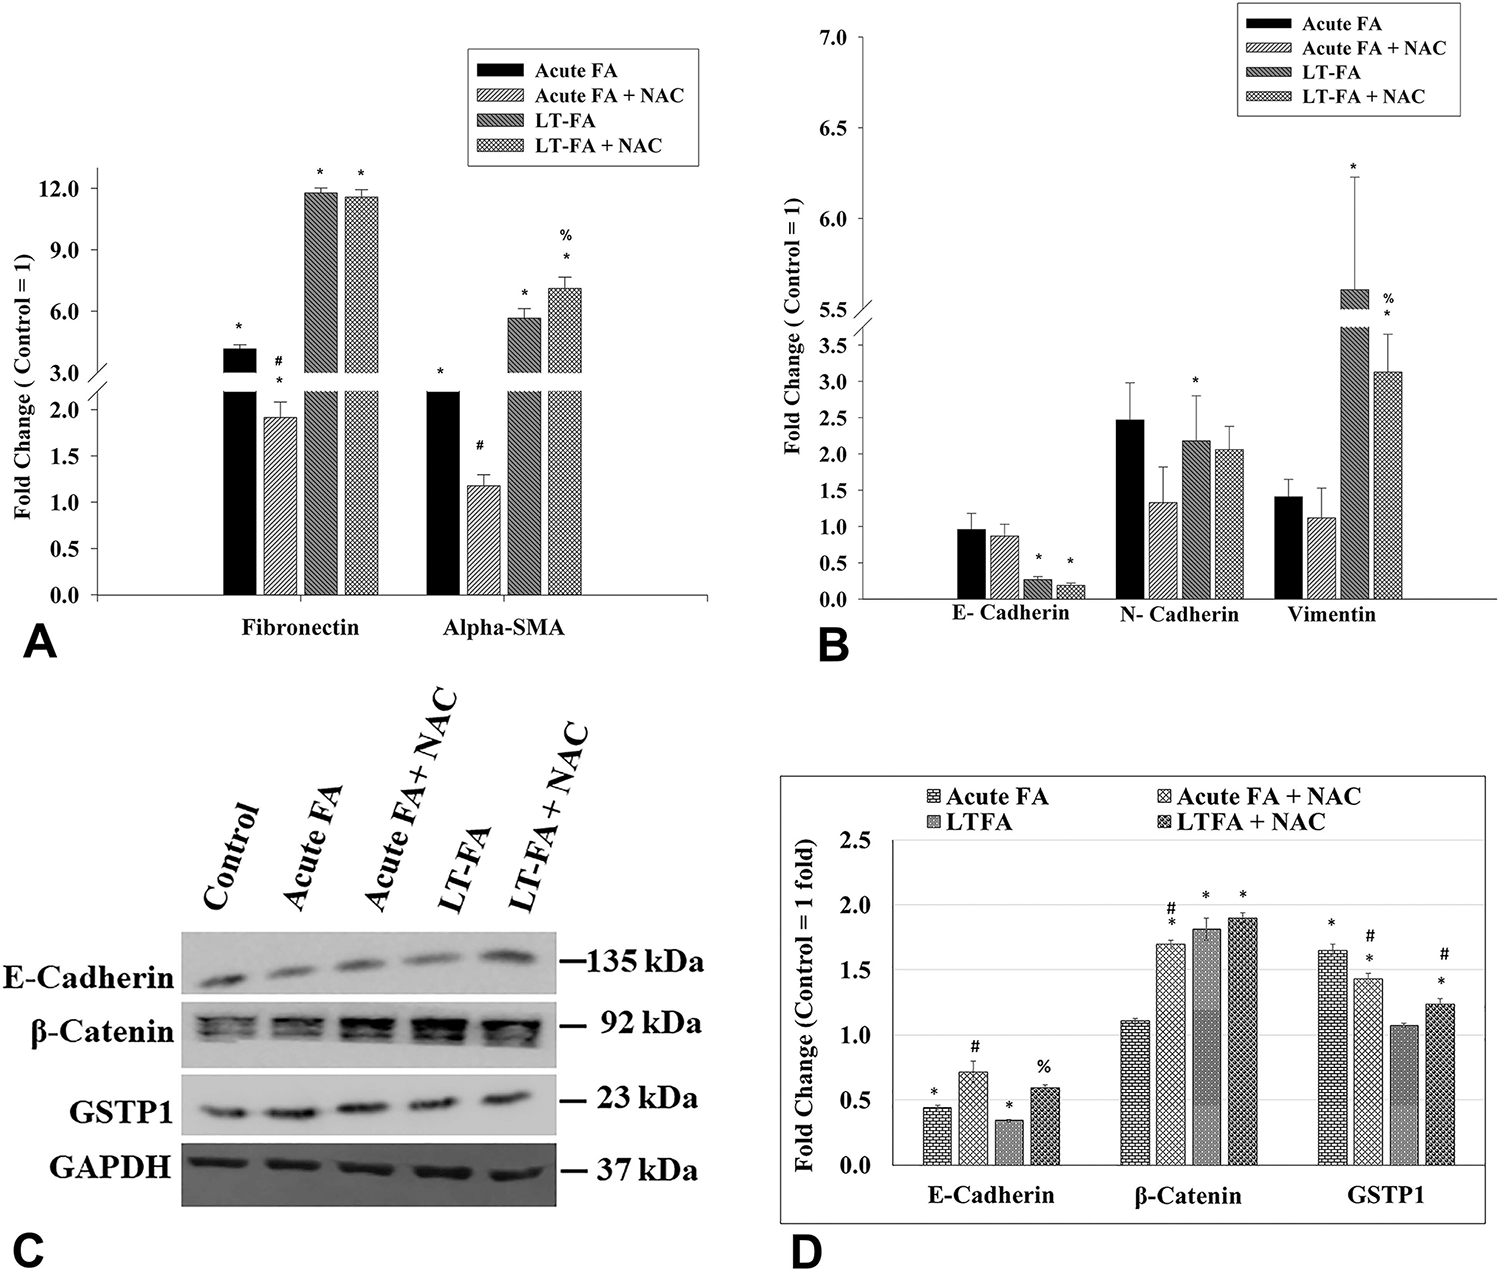
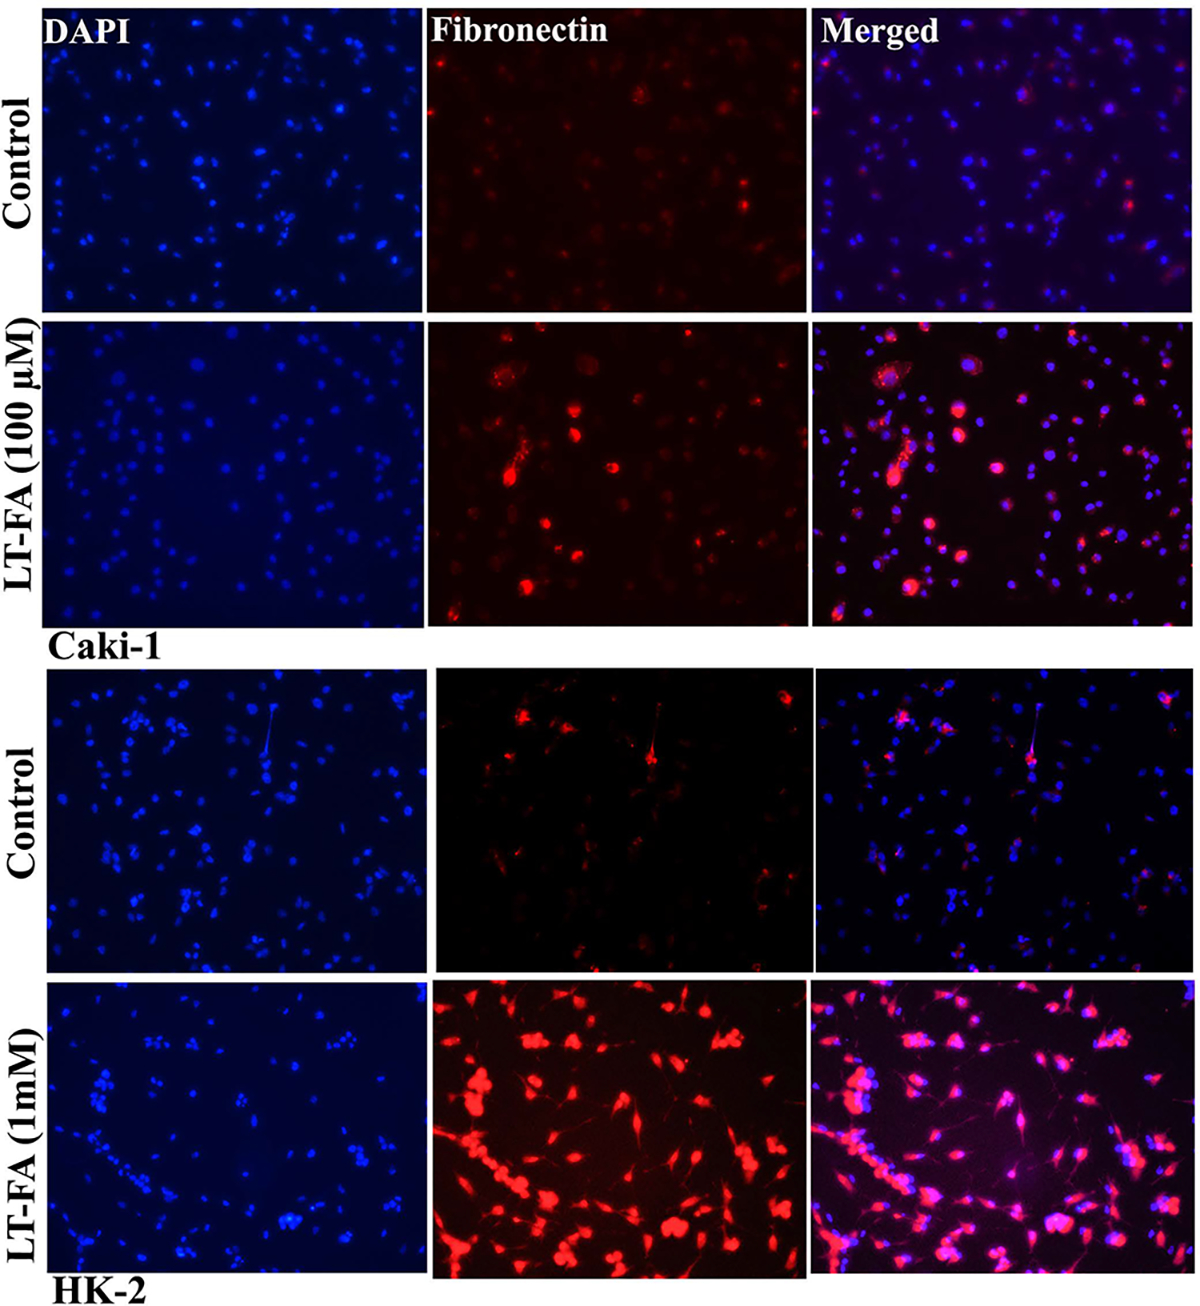
Kidney fibrosis is a common step during chronic kidney disease (CKD), and its incidence has been increasing worldwide. Aberrant recovery after repeated acute kidney injury leads to fibrosis. The mechanism of fibrogenic changes in the kidney is not fully understood. Folic acid-induced kidney fibrosis in mice is an established in vivo model to study kidney fibrosis, but the mechanism is poorly understood. Moreover, the effect of higher concentrations of folic acid on kidney epithelial cells in vitro has not yet been studied. Oxidative stress is a common property of nephrotoxicants. Therefore, this study evaluated the role of folic acid-induced oxidative stress in fibrogenic changes by using the in vitro renal proximal tubular epithelial cell culture model. To obtain comprehensive and robust data, three different cell lines derived from human and mouse kidney epithelium were treated with higher concentrations of folic acid for both acute and long-term durations, and the effects were determined at the cellular and molecular levels. The result of cell viability by the MTT assay and the measurement of reactive oxygen species (ROS) levels by the DCF assay revealed that folic acid caused cytotoxicity and increased levels of ROS in acute exposure. The cotreatment with antioxidant N-acetyl cysteine (NAC) protected the cytotoxic effect, suggesting the role of folic acid-induced oxidative stress in cytotoxicity. In contrast, the long-term exposure to folic acid caused increased growth, DNA damage, and changes in the expression of marker genes for EMT, fibrosis, oxidative stress, and oxidative DNA damage. Some of these changes, particularly the acute effects, were abrogated by cotreatment with antioxidant NAC. In summary, the novel findings of this study suggest that higher concentrations of folic acid-induced oxidative stress act as the driver of cytotoxicity as an acute effect and of fibrotic changes as a long-term effect in kidney epithelial cells.
Conflict of interest statement
The authors declare no competing financial interest.
Figures
Similar articles
-
Epigallocatechin-3-gallate attenuates arsenic-induced fibrogenic changes in human kidney epithelial cells through reversal of epigenetic aberrations and antioxidant activities.Biofactors. 2024 May-Jun;50(3):542-557. doi: 10.1002/biof.2027. Epub 2023 Dec 26. Biofactors. 2024. PMID: 38146662 Free PMC article.
-
Alleviating Oxidative Damage-Induced Telomere Attrition: a Potential Mechanism for Inhibition by Folic Acid of Apoptosis in Neural Stem Cells.Mol Neurobiol. 2022 Jan;59(1):590-602. doi: 10.1007/s12035-021-02623-3. Epub 2021 Nov 5. Mol Neurobiol. 2022. PMID: 34741234
-
N-acetylcysteine protects against diabetic nephropathy through control of oxidative and nitrosative stress by recovery of nitric oxide in rats.Nitric Oxide. 2018 Aug 1;78:22-31. doi: 10.1016/j.niox.2018.05.003. Epub 2018 May 18. Nitric Oxide. 2018. PMID: 29778909
-
The balance of powers: Redox regulation of fibrogenic pathways in kidney injury.Redox Biol. 2015 Dec;6:495-504. doi: 10.1016/j.redox.2015.09.039. Epub 2015 Sep 26. Redox Biol. 2015. PMID: 26448394 Free PMC article. Review.
-
N-acetyl-cysteine and the control of oxidative stress during in vitro ovarian follicle growth, oocyte maturation, embryo development and cryopreservation.Anim Reprod Sci. 2021 Aug;231:106801. doi: 10.1016/j.anireprosci.2021.106801. Epub 2021 Jul 6. Anim Reprod Sci. 2021. PMID: 34252825 Review.
Cited by
-
Epigenetic therapeutics attenuate kidney injury and fibrosis by restoring the expression of epigenetically reprogrammed fibrogenic genes and signaling pathways.Eur J Pharm Sci. 2025 Jan 1;204:106977. doi: 10.1016/j.ejps.2024.106977. Epub 2024 Nov 29. Eur J Pharm Sci. 2025. PMID: 39617304 Free PMC article.
-
Radiosensitizing properties of dual-functionalized carbon nanostructures loaded with temozolomide.Beilstein J Nanotechnol. 2025 Feb 19;16:229-251. doi: 10.3762/bjnano.16.18. eCollection 2025. Beilstein J Nanotechnol. 2025. PMID: 39995757 Free PMC article.
-
Anemia of Chronic Kidney Disease-A Narrative Review of Its Pathophysiology, Diagnosis, and Management.Biomedicines. 2024 May 27;12(6):1191. doi: 10.3390/biomedicines12061191. Biomedicines. 2024. PMID: 38927397 Free PMC article. Review.
-
Computer-aided repositioning and functional in vitro assessment of novel PAD4 inhibitors.RSC Med Chem. 2025 Jun 30. doi: 10.1039/d5md00395d. Online ahead of print. RSC Med Chem. 2025. PMID: 40697620 Free PMC article.
-
Loss of PCAF in proximal tubular cells exacerbates renal fibrosis by promoting partial epithelial-to-mesenchymal transition.Exp Mol Med. 2025 Sep 1. doi: 10.1038/s12276-025-01533-x. Online ahead of print. Exp Mol Med. 2025. PMID: 40887504
References
-
- Prevention, C. f. D. C. a. Chronic Kidney Disease in the United States; U.S. Department of Health and Human Services: Atlanta, GA, 2021.
Publication types
MeSH terms
Substances
Grants and funding
LinkOut - more resources
Full Text Sources
Medical
