. 2022 Nov 2;12(11):1058.
doi: 10.3390/metabo12111058.

Plasma Metabolome Alterations Discriminate between COVID-19 and Non-COVID-19 Pneumonia

Affiliations

Plasma Metabolome Alterations Discriminate between COVID-19 and Non-COVID-19 Pneumonia

Tushar H More et al. Metabolites. .

Abstract

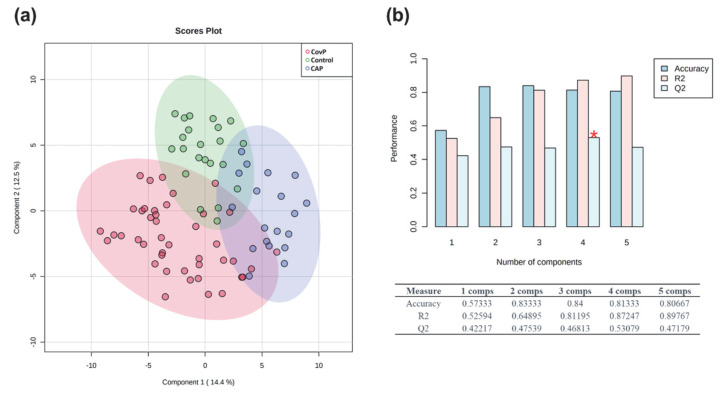
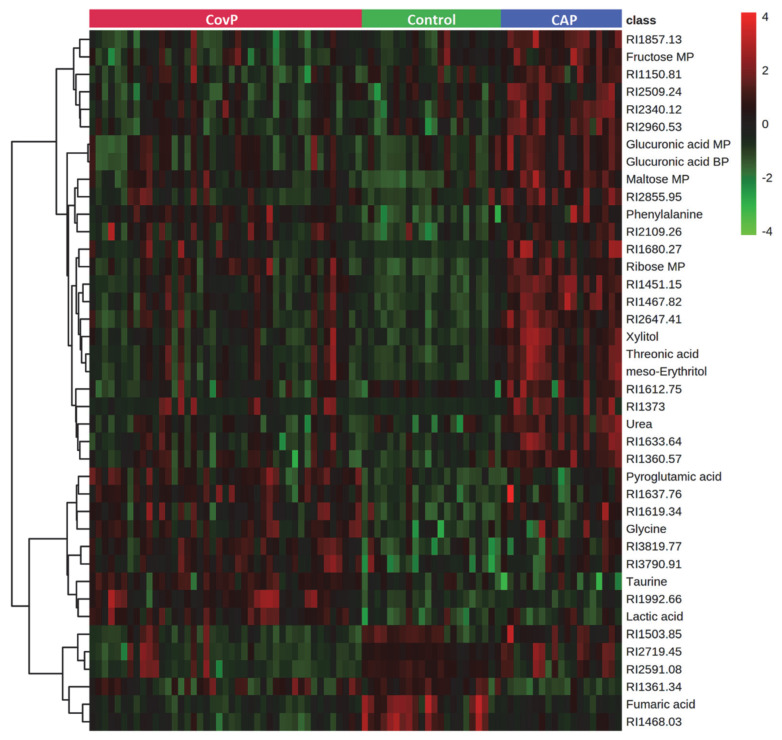
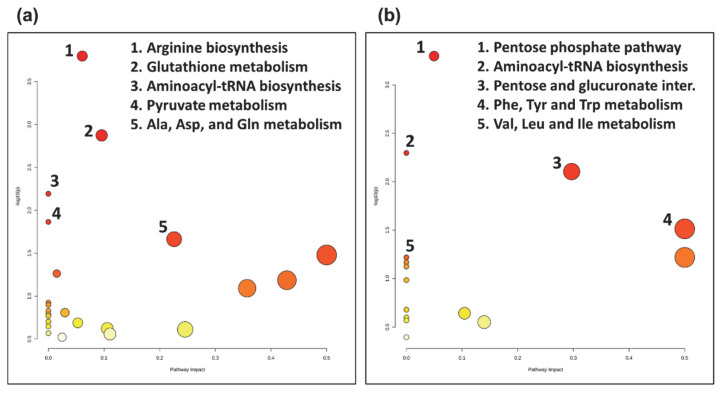
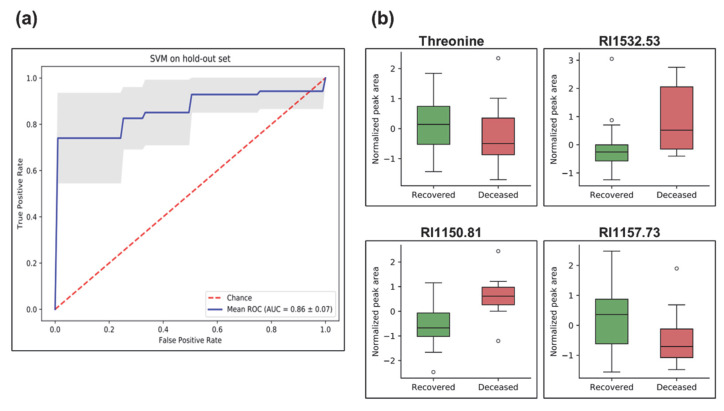
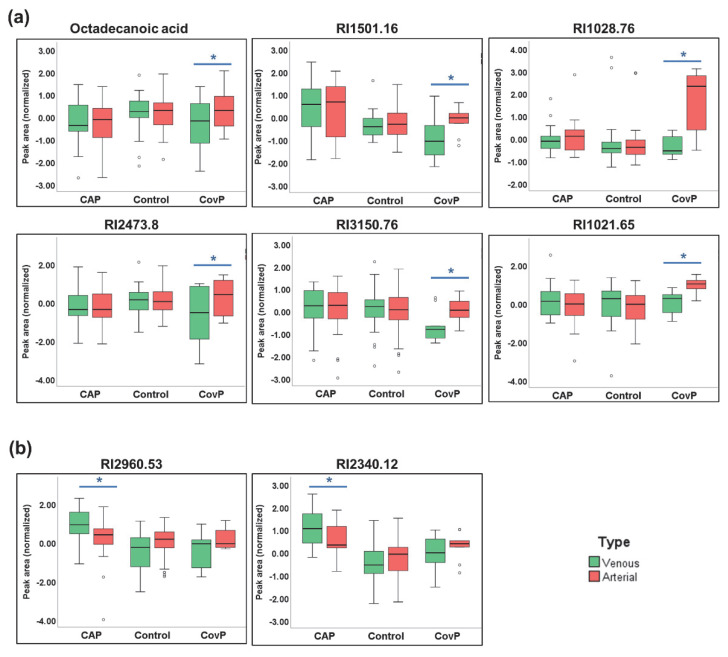
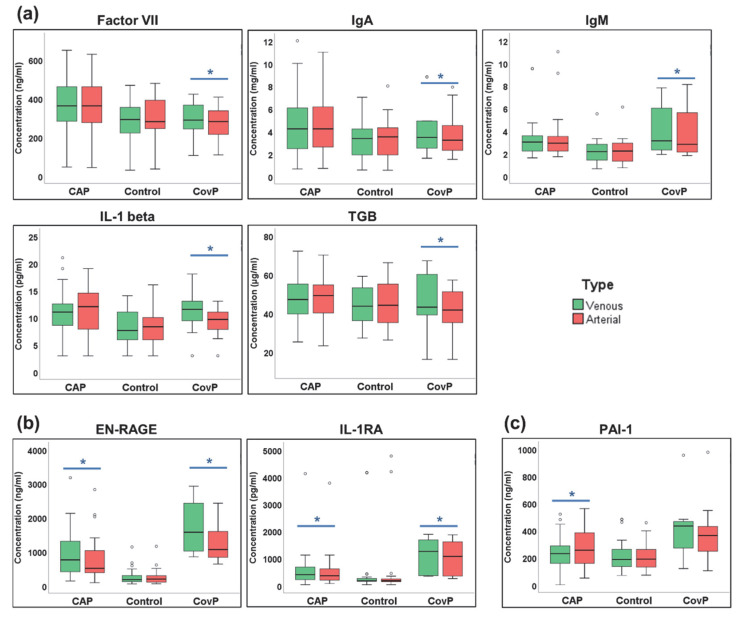
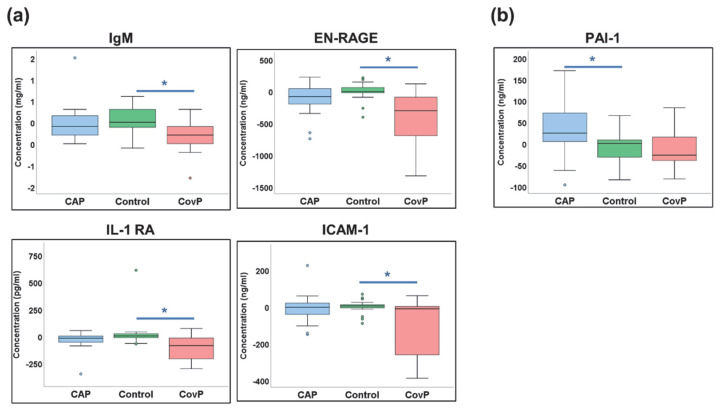
Pneumonia is a common cause of morbidity and mortality and is most often caused by bacterial pathogens. COVID-19 is characterized by lung infection with potential progressive organ failure. The systemic consequences of both disease on the systemic blood metabolome are not fully understood. The aim of this study was to compare the blood metabolome of both diseases and we hypothesize that plasma metabolomics may help to identify the systemic effects of these diseases. Therefore, we profiled the plasma metabolome of 43 cases of COVID-19 pneumonia, 23 cases of non-COVID-19 pneumonia, and 26 controls using a non-targeted approach. Metabolic alterations differentiating the three groups were detected, with specific metabolic changes distinguishing the two types of pneumonia groups. A comparison of venous and arterial blood plasma samples from the same subjects revealed the distinct metabolic effects of pulmonary pneumonia. In addition, a machine learning signature of four metabolites was predictive of the disease outcome of COVID-19 subjects with an area under the curve (AUC) of 86 ± 10 %. Overall, the results of this study uncover systemic metabolic changes that could be linked to the etiology of COVID-19 pneumonia and non-COVID-19 pneumonia.

Keywords: COVID-19; community-acquired pneumonia; machine learning; mass spectrometry; metabolic profiling; metabolomics; multivariate statistics; non-COVID-19 pneumonia; plasma; system biology.


Conflict of interest statement

The authors declare no conflict of interest.

Figures

Figure 1
Figure 1
Exploratory multivariate statistical analysis. (a) Partial least square discriminant analysis (PLS-DA) score plot depicting clustering of COVID-19 pneumonia (CovP), control, and non-COVID-19 pneumonia (CAP) samples. (b) Plot obtained after performing a random permutation test with 100 permutations on PLS-DA model. The red asterisk indicates the best classifier (R2 = 0.87, Q2 = 0.53), R2 is the explained variance, and Q2 is the predictive ability of the model. Q2 represents the model’s predictive ability and is calculated by comparing the predicted data with the original data. The calculated prediction error (Predicted Residual Sum of Squares or PRESS) is divided by the initial sum of squares and subtracted from 1. High R2 and Q2 values represent the model’s good predictive ability and confirm our PLS-DA model’s validity. The inset table summarizes Q2, R2, and the accuracy of the best model. Comps mean the number of components.
Figure 2
Figure 2
Heatmap of top 40 significantly altered metabolites in group comparison (COVID-19 pneumonia (CovP), control subjects, and non-COVID-19 pneumonia (CAP)) selected after ANOVA (p < 0.05). The colors from green to red indicate the increased concentration (normalized peak area) of metabolites.
Figure 3
Figure 3
Topology map of altered metabolic pathways describing the impact of metabolites selected from comparative post-hoc analysis (Tukey’s HSD). (a) The top five altered metabolic pathways in the COVID-19 pneumonia (CovP) group. 1. Arginine biosynthesis, 2. Glutathione metabolism, 3. Aminoacyl-tRNA biosynthesis, 4. Pyruvate metabolism, 5. Alanine, aspartate, and glutamate metabolism. (b) The top five altered metabolic pathways in the non-COVID-19 pneumonia (CAP) group. 1. Pentose phosphate pathway, 2. Aminoacyl-tRNA biosynthesis, 3. Pentose and glucuronate interconversions, 4. Phenylalanine, tyrosine, and tryptophan metabolism, 5. Valine, leucine and isoleucine metabolism.
Figure 4
Figure 4
Machine learning analysis using support vector machine (SVM) depicting prediction of disease outcome (recovered vs. deceased) in COVID-19 pneumonia subjects. (a) Receiver operating characteristic (ROC) plot of the true positive rate (i.e., sensitivity) and the false positive rate (i.e., 1-specificity). ROC is used to evaluate classification models that classify subjects into one of two categories (recovered or deceased). The area under the ROC curve provides a way to measure the accuracy (1 highest and less than 0.5 low). The present classifier correctly classifies the cohort for disease outcome (recovered vs. deceased) with an area under (AUC) the ROC of 86 ± 10%. The blue line is the mean and the grey area is the standard deviation of all ROCs of train split. (b) Box-and-whisker plots of metabolites used in the SVM classifier model, illustrated as normalized peak area differences between recovered (green box) vs. deceased (red box) subjects.
Figure 5
Figure 5
Significant metabolite differences in venous and arterial samples revealed by repeated-measures ANOVA. (a) Box-and-whisker plots of COVID-19 pneumonia (CovP) specific significant metabolic differences in venous (green box) and arterial samples (red box). (b) Box-and-whisker plots of non-COVID-19 pneumonia (CAP) specific significant metabolic differences in venous (green box) and arterial samples (red box). (Asterisk indicates p ≤ 0.05).
Figure 6
Figure 6
Significant cytokines differences in venous and arterial samples. (a) Box-and-whisker plots of COVID-19 pneumonia (CovP) specific significant cytokine differences. (b) Box-and-whisker plots of both non-COVID-19 pneumonia (CAP) and COVID-19 specific significant cytokine differences; (c) Box-and-whisker plots of both non-COVID-19 pneumonia (CAP) specific significant cytokine differences. (Venous (green box), arterial samples (red box), an asterisk indicates p-value ≤ 0.05).
Figure 7
Figure 7
Cytokines with significant differences in the delta values. (a) Box-and-whisker plots of COVID-19 pneumonia (CovP) specific significant differences in delta values as compared to controls. (b) Box-and-whisker plots of both non-COVID-19 pneumonia (CAP) specific significant cytokine differences in delta values as compared to controls. [non-COVID-19 pneumonia (blue box), Control samples (green box), COVID-19 pneumonia (red box), an asterisk indicates p-value ≤ 0.05].

Similar articles

Cited by

References

    1. Lake M.A. What We Know so Far: COVID-19 Current Clinical Knowledge and Research. Clin. Med. 2020;20:124–127. doi: 10.7861/clinmed.2019-coron. - DOI - PMC - PubMed
    1. Yuen K.S., Ye Z.W., Fung S.Y., Chan C.P., Jin D.Y. SARS-CoV-2 and COVID-19: The Most Important Research Questions. Cell Biosci. 2020;10:40. doi: 10.1186/s13578-020-00404-4. - DOI - PMC - PubMed
    1. Zhu N., Zhang D., Wang W., Li X., Yang B., Song J., Zhao X., Huang B., Shi W., Lu R., et al. Brief Report: A Novel Coronavirus from Patients with Pneumonia in China, 2019. N. Engl. J. Med. 2020;382:727. doi: 10.1056/NEJMoa2001017. - DOI - PMC - PubMed
    1. Fu L., Wang B., Yuan T., Chen X., Ao Y., Fitzpatrick T., Li P., Zhou Y., Lin Y.F., Duan Q., et al. Clinical Characteristics of Coronavirus Disease 2019 (COVID-19) in China: A Systematic Review and Meta-Analysis. J. Infect. 2020;80:656–665. doi: 10.1016/j.jinf.2020.03.041. - DOI - PMC - PubMed
    1. Chowdhury S.D., Oommen A.M. Epidemiology of COVID-19. J. Dig. Endosc. 2020;11:3. doi: 10.1055/s-0040-1712187. - DOI

LinkOut - more resources